Slater and Mott insulating states in the SU(6) Hubbard model
Abstract
We perform large scale projector determinant quantum Monte-Carlo simulations to study the insulating states of the half-filled SU(6) Hubbard model on the square lattice. The transition from the antiferromagnetic state to the valence bond solid state occurs as increasing the Hubbard . In contrast, in the SU(2) and SU(4) cases antiferromagnetism persists throughout the entire interaction range. In the SU(6) case, antiferromagnetism starts to develop in the weak interacting regime based on the Slater mechanism of Fermi surface nesting. As passes a crossover value , the single-particle gap scales linearly with , marking the onset of Mott physics. In the Mott regime, antiferromagnetism becomes to be suppressed as increases, and vanishes after passes the critical value . The critical exponents are obtained via critical scalings as and . As further increases, the valence bond solid ordering appears exhibiting the anomalous dimension .
I introduction
How repulsive interactions turn a partially filled electron band into the insulating state is an important question of strong correlation physics. In the presence of nested Fermi surfaces, the antiferromagnetic (AF) order appears at infinitesimal interactions based on Fermi surface nesting. The single-particle gap is at the same order of the AF gap function Slater (1951). Such a state is known as the Slater insulator exhibiting strong charge fluctuations. On the other hand, charge fluctuations are frozen in the strong interaction regime due to the large charge gap linearly scaling with the repulsive interaction Mott (1949), and such a state is Mott insulating. The low energy physics lies in the spin channel arising from the superexchange among local spin moments. Mott insulators can even exhibit no symmetry breaking, for example, the 1D Hubbard model at half-filling exhibits power-law AF correlations and charge gap, but without long-range AF ordering.
However, in strongly correlated electron systems, the above two pictures of insulators are often blended together Imada et al. (1998); Lee et al. (2006). For example, in the half-filled SU(2) Hubbard model on the square lattice, Fermi surface nesting leads to the Slater AF state at weak , while the strong side is effectively described by the Heisenberg model and attributed to the Mott AF insulator. Both regimes exhibit the commensurate Neel ordering smoothly connected by a crossover Hirsch (1985); *Hirsch_PRL_1989; Pruschke and Zitzler (2003).
In recent years, the rapid development of ultra-cold atom physics provides a new route to investigate strong correlation physics. It was proposed that cold fermions with multiple spin components are ideal systems to study high symmetries that typically are met in high energy physics Wu et al. (2003); *Wu_MPLB_2006; Honerkamp and Hofstetter (2004); Wu (2012). For example, the spin-3/2 fermion systems possess a generic Sp(4) symmetry without fine-tuning, which is further enlarged to SU(4) when the interaction is spin-independent. These symmetries play an important role to study novel quantum magnetism beyond SU(2) Wu et al. (2003); *Wu_MPLB_2006; Wu (2005); Hung et al. (2011); Xu and Wu (2008); Wang et al. (2014); Chen et al. (2005). The study of high symmetric ultra-cold fermions has been attracting considerable interests both experimental and theoretical recently Wu et al. (2003); *Wu_MPLB_2006; Honerkamp and Hofstetter (2004); DeSalvo et al. (2010); *Taie_PRL_2010; Krauser et al. (2012); *Taie_NP_2012; *Zhang_S_2014; Cazalilla and Rey (2014); *Laflamme_AP_2016.
As for the SU(4) Hubbard model at half-filling on the square lattice, i.e., two fermions per site, a pervious determinant quantum Monte Carlo shows that the AF order is non-monotonic as increases: After reaching a maximal at , the AF order starts to decrease but remains finite throughout the interaction range simulated Wang et al. (2014). Meanwhile, the system exhibits no valence bond solid (VBS) ordering. A recent study directly on the SU(4) Heisenberg model with the one column self-conjugate representation also shows the survival of the AF order Kim et al. (2019), hence, the AF order should also persist through the entire interaction range. The SU(4) and SU(6) Hubbard models of Dirac fermions in the honeycomb lattice and the -flux square lattice exhibit the transition from the Dirac semi-metal phase to VBS state and show the absence of the AF order Zhou et al. (2016, 2018). In contrast, the half-filled SU(6) Hubbard model in the square lattice behaves very differently. The QMC simulations show a transition from the AF state at weak to the VBS state at strong Wang et al. (2014); Lang (2015). In the weak limit, the AF is a direct consequence of the Fermi surface nesting and the Van Hove singularity, while the VBS state is a manifestation of the Mott physics. How such a Slater to Mott transition occurs is an interesting and open question, which is the main aim of the present work.
On the other hand, the quantum phase transition from the AF state to the VBS one is argued to be continuous as a result of the deconfined criticality beyond the Landau-Ginzburg-Wilson paradigm Senthil (2004); *Senthil_PRB_2004; *Levin_PRB_2004. Such a prediction has been supported by numerical simulations in recent years. Sandvik (2007); Melko and Kaul (2008); *Sandvik_PRL_2010; *Kaul_PRL_2012; *Pujari_PRL_2013; *Shao_S_2016; *Nahum_PRX_2015; *Wang_PRB_2016; *Assaad_PRX_2016. But there are also works claiming the first order phase transition Kragset et al. (2006); *Kuklov_AP_2006; *Kuklov_PRL_2008; *Sen_PRB_2010; *Papanikolaou_PRL_2010; *Block_PRL_2013; *DEmidio_PRB_2016; *DEmidio_PRL_2017. Nearly all these models studied so far are based on quantum spin models in which charge fluctuations are frozen. It would be interesting to directly investigate the transition between the AF and VBS states based on the fermionic Hubbard model, which takes into account both charge and spin fluctuations.
An additional motivation of this work is the AF order studied below belongs to the self-conjugate representation of SU(N), which could be described by the nonlinear -model MacFarlane (1979); Duerksen (1981); Read and Sachdev (1989a); *Read_NPB_1989; *Read_PRB_1990. The symmetry class is different from the widely studied CPN-1 model which respects the fundamental representation corresponding to the case of . Therefore, the AF phase transition here (if continuous) belongs to a different universality class, whose critical exponents would be desired to calculate to characterize such a university class.
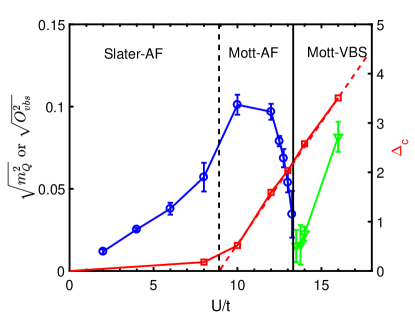
In this work, we apply the projector determinant QMC free of the sign problem to study the half-filled SU(6) Hubbard model on the square lattice. Our main results are shown in Fig. 1. From the slope of the single-particle gap, a crossover from the Slater to Mott insulating regime around accompanied by the obvious enhancement of the AF order. The AF order reaches the maximum around and then starts to drop as further increases. In the Mott insulator side, the vanishing of the AF order occurs at , and simulations show a continuous transition with the critical exponents and . As for the appearance of the VBS order, , and more nature of this transition will be deferred for a future study.
II The model definition and QMC parameters
The SU() Hubbard model on the square lattice at half-filling is defined as
| (1) |
where is a fermion annihilation operator with the site index and the flavor index satisfying . The -term represents hoppings between the nearest neighbour sites, and is the hopping integral. The -term describes the on-site Hubbard interaction as usual and the onsite particle number . Eq. 1 satisfies the particle-hole symmetry, hence, the average particle number per site is fixed at , and the chemical potential is not shown explicitly. When , Eq. 1 goes back to the usual spin- Hubbard model. In this article, we focus on .
The half-filled SU() (with even ) Hubbard model on a bipartite lattice is free of sign problem in auxiliary field QMC simulations as a result of the particle-hole symmetryCai et al. (2013a), which enables us to perform large scale simulations. Details of the algorithm can be found elsewhere Assaad and Evertz (2008); Wang et al. (2014); Zhou et al. (2016), and will not be repeated here. In our simulations, the projection time is used, which is long enough to achieve convergence for a given linear lattice size up to . The discrete time slice is chosen. For each group of parameters, the simulation is performed on 24 cores with 1000 Monte Carlo steps for warming up and no less than 1000 steps for measurements on each core. The exception is the case of which is performed on 48 cores with 500 Monte-Carlo steps for warming up and no less then 500 steps for measurements.
For later convenience, we define the following correlation functions. For the AF order, due to the SU(6) symmetry, we take the diagonal component of the spin-moment operator
| (2) |
whose largest eigenvalue is normalized to 1/2 as in the case of SU(2). The Fourier component of spin-moment at corresponds to the AF order parameter . Due to the finite sizes of QMC simulations, there is no spontaneous symmetry breaking, and we measure spin structural factor defined as the equal-time spin-spin correlation,
| (3) |
To describe the VBS order, we define the kinetic dimer operator,
| (4) |
where . Then the VBS order parameters and are defined as the Fourier components at and , respectively,
| (5) |
Again, we directly measure the structure factor of dimer-dimer correlation
| (6) |
In large limit (Heisenberg limit), the kinetic dimer order is equivalent to the spin-Peierls VBS defined as
| (7) |
for the SU() Heisenberg models Read and Sachdev (1989a); *Read_NPB_1989; *Read_PRB_1990; Marston and Affleck (1989) through the 2nd order perturbation theory. (For finite , charge fluctuations may cause the inequivalence of these two kinds of VBS definitions.) Based on the AF and VBS structure factors and , we further denote
| (8) |
In the presence of long-range ordering of AF and VBS, and exhibit non-vanishing values in the thermodynamic limit , respectively.
III QMC simulation results
We first present the single particle gap extracted from the slope of , where is the single particle Green’s function defined as . The momentum is taken at on the Fermi surface. The results for are shown in Fig. 1. When , it shows very little size dependence, because it describes the local charge fluctuations with a very short charge coherence length estimated as . Hence, the results at already can be taken as the thermodynamic limit. An interesting observation is the nearly linear dependence of on at , whose slope is very close to 1/2, indicating the characteristic feature of the Mott insulator. This is consistent with that in the atomic limit, i.e., , which is simply , the energy cost by adding or removing an electron on the half-filled Mott insulating background. On the other hand, in the regime , keeps at very small values, which is consistent with the AF insulators based on the Fermi surface nesting as in a Slater insulator. Therefore, we take as a crossover from the Slater to Mott regimes since no symmetry breaking occurs.
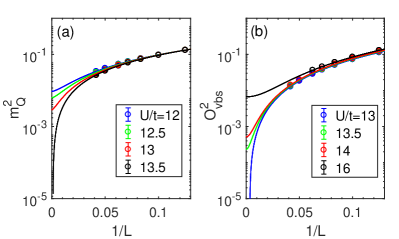
Next we consider the AF and VBS orderings near the AF-VBS transition by performing the finite size extrapolation of and at . Without a precise knowledge of finite size effects in prior, we have tried different fitting functions. It turns out that the usual polynomial (neither square nor cubic) functions of used in Ref. [Neuberger and Ziman, 1989; Sandvik, 1997] fail to fit the data. Instead, a simple (non-integer) power law function
| (9) |
works pretty well, where , , and are fitting parameters. We suspect that this is due to strong quantum fluctuations in the interaction parameter regime (from to ) near the quantum phase transition. The complex excitations would significantly change the finite size effect. The finite size scalings are shown in Fig. 2. The extrapolated values of the AF and VBS order parameters are plotted in Fig. 1. Both of them drop to zero as the interaction parameter approaches a small regime of from the opposite directions. We have also checked the evolutions of total and kinetic energies. Neither of them shows an obvious discontinuous behavior, which suggests continuous transitions.
Certainly, there exist a few possibilities regarding to the nature of these two ordering transitions: ) There is only a direct 2nd order phase transition as in the framework of the deconfined criticality, i.e., the two orderings share the same critical value of ; ) they exhibit two separate but very close 2nd order phase transitions with a quantum disordered phase in between; ) the same as in ) but with a small coexistence regime of both orders; ) a weak 1st order transition between them. To further address the nature of these transitions, we perform the following scaling analysis.
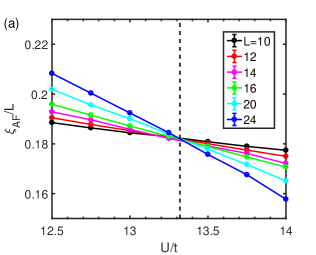
We first consider the scalings from the AF side. The following definition of the AF correlation length is employed based on spin-spin correlations Sandvik (2010b)
| (10) |
where is the ordering wavevector, and is a small deviation from chosen as . In Fig. 3(), we plot versus at different values of , and find that they cross at , which is taken as the transition point for the AF order.
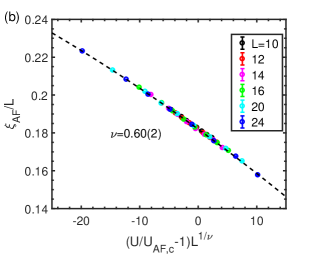
Based on the critical value of , we further perform the data collapse as plotted in Fig. 3() according to the scaling function of ,
| (11) |
where the exponent of the divergence of correlation length is determined to be . Such an exquisite scaling behavior is a strong hint to a continuous phase transition.
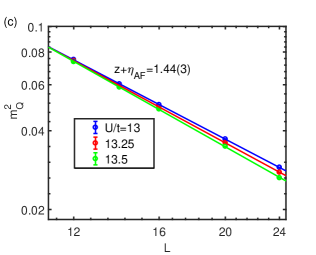
At a quantum critical point, the two-point correlation function in dimensions is expected to be algebraic decay as
| (12) | |||||
where is the dynamic critical exponent and is the anomalous dimension Sondhi et al. (1997). After the Fourier transformation, the structure factor at finite size scales as
| (13) |
at large enough values of . In Fig. 3 (), is plotted versus on a log-log coordinate around , which exhibits a good linear behavior up to . From their slopes, is found. In our simulations, is difficult to determine accurately since it requires the time evolutions of two particle Green’s functions which, however, tend to be gapless at the critical point. If we adopt the directly following the prediction of the deconfined critical theorySenthil (2004); *Senthil_PRB_2004; *Levin_PRB_2004, we arrive at the anomalous dimension .
Based on the above analysis, the AF transition exhibits quite clear evidence of a 2nd order phase transition. Here we summarize the critical value of and the two critical exponents for the AF transition as
| (14) |
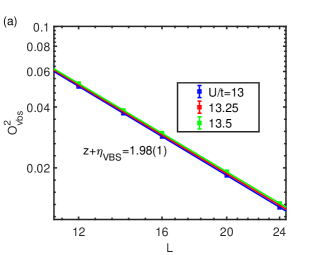
As for the correlations for the VBS orderings, unfortunately, it is difficult to obtain high quality data for the scaling of the VBS correlation length to determine the critical value of and compare it with . Nevertheless, since the VBS transition is very close to the AF one, we present the log-log plot of for in the vicinity of . The fitting of the slopes yields , which corresponds to
| (15) |
The above anomalous dimensions and are different from those obtained from the SU(6) - model Kaul and Sandvik (2012) indicating they indeed belong to different universality classes. Our case is based on the fermionic SU(6) Hubbard model, and in its Mott insulating state each site is in the self-conjugate representation, i.e., 3 fermions per site, while the - model is equivalent to the non-compact CP5 model in which neighboring states belong to the SU(6) fundamental and anti-fundamental representations.
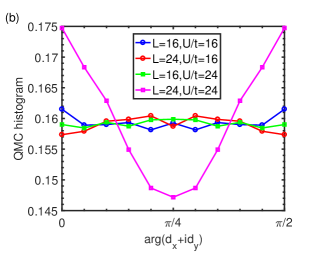
In order to identify the type of the VBS order, we plot the histograms of the VBS configurations during QMC simulations, as shown in Fig. 4(b). Deep inside the VBS state (for large and large ), the histogram shows larger weights at than , indicating that the VBS belongs to the columnar type. However, near the phase boundary, the histograms are difficult to tell which type of the VBS is, which in fact is consistent with an emergent symmetry in the framework of deconfined criticality. Sandvik (2007)
IV summary and discussion
In summary, we have performed a large scale projector QMC simulations on the half-filled SU(6) Hubbard model in the square lattice. As increases, we have found a crossover at from the Slater-AF to the Mott-AF insulators. As further increases, a (signature of) continuous phase transition at from the Mott-AF to Mott-VBS states.
Several remarks of these numerical observations are given as follows: (1)The finite size extrapolations in this work are based on the power law fitting in Eq. 9, which is different from most studies, especially the SU(2) Heisenberg model where the cubic-order polynomial works very well Neuberger and Ziman (1989); *Sandvik_PRB_1997. The difference may be rooted in the stronger quantum fluctuations from the higher symmetry group . A full understanding requires more sophisticated knowledge of the excitation properties of the SU(N) Hubbard which is left in future studies. (2) We have also tried to obtain the universal plots of and versus but failed. Of course, this may be caused by insufficient lattice sizes up to in our simulations. However, another possible reason may be the recently proposed two-length scaling hypothesis Shao et al. (2016), which requires very large lattice sizes difficult to reach for the determinant QMC simulations for fermions. (3) By symmetry analysis, the observed AF-VBS phase transition belongs to a broader universality class governed by a nonlinear sigma model beyond the CPN-1 model corresponding to . The full understanding, e.g. critical exponents, of the models calls for more elaborated theoretical efforts via e.g. expansionWang et al. (2019), or, renormalization group analysisDas (2018) in the future.
V acknowledgement
D. W. is supported by NSFC under grant No. 11874205. L. W. is supported by supported by the Ministry of Science and Technology of China under the Grant No. 2016YFA0302400 and the Strategic Priority Research Program of Chinese Academy of Sciences Grant No. XDB28000000. C. W. is supported by AFOSR FA9550-14-1-0168. The numerical calculations were performed on Tianhe-II platform at the National Supercomputer Center in Guangzhou.
References
- Slater (1951) J. C. Slater, Phys. Rev. 82, 538 (1951).
- Mott (1949) N. F. Mott, Proc. Phys. Soc. A 62, 416 (1949).
- Imada et al. (1998) M. Imada, A. Fujimori, and Y. Tokura, Rev. Mod. Phys. 70, 1039 (1998).
- Lee et al. (2006) P. A. Lee, X.-G. Wen, and N. Nagaosa, Rev. Mod. Phys. 78, 17 (2006).
- Hirsch (1985) J. E. Hirsch, Phys. Rev. B 31, 4403 (1985).
- Hirsch and Tang (1989) J. E. Hirsch and S. Tang, Phys. Rev. Lett. 62, 591 (1989).
- Pruschke and Zitzler (2003) T. Pruschke and R. Zitzler, J. Phys.: Condens. Matter 15, 7867 (2003).
- Wu et al. (2003) C. Wu, J.-P. Hu, and S.-C. Zhang, Phys. Rev. Lett. 91, 186402 (2003).
- Wu (2006) C. Wu, Mod. Phys. Lett. B 20, 1707 (2006).
- Honerkamp and Hofstetter (2004) C. Honerkamp and W. Hofstetter, Phys. Rev. Lett. 92, 170403 (2004).
- Wu (2012) C. Wu, Nature Phys. 8, 784 (2012).
- Wu (2005) C. Wu, Phys. Rev. Lett. 95, 266404 (2005).
- Hung et al. (2011) H.-H. Hung, Y. Wang, and C. Wu, Phys. Rev. B 84, 054406 (2011).
- Xu and Wu (2008) C. Xu and C. Wu, Phys. Rev. B 77, 134449 (2008).
- Wang et al. (2014) D. Wang, Y. Li, Z. Cai, Z. Zhou, Y. Wang, and C. Wu, Phys. Rev. Lett. 112, 156403 (2014).
- Chen et al. (2005) S. Chen, C. Wu, S.-C. Zhang, and Y. Wang, Phys. Rev. B 72, 214428 (2005).
- DeSalvo et al. (2010) B. J. DeSalvo, M. Yan, P. G. Mickelson, Y. N. Martinez de Escobar, and T. C. Killian, Phys. Rev. Lett. 105, 030402 (2010).
- Taie et al. (2010) S. Taie, Y. Takasu, S. Sugawa, R. Yamazaki, T. Tsujimoto, R. Murakami, and Y. Takahashi, Phys. Rev. Lett. 105, 190401 (2010).
- Krauser et al. (2012) J. S. Krauser, J. Heinze, N. Flaschner, S. Gotze, O. Jurgensen, D.-S. Luhmann, C. Becker, and K. Sengstock, Nature Phys. 8, 813 (2012).
- Taie et al. (2012) S. Taie, R. Yamazaki, S. Sugawa, and Y. Takahashi, Nature Phys. 8, 825 (2012).
- Zhang et al. (2014) X. Zhang, M. Bishof, S. L. Bromley, C. V. Kraus, M. S. Safronova, P. Zoller, A. M. Rey, and J. Ye, Science 345, 1467 (2014).
- Cazalilla and Rey (2014) M. A. Cazalilla and A. M. Rey, Rep. Prog. Phys. 77, 124401 (2014).
- Laflamme et al. (2016) C. Laflamme, W. Evans, M. Dalmonte, U. Gerber, H. Mejía-Díaz, W. Bietenholz, U. J. Wiese, and P. Zoller, Ann. Phys. 370, 117 (2016).
- Kim et al. (2019) F. H. Kim, F. F. Assaad, K. Penc, and F. Mila, arXiv (2019), arXiv:1906.06938 .
- Zhou et al. (2016) Z. Zhou, D. Wang, Z. Y. Meng, Y. Wang, and C. Wu, Phys. Rev. B 93, 245157 (2016).
- Zhou et al. (2018) Z. Zhou, C. Wu, and Y. Wang, Phys. Rev. B 97, 195122 (2018).
- Lang (2015) T. Lang, ETC* workshop of “Recent Advances in Monte Carlo Methods” (2015).
- Senthil (2004) T. Senthil, Science 303, 1490 (2004).
- Senthil et al. (2004) T. Senthil, L. Balents, S. Sachdev, A. Vishwanath, and M. P. A. Fisher, Phys. Rev. B 70, 144407 (2004).
- Levin and Senthil (2004) M. Levin and T. Senthil, Phys. Rev. B 70, 220403 (2004).
- Sandvik (2007) A. W. Sandvik, Phys. Rev. Lett. 98, 227202 (2007).
- Melko and Kaul (2008) R. G. Melko and R. K. Kaul, Phys. Rev. Lett. 100, 017203 (2008).
- Sandvik (2010a) A. W. Sandvik, Phys. Rev. Lett. 104, 177201 (2010a).
- Kaul and Sandvik (2012) R. K. Kaul and A. W. Sandvik, Phys. Rev. Lett. 108, 137201 (2012).
- Pujari et al. (2013) S. Pujari, K. Damle, and F. Alet, Phys. Rev. Lett. 111, 087203 (2013).
- Shao et al. (2016) H. Shao, W. Guo, and A. W. Sandvik, Science 352, 213 (2016).
- Nahum et al. (2015) A. Nahum, J. T. Chalker, P. Serna, M. Ortuño, and A. M. Somoza, Phys. Rev. X 5, 041048 (2015).
- Wang et al. (2016) L. Wang, Z.-C. Gu, F. Verstraete, and X.-G. Wen, Phys. Rev. B 94, 075143 (2016).
- Assaad and Grover (2016) F. F. Assaad and T. Grover, Phys. Rev. X 6, 041049 (2016).
- Kragset et al. (2006) S. Kragset, E. Smørgrav, J. Hove, F. S. Nogueira, and A. Sudbø, Phys. Rev. Lett. 97, 247201 (2006).
- Kuklov et al. (2006) A. B. Kuklov, N. V. Prokof’ev, B. V. Svistunov, and M. Troyer, Ann. Phys. 321, 1602 (2006).
- Kuklov et al. (2008) A. B. Kuklov, M. Matsumoto, N. V. Prokof’ev, B. V. Svistunov, and M. Troyer, Phys. Rev. Lett. 101, 050405 (2008).
- Sen and Sandvik (2010) A. Sen and A. W. Sandvik, Phys. Rev. B 82, 174428 (2010).
- Papanikolaou and Betouras (2010) S. Papanikolaou and J. J. Betouras, Phys. Rev. Lett. 104, 045701 (2010).
- Block et al. (2013) M. S. Block, R. G. Melko, and R. K. Kaul, Phys. Rev. Lett. 111, 137202 (2013).
- D’Emidio and Kaul (2016) J. D’Emidio and R. K. Kaul, Phys. Rev. B 93, 054406 (2016).
- D’Emidio and Kaul (2017) J. D’Emidio and R. K. Kaul, Phys. Rev. Lett. 118, 187202 (2017).
- MacFarlane (1979) A. J. MacFarlane, Phys. Lett. B 82, 239 (1979).
- Duerksen (1981) G. Duerksen, Phys. Rev. D 24, 926 (1981).
- Read and Sachdev (1989a) N. Read and S. Sachdev, Phys. Rev. Lett. 62, 1694 (1989a).
- Read and Sachdev (1989b) N. Read and S. Sachdev, Nucl. Phys. B 316, 609 (1989b).
- Read and Sachdev (1990) N. Read and S. Sachdev, Phys. Rev. B 42, 4568 (1990).
- Cai et al. (2013a) Z. Cai, H.-H. Hung, L. Wang, D. Zheng, and C. Wu, Phys. Rev. Lett. 110, 220401 (2013a).
- Assaad and Evertz (2008) F. F. Assaad and H. G. Evertz, in Computational Many-Particle Physics (Springer, 2008) pp. 277–356.
- Cai et al. (2013b) Z. Cai, H.-H. Hung, L. Wang, and C. Wu, Phys. Rev. B 88, 125108 (2013b).
- Marston and Affleck (1989) J. B. Marston and I. Affleck, Phys. Rev. B 39, 11538 (1989).
- Neuberger and Ziman (1989) H. Neuberger and T. Ziman, Phys. Rev. B 39, 2608 (1989).
- Sandvik (1997) A. W. Sandvik, Phys. Rev. B 56, 11678 (1997).
- Sandvik (2010b) A. W. Sandvik, AIP Conference Proceedings 1297, 135 (2010b).
- Sondhi et al. (1997) S. L. Sondhi, S. M. Girvin, J. P. Carini, and D. Shahar, Rev. Mod. Phys. 69, 315 (1997).
- Wang et al. (2019) S.-Y. Wang, D. Wang, and Q.-H. Wang, Phys. Rev. B 99, 165142 (2019).
- Das (2018) A. Das, Phys. Rev. B 97, 214429 (2018).