Impacts of radiative corrections on measurements
of lepton flavour universality in decays
Abstract
Radiative corrections to decays can have an impact on predictions and measurements of the lepton universality ratios and . These proceedings summarise a study on the comparison between recent calculations of soft-photon corrections on these ratios and the corrections simulated by the Photos package. Also the impact of Coulomb interactions, not simulated in Photos, is discussed. Using pseudo-experiments, the effect of high-energy photon emission is studied in an LHCb-like environment, showing a bias of up to 7% on measurements of .
I Introduction
In the Standard Model (SM) it is assumed that the only difference between the three generations of leptons is their mass, and that their gauge couplings are the same. This assumption, called lepton universality (LU), can be tested by measuring the ratio of decay rates, which ensures that many experimental and theoretical uncertainties are cancelled in the ratio. One type of these LU measurements is performed using semileptonic decays of the form , commonly known as measurements of . This is defined as
| (1) |
where and are a and hadron, respectively, and is either an electron or muon.
Measurements of have been performed by the LHCb, Belle and BaBar experiments. For , the average of the measured value of is Lees et al. (2012); Huschle et al. (2015); Abdesselam et al. (2019). The predicted value for , assuming isospin symmetry, is Bigi and Gambino (2016); Bernlochner et al. (2017); Jaiswal et al. (2017); Aoki et al. (2019). Even though differs from the SM prediction by only 1.4, the deviation from the SM of the combined and is about 3.1 Amhis et al. (2017).
Radiative corrections were long thought to be negligible at the level of precision of measurements and predictions of . Recently, however, de Boer et al. de Boer et al. (2018) presented a new evaluation of the long-distance electromagnetic (QED) contributions to and decays, where . These corrections are different for and decays, such that they do not cancel in . A proper evaluation of the radiative corrections can alter SM predictions and increase their uncertainty.
In measurements of , radiative corrections are simulated using the Photos package Golonka and Was (2006); Golonka (2006). These proceedings, which are a summary of the studies described in Ref. Calí et al. (2019), show the difference between the QED corrections simulated in Photos and those predicted by Ref. de Boer et al. (2018). They describe a study on the effects of under- or overestimating these corrections in simulation on measurements of .
II Radiative corrections in PHOTOS
Photos Golonka and Was (2006); Golonka (2006) is a universal MC algorithm that simulates effects of QED corrections. The corrections simulated by Photos have successfully been tested for , , and decays and should be tested for every type of measurements individually, especially when high precision is needed. Unlike Ref. de Boer et al. (2018), Photos does not include Coulomb corrections. These corrections concern the enhancement of decay rates due to the interaction of two charged particles and are therefore relevant for the decay, but not for the decay.
Recent versions of Photos include multi-photon emissions as well as interference between final-state photons, whereas Ref. de Boer et al. (2018) also includes the interference between initial- and final state photons. The calculation by de Boer et al. in Ref. de Boer et al. (2018) is valid in the regime in which the maximum energy of the radiated photons is smaller than the lepton mass, the muon mass in this case. Photos also includes photon emission with higher energies. Neither Ref. de Boer et al. (2018) nor Photos include the emission of photons depending on the hadronic structure. These so called structure-dependent photons impact the spin of the decay particle and may also interfere with bremsstrahlung photons.
To study the differences between Ref. de Boer et al. (2018) and Photos, four samples ( and ,
where ) with three million meson decays are generated by Pythia 8 Sjöstrand et al. (2006, 2008).
The mesons decays are simulated by EvtGen Lange (2001), including the QED corrections by Photos v.3.56, with the “option with interference” switched on.
For both the and decays considered, the HQET2 model is used with parameters from Ref. Amhis et al. (2017).
The four-momentum of the total radiated photons, , is defined as
| (2) |
where , , , and are the four-momenta of the , , and , respectively. In agreement with Ref. de Boer et al. (2018), the radiation of the decay products is not taken into account. The total energy of the radiated photons, , is computed in the rest frame.
The variable is defined as the maximum value that is allowed to have to consider signal rather than background. The QED correction, , is given by the relative variation of the branching ratio when events with total radiated energy greater than are discarded, calculated as
| (3) |
Here, is the distribution of events with . The considered energy range is up to 100 MeV, covering the majority of radiative photons generated by Photos.
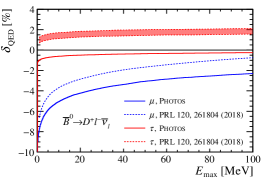
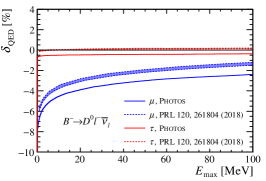
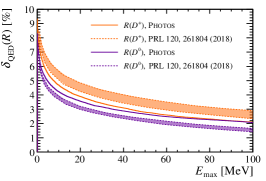
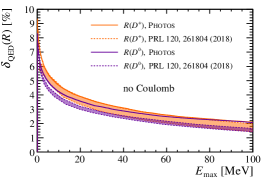
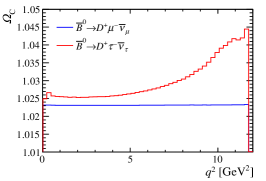
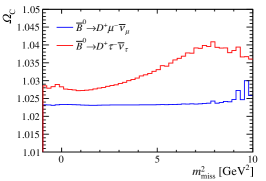
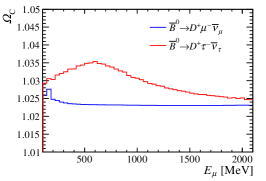
Figure 1 shows comparisons between radiative corrections from Photos and Ref. de Boer et al. (2018) to the (left) and (middle) branching ratios. These plots show differences of up to 2% for the decays, and for decays. This effect does not cancel even in the ratios of branching fractions. This is clearly visible in Fig. 1 (right), where radiative corrections on , , are shown as a function of . Photos predicts a QED correction of 0.5% lower than Ref. de Boer et al. (2018) in , and 0.5% higher in .
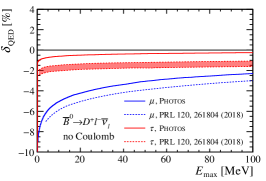
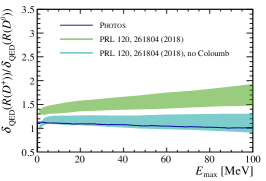
A significant part of the radiative corrections in Ref. de Boer et al. (2018) originates from Coulomb interactions, which are not included in Photos. Light leptons typically have a Coulomb correction of 1.023 Atwood and Marciano (1990), whereas the leptons in the decay have Coulomb corrections between 2.5% and 5.0%. The QED corrections from Photos for the decay mode are compared with predictions not including the Coulomb correction as provided by Ref. de Boer et al. (2018). This reduces the difference of the corrections to the branching ratios between Photos and the theoretical calculations to about 1% and brings the corrections on in close agreement, as is shown in Fig. 2.
III Effects on LHCb-like analysis
The comparison between Ref. de Boer et al. (2018) and Photos can be made only for soft photons with energies up to 100 MeV. For higher energies, no calculations are available. However, Photos generates also photons with higher energies in ranges where structure-dependent photons are relevant. These are used to study the effects of under- or overestimating radiative corrections in simulation for a measurement of in an LHCb-like environment.
A study is performed with the same data sets as described in the previous section by making a template fit to the and components. This fit uses the same fit variables as LHCb’s muonic analysis Aaij et al. (2015). These are the muon energy computed in the meson rest frame, ; the missing mass squared, ; and the squared four-momentum transferred to the lepton system, . Simulated data samples are created from a mixture of and decays, with radiative corrections generated by Photos. Here is assumed to be 0.3 as predicted by the SM. No backgrounds are considered.
The fits are performed with templates that are created under the hypothesis that there is no radiation above . Five values of , 100, 300, 500, 800 and 1500 MeV, are chosen for this study. Fitting the templates to the simulated data sample with no cuts on radiation yields an estimate of the possible bias on . This indicates the importance of simulating in the high-energy region. Note that LHCb analyses do not cut on radiative energy explicitly, but that implicitly applied cuts could alter this bias.
The acceptance of the LHCb detector is mimicked by applying selection requirements following Ref. Ciezarek et al. (2017). The production and decay vertices are smeared to simulate the detector resolution and a cut on the flight distance is applied to resemble the trigger selection. At LHCb, the meson momentum cannot be reconstructed due to the missing neutrino. Therefore, as in Ref. Aaij et al. (2015), the momentum of the in the direction, , is approximated as , where is the mass, and and are the mass and momentum in the beam direction of the visible decay products of the meson, respectively.
The simulated sample size is based on an estimate of the yields for the Run II data-taking period using the reconstruction efficiencies from Ref. Aaij et al. (2015), the production cross-section at 13 TeV, and branching fractions. This results in yields of data samples of and for the decays, and and for the decays, where the first yield represents the sample, and the second the sample.
The values of are determined from the fitted yields as well as the reconstruction efficiencies and for the and samples using
| (4) |
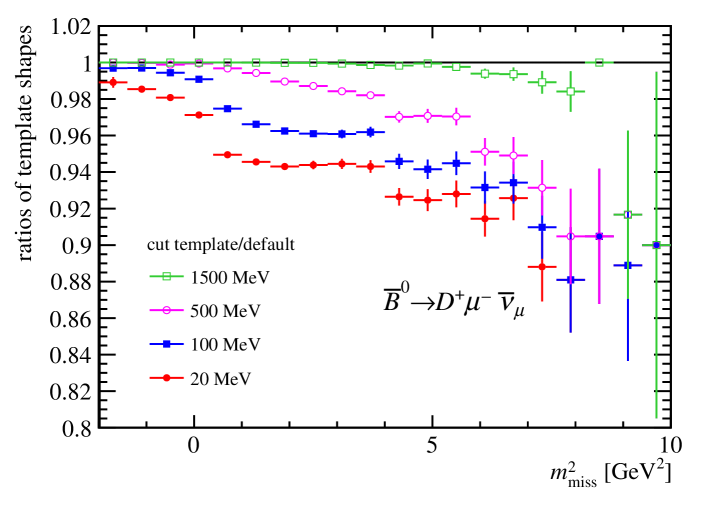
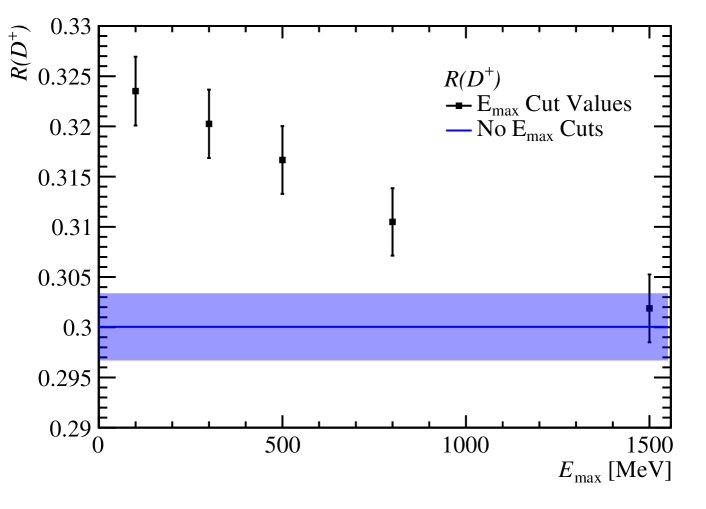
It is found that for this specific case study, the ratio of efficiencies is not affected by the cuts on . Combining the efficiencies with the fitted yields, the resulting values of as a function of the cut on are shown in Fig. 4, which shows a dependence on . From here it is clear that there is a significant effect in underestimating the QED radiative corrections which could be up to 0.02 for both and values, corresponding to a relative bias of 7.5%. This is due to the change in template shapes when applying cuts on which is most clearly visible in the distribution of the semimuonic decay, shown in Fig. 3. Since the template shapes of the semitauonic decays do not change significantly, this effect does not cancel in the ratio .
The results for analysis look very similar to those for and are therefore omitted from these proceedings. In actual analyses, radiative corrections are present in data, and, at least partially, in simulation. Therefore this analysis is likely to be an overestimate on the bias.
Also the Coulomb correction impacts the shape of the fit templates and thus the experimental results of . This bias is evaluated by weighting each event in the decay by the Coulomb correction . Changes in the , and distributions are shown in Fig. 5. is mostly constant for the mode, but for the mode, a dependence on each of the three variables is shown. The above analysis is repeated while applying Coulomb corrections to the simulated data sample and not on the fit templates, resulting in a relative shift on of about -1.0%. No additional cuts on are applied.
IV Conclusions and recommendations
The QED corrections described in Ref. de Boer et al. (2018) are not fully included in the Photos package which is used to simulate these corrections in analyses of the LHCb, Belle, and BaBar experiments. These different QED corrections affect the muonic and tauonic branching ratios at the level of a few percent. While calculating the ratios , the differences largely cancel out when Coulomb corrections are ignored. Coulomb corrections are not present in Photos and this results in a discrepancy between Ref. de Boer et al. (2018) and Photos of up to 1 % on the ratio .
Coulomb interactions mainly affect the kinematics of tauonic decays, changing the shape of the distributions used to determine their signal yields in an LHCb-like analysis. Not including these in simulated data can result in a bias of around 1% on measurements of . Over- or underestimating radiative corrections can bias LHCb-like measurements up to 7%, resulting in a bias of 0.02 on .
These studies must be repeated for each analysis individually because they are dependent on selection requirements as well as fit variables. For Belle II measurements, which have a better resolution on the kinematic variables Altmannshofer et al. (2018) than LHCb, the effects could even be larger. Additional calculations of QED corrections on for decays, specifically those involving high-energy and structure-dependent photons, are necessary in order to make measurements with higher precision.
Acknowledgements.
These proceedings are a summary of the work presented in Ref. Calí et al. (2019) and I am very grateful to my fellow authors Stefano Calí, Marcello Rotondo and Barbara Sciascia for the pleasant collaboration.References
- Lees et al. (2012) J. P. Lees et al. (BaBar), Phys. Rev. Lett. 109, 101802 (2012), eprint 1205.5442.
- Huschle et al. (2015) M. Huschle et al. (Belle), Phys. Rev. D92, 072014 (2015), eprint 1507.03233.
- Abdesselam et al. (2019) A. Abdesselam et al. (Belle) (2019), eprint 1904.08794.
- Bigi and Gambino (2016) D. Bigi and P. Gambino, Phys. Rev. D94, 094008 (2016), eprint 1606.08030.
- Bernlochner et al. (2017) F. U. Bernlochner, Z. Ligeti, M. Papucci, and D. J. Robinson, Phys. Rev. D95, 115008 (2017), eprint 1703.05330.
- Jaiswal et al. (2017) S. Jaiswal, S. Nandi, and S. K. Patra, JHEP 12, 060 (2017), eprint 1707.09977.
- Aoki et al. (2019) S. Aoki et al. (Flavour Lattice Averaging Group) (2019), eprint 1902.08191.
- Amhis et al. (2017) Y. Amhis et al. (Heavy Flavor Averaging Group), Eur. Phys. J. C77, 895 (2017), updated results and plots available at https://hflav.web.cern.ch, eprint 1612.07233.
- de Boer et al. (2018) S. de Boer, T. Kitahara, and I. Nisandzic, Phys. Rev. Lett. 120, 261804 (2018), eprint 1803.05881.
- Golonka and Was (2006) P. Golonka and Z. Was, Eur. Phys. J. C45, 97 (2006), eprint hep-ph/0506026.
- Golonka (2006) P. Golonka, Ph.D. thesis, Cracow, INP (2006), CERN-THESIS-2006-098.
- Calí et al. (2019) S. Calí, S. Klaver, M. Rotondo, and B. Sciascia (2019), eprint 1905.02702.
- Sjöstrand et al. (2006) T. Sjöstrand, S. Mrenna, and P. Skands, JHEP 05, 026 (2006), eprint hep-ph/0603175.
- Sjöstrand et al. (2008) T. Sjöstrand, S. Mrenna, and P. Skands, Comput. Phys. Commun. 178, 852 (2008), eprint 0710.3820.
- Lange (2001) D. J. Lange, Nucl. Instrum. Meth. A462, 152 (2001).
- Atwood and Marciano (1990) D. Atwood and W. J. Marciano, Phys. Rev. D41, 1736 (1990).
- Aaij et al. (2015) R. Aaij et al. (LHCb), Phys. Rev. Lett. 115, 111803 (2015), [Erratum: Phys. Rev. Lett.115,no.15,159901(2015)], eprint 1506.08614.
- Ciezarek et al. (2017) G. Ciezarek, A. Lupato, M. Rotondo, and M. Vesterinen, JHEP 02, 021 (2017), eprint 1611.08522.
- Altmannshofer et al. (2018) W. Altmannshofer et al. (Belle-II) (2018), eprint 1808.10567.