Thermally driven wind as the origin of warm absorbers in AGN
Abstract
Warm absorbers are present in many Active Galactic Nuclei (AGN), seen as mildly ionised gas outflowing with velocities of a few hundred to a few thousand kilometres per second. These slow velocities imply a large launch radius, pointing to the broad line region and/or torus as the origin of this material. Thermal driving was originally suggested as a plausible mechanism for launching this material but recent work has focused instead on magnetic winds, unifying these slow, mildly ionised winds with the more highly ionised ultra-fast outflows. Here we use the recently developed quantitative models for thermal winds in black hole binary systems to predict the column density, velocity and ionisation state from AGN. Thermal winds are sensitive to the spectral energy distribution (SED), so we use realistic models for SEDs which change as a function of mass and mass accretion rate, becoming X-ray weaker (and hence more disc dominated) at higher Eddington ratio. These models allow us to predict the launch radius, velocity, column density and ionisation state of thermal winds as well as the mass loss rate and energetics. While these match well to some of the observed properties of warm absorbers, the data point to the presence of additional wind material, most likely from dust driving.
keywords:
galaxies: nuclei – X-rays: galaxies – X-rays: ISM – quasars: general1 Introduction
X-ray observations of active galactic nuclei (AGNs) often reveal the presence of mildly ionised material, with multiple absorption lines from partially ionised oxygen, neon, and iron in the 0.5–2 keV bandpass. These lines are blueshifted, indicating outflow velocities of a few hundred to a few thousand km s-1. These ‘warm absorbers’ are best studied with high resolution X-ray data from gratings, the Reflection Grating Spectrometer (RGS) on board XMM-Newton (e.g. Sako et al. 2001 and the compilations of Laha et al. 2014) and the High/Low Energy Transmission Grating (HETG/LETG) on Chandra (e.g. Kaspi et al. 2000; Kaastra et al. 2000 and the compilation of McKernan et al. 2007). The inferred mass outflow rate is often comparable to or even larger than the mass accretion rate onto the supermassive black hole, so this must impact on the available material for accretion (Blustin et al., 2005; Laha et al., 2014). However, its kinetic energy is rather small, generally less than 1% of bolometric luminosity (Blustin et al., 2005; Laha et al., 2014). Thus the warm absorbers are probably not important in setting - relation as these typically require a wind with kinetic power of 0.5–5% of the bolometric luminosity (Hopkins & Elvis, 2010).
There are three main models for producing the warm absorber outflows: radiation pressure, magnetic force, and thermal pressure. The radiation force overcomes gravity when , where is the Eddington limit, which is defined from Thompson scattering on free electrons. Most AGNs with warm absorbers are sub-Eddington, so continuum radiation pressure cannot be the main mechanism. However, there can be other processes which enhance the coupling of the gas to the radiation field. An additional cross-section, , leads to a decrease in the luminosity at which a wind can be driven, to where is the force multiplier. The force multiplier can be very large for low ionisation gas due to the enormous numbers of ultraviolet (UV) line (bound-bound) as well as edge (bound-free) transitions, allowing radiation pressure to drive strong winds in sub-Eddington AGNs (e.g. Proga & Kallman 2004). However, this is most efficient where there is strong UV radiation, which is the inner disc in most bright AGN. Typically, winds have terminal velocity which is of order the escape velocity from their launch point so these winds are much faster than those observed in warm absorbers (Blustin et al., 2005).
Winds can also be driven by centrifugal acceleration along magnetic field lines anchored in the disc (Blandford & Payne, 1982; Konigl & Kartje, 1994; Fukumura et al., 2010). However, these winds depend on the (currently unknown) magnetic field configuration, so are impossible to calculate ab initio.
The third wind launch mechanism is thermal driving (Begelman et al., 1983; Woods et al., 1996), which was first applied to the warm absorbers by Krolik & Kriss (1995) based on numerical studies by Balsara & Krolik (1993). X-rays from the AGN heats any illuminated material up to the Compton temperature, . This is determined only by the spectrum of the radiation, as photons with will Compton cool the material, whereas photons with heat it. The heated skin expands due to the pressure gradient, producing a thermally driven wind at radii where the sound speed exceeds the local escape velocity.
In this paper we focus on the thermally driven wind model as these can be rather well predicted given the spectral energy distribution (SED) and luminosity of the source. We use the approach of Done et al. (2018), who recast the analytic thermal wind solutions of Begelman et al. (1983) into a more tractable form, and used them to show that this is most likely the origin of the narrow, highly ionised, blueshifted absorption seen in black hole binaries (see also Higginbottom et al. 2018; Tomaru et al. 2019). Here we apply this instead to AGN, predicting the thermal wind using the SED models of Kubota & Done (2018) to track how the Compton temperature varies with mass and . We compare these predictions with the data to assess the viability of a thermally driven wind model for the origin of warm absorbers in AGN.
2 Thermal winds in AGN
Irradiation by X-rays from the inner region heats material to the Compton temperature, defined by
| (1) |
where is luminosity. depends on only the shape of SED; harder spectra produce higher . The heated material expands with the sound velocity of , where is the mean particle mass of ions and electrons for solar abundances. The Compton radius () is where this local sound speed exceeds the escape velocity, i.e., , where and is the gravitational radius.
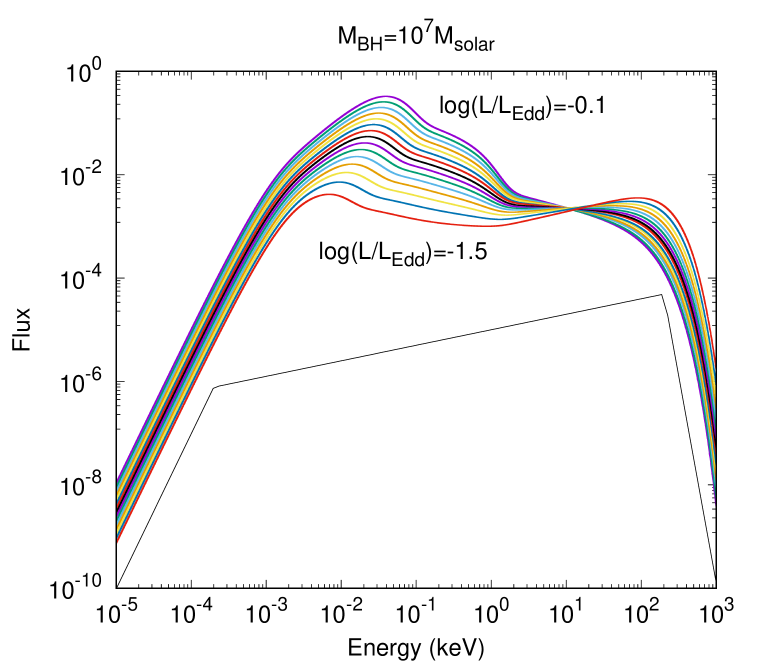
The spectral shape is critical to the thermal wind properties. Multiple papers have shown that the AGN SED changes systematically as a function of mass and mass accretion rate (Vasudevan & Fabian, 2007, 2009; Jin et al., 2012; Done et al., 2012). We use the specific model qsosed of Kubota & Done (2018) to model them. This captures the main trends seen in the data by assuming that the accretion flow forms three different regions, an outer standard disc where the emission thermalises to the local blackbody temperature, an intermediate region where the accretion power is dissipated higher up in the photosphere, producing a ‘soft X-ray excess’ warm Comptonisation region, and an inner hot flow which is assumed to have constant hard X-ray luminosity, . At low luminosity, almost all of the accretion power is taken by the hot flow, whereas for , this forms only a very small fraction of the bolometric luminosity, as required (see Kubota & Done 2018 for details). Fig. 1 shows examples of the assumed SED for a black hole of mass and zero spin for to . For the spectrum is assumed to be purely a power law with photon spectral index of , i.e., that the entire disc is replaced by an advection dominated accretion flow (ADAF).
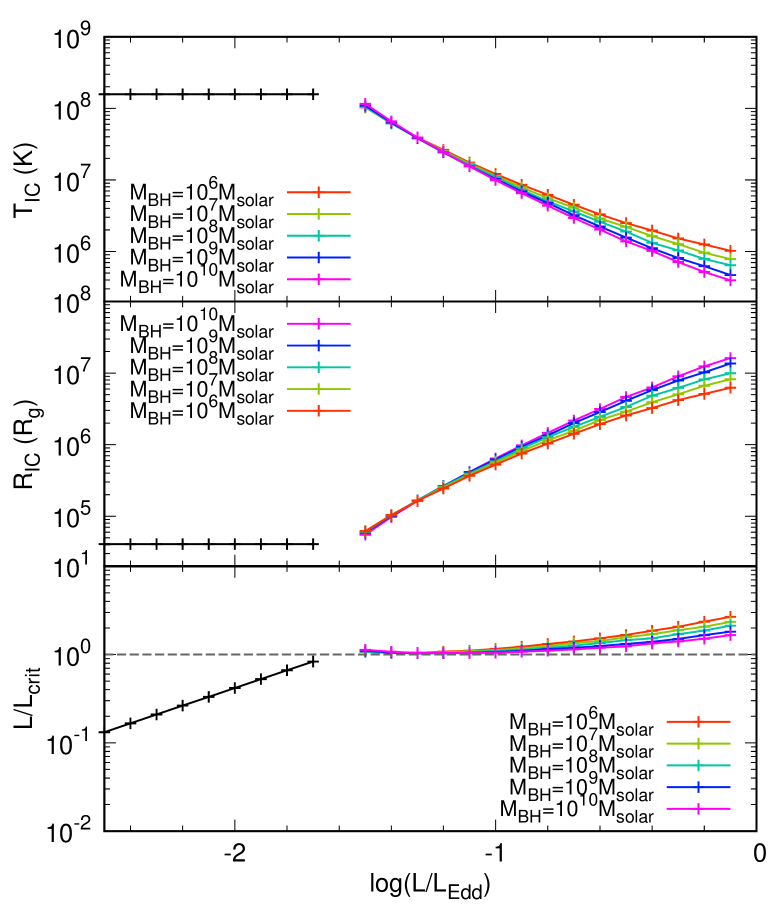
Fig. 2 shows the resulting Compton temperature, , and corresponding Compton radius, , at which material at this temperature is able to escape the black hole gravity. The softer SED at higher gives a lower Compton temperature, so the radius at which the heated material can escape is larger. We show these predictions for a range of black hole masses, from (red) to (magenta), but this makes little difference as the Compton temperature is much more sensitive to higher energy photons (essentially it is a spectral average of rather than ). Thus the expected decrease in due to the lower disc temperature at higher mass only becomes noticeable at the highest , where the disk component almost completely dominates the spectrum.
The luminosity is of secondary importance to the spectral shape as long as it is high enough to heat the gas up to the Compton temperature before it escapes. However, if the luminosity is lower than this critical luminosity, , then the gas is heated only to a characteristic temperature (). The critical luminosity and the characteristic temperature are written as
| (2) |
and
| (3) |
(Begelman et al., 1983; Done et al., 2018). The lower panel of Fig. 2 shows for each of the SEDs. The luminosity is around or above the critical luminosity for , predicting that all AGN with some UV emitting outer disc have in our models, so can efficiently produce thermal winds.
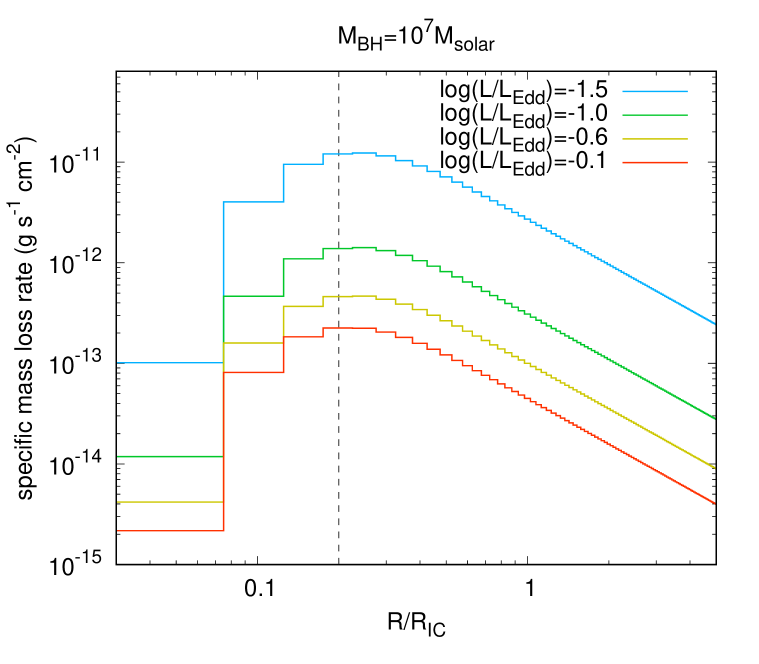
Woods et al. (1996) provided an equation for the specific mass loss rate (per unit area) at radius from hydrodynamic simulations as
| (4) |
Here the characteristic sound speed is , , and the pressure ionisation parameter marking the base of the X-ray heated atmosphere, , is assumed constant at (Done et al., 2018). This equation matches well with the analytic expectations (Begelman et al., 1983; Done et al., 2018) and more recent hydrodynamic results (Higginbottom et al., 2018). Fig. 3 shows the results of equation (4), which are calculated with a step of . These peak at as long as the heating is rapid (), as is the case here for all AGN with . Hence we consider this to be the launch radius for thermal winds. Done et al. (2018) showed that in the more general case the wind launch radius is for and for .
3 Illuminated material
Thermal winds are produced where the AGN spectrum illuminates cool material, with typical launch radii of for most of the SEDs considered (Fig. 2). In black hole binaries it is common for the outer accretion disc to extend to these radii, but in AGN self gravity should truncate the disc at a radius (Laor & Netzer, 1989) of
| (5) |
where , , and is the disc viscosity parameter of Shakura & Sunyaev (1973), assumed here as (Starling et al., 2004). Thus thermal winds cannot be produced from AGN discs.
Nonetheless, there is gas at larger radii, in the self gravitating regime, from either the broad line region (BLR) and/or molecular torus (Krolik & Kriss, 2001). Both of these are radially extended structures, so we consider that there is a continuous distribution of gas connecting the accretion disc to the molecular torus. Nonetheless, there are characteristic radii which can be identified within this. Reverberation mapping shows that this gas produces the broad H line at
| (6) |
(Bentz et al., 2013), where is taken at 5100Å from the AGN SED model (Fig. 1).
The inner radius of the dust torus () is determined by the dust sublimation temperature, K (Barvainis, 1987). Dust evaporates when the irradiation flux reaches , where is the Stefan-Boltzmann constant. Therefore,
| (7) |
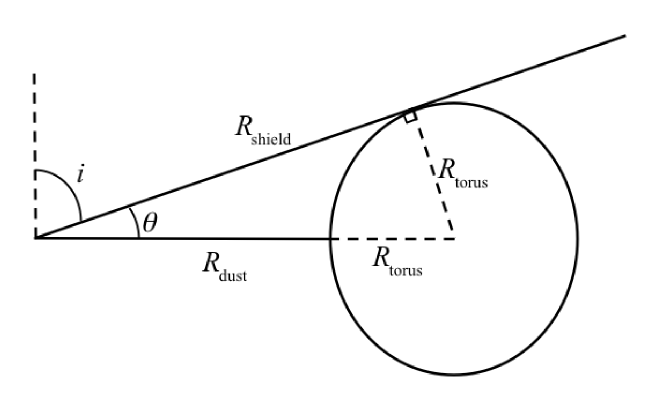
There should also be an outer radius for illumination of the torus, depending on the geometry. When we simply assume a circular cross-section torus, it has a self-shielding radius (, see Fig. 4), as , where is the half opening angle subtended by the torus from the central black hole. We set to match the hydrodynamic simulation of Dorodnitsyn et al. (2008a), which assume that the torus obstructs all lines of light of AGN with inclinations of . Therefore . The dust torus may not have a simple toroidal shape, but be conical/flared made by a dusty wind (e.g. Elitzur & Shlosman 2006; Dorodnitsyn et al. 2012; Chan & Krolik 2016). In this case the dusty gas in the torus can supply more gas to the wind, which will be discussed in section 7.
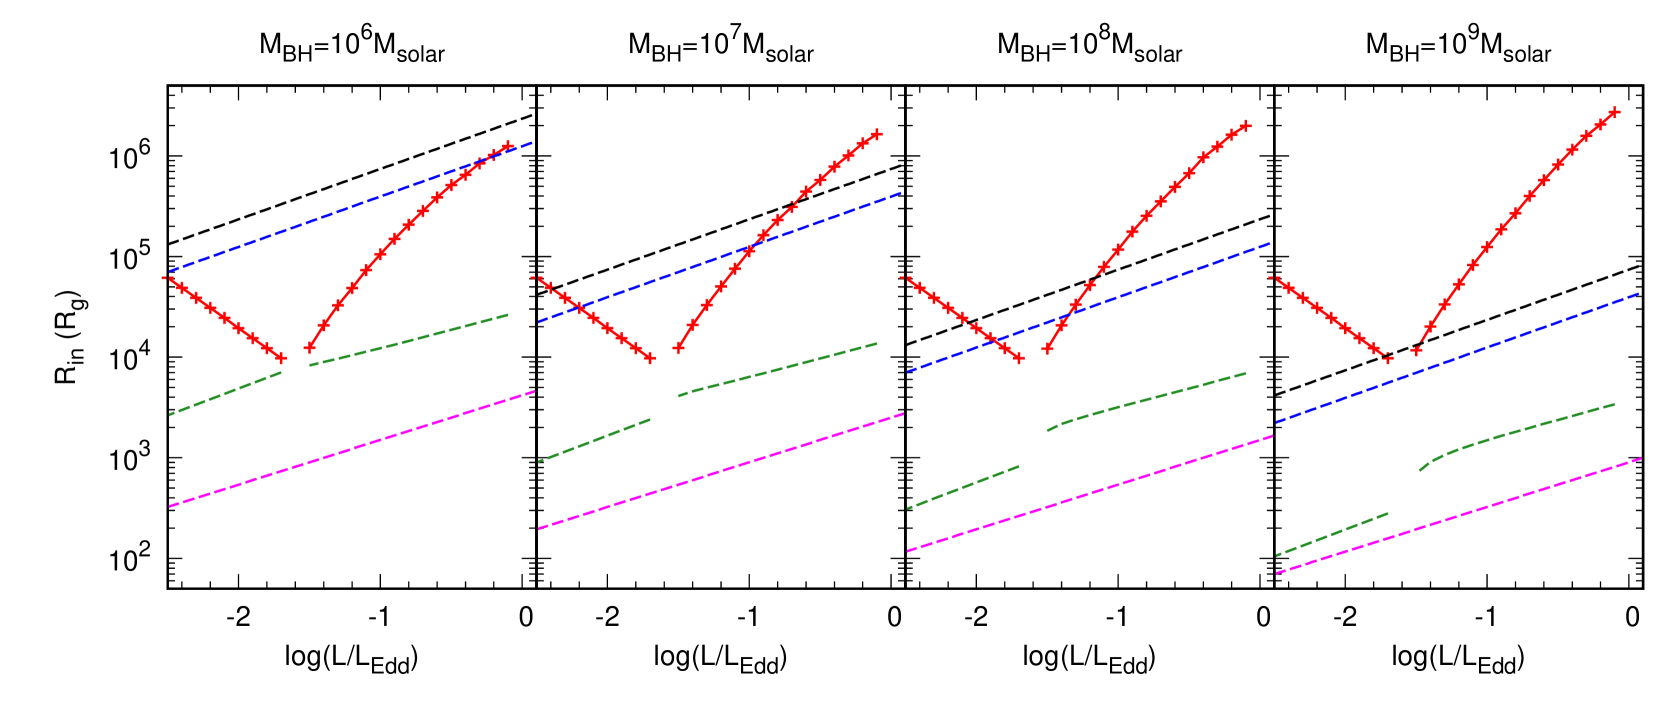
The BLR and inner and outer torus radii all scale as . Hence so the typical radii of these gas structures increases with but decreases with increasing black hole mass. Fig. 5 shows how the H broad line radius (green) and inner/outer (blue/black) radius of the dusty torus all decrease systematically in terms of for increasing black hole masses of and , while the predicted thermal wind launch radius (red crosses) is approximately constant in . Thus while the lowest mass AGN can launch a thermal wind from radii close to the H emitting part of the BLR, the highest mass AGN cannot launch a thermal wind at all as the torus self shields before the material can escape in a wind with our assumed geometry. The range in wind producing radii is largest when , and at lowest black hole masses, so highlighting these system parameters as the ones where the thermal wind mass loss rates should be largest.
4 Wind mass, momentum and energy loss rates
The total mass loss rate in the wind is the integration of the specific mass loss rate up to , i.e.,
| (8) |
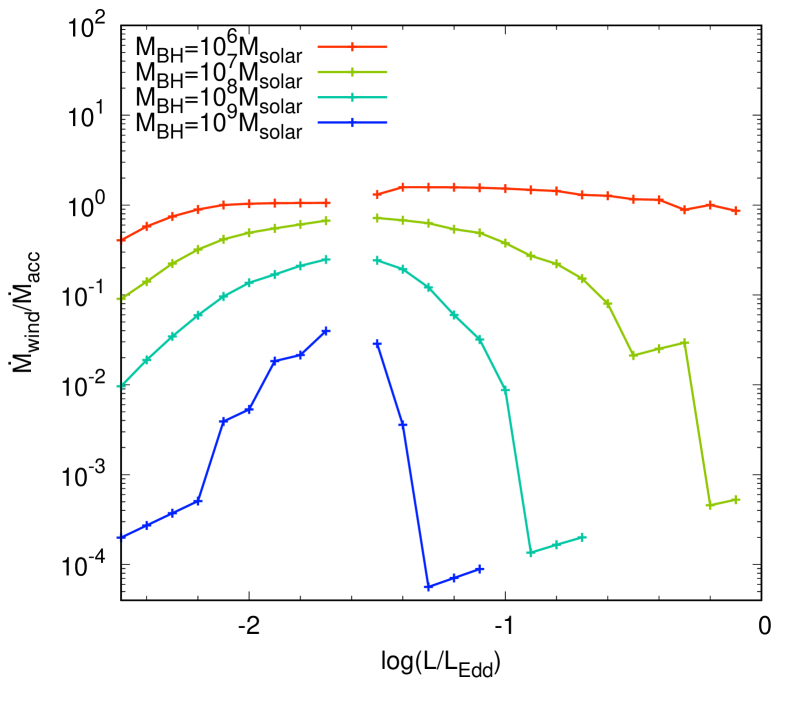
Fig. 6 shows the ratio of the total mass loss rate to the mass accretion rate (, where for a non-spinning black hole). The mass-loss is indeed larger when the black hole mass is smaller and the Eddington ratio is closer to as expected from the discussion above. It exceeds the mass accretion rate for the most efficient case.
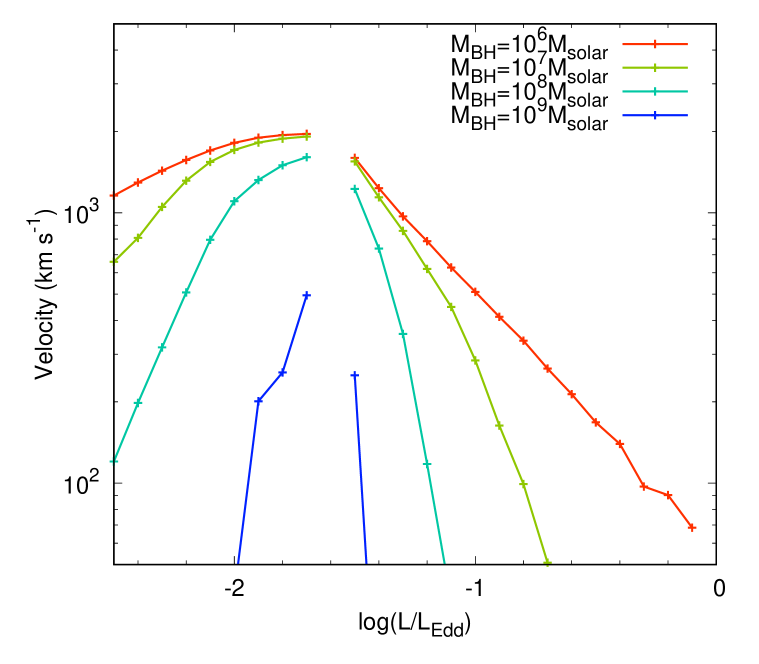
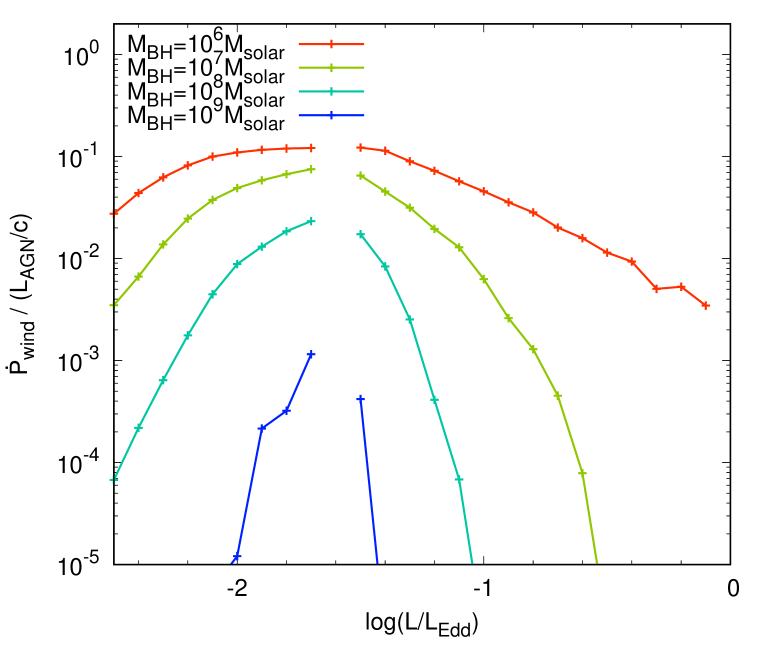
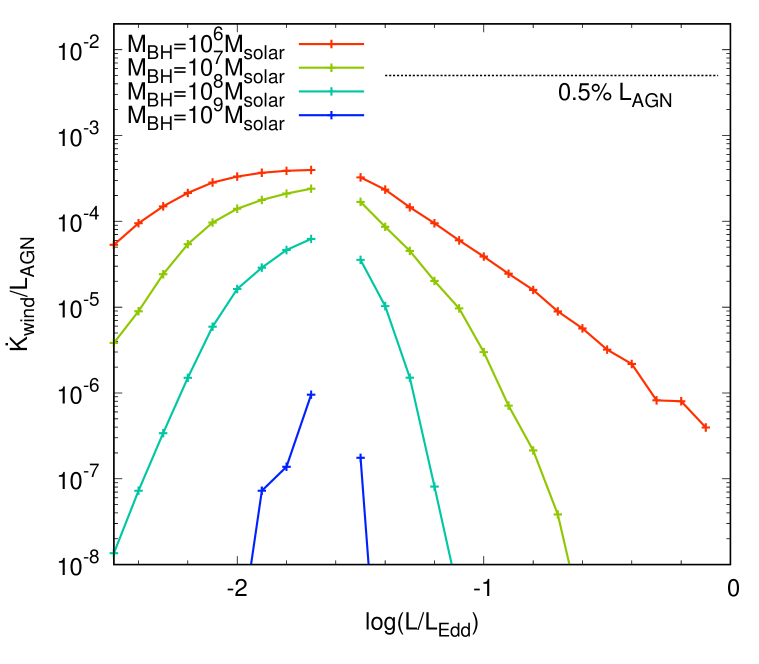
We calculate the expected wind velocity following Done et al. (2018) as the mass loss weighted average sound speed (). The wind velocity becomes slower for larger Eddington ratios (Fig. 7), which due to their lower (Fig. 2). This enables us to calculate the momentum and kinetic energy carried by the wind, as shown in Figs. 8 and 9. Because the wind velocity is much slower than the light velocity ( km s), the momenta are much less than and the energy loss rates do not exceed of the AGN luminosity. Thermal winds make only a small contribution to the AGN feedback and evolution of the host galaxy. This is consistent with results of full radiation hydrodynamic models of X-ray heated thermal winds from the torus (Dorodnitsyn et al., 2008a, b).
5 Observational characteristics of thermal winds in AGN
While the thermal wind does not carry enough energy to determine AGN feedback, it may still produce the observed warm absorber features. Done et al. (2018) show that the column density and ionisation along the line of sight could be analytically estimated for the black hole binary case, (i.e., when the wind is launched from the disc and there are no obstacles such as torus in the line of sight). They could match to the results of radiative hydrodynamic models (Woods et al., 1996) by assuming radial streamlines and , where is the number density for an edge-on inclination and . However, in the AGN case, the geometry is more complex, with the BLR clouds and torus having some scale height so the wind does not extend down to edge-on inclination angles. Our torus geometry has opening angle of , so we assume that the same amount of thermal wind gas exists within , i.e.,
| (9) |
where . This gives a flat disc to funnel correction coefficient of . The column density of the wind is then
| (10) |
where is the mean ion mass per electron.
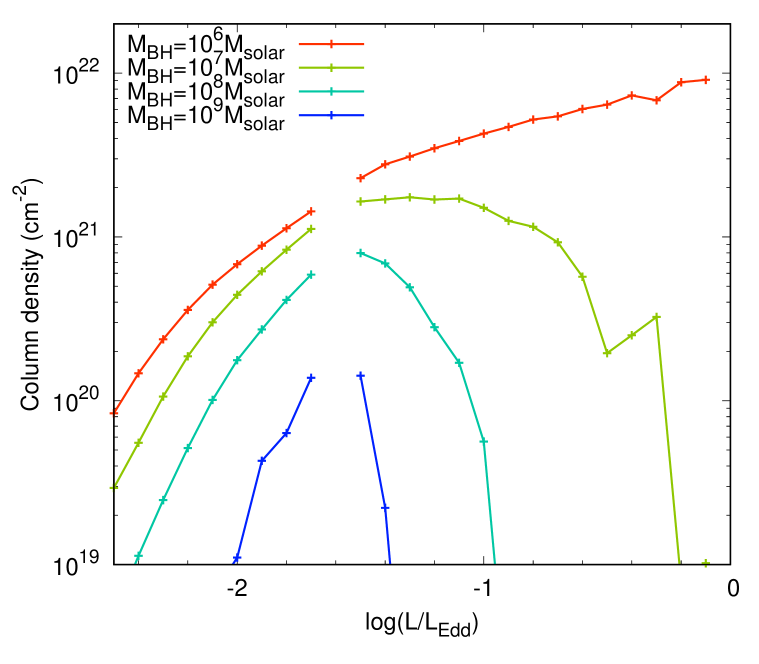
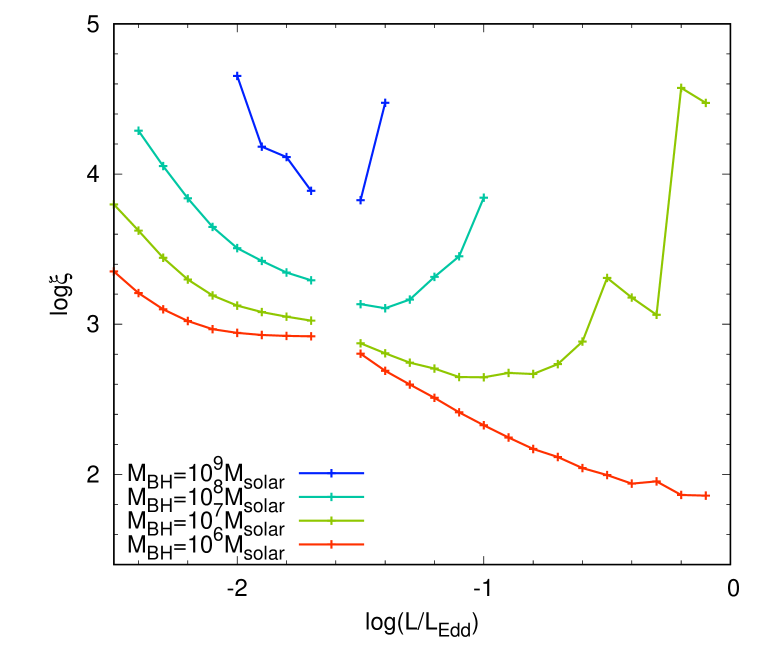
Fig. 10 shows the column density predicted for for a range of mass and mass accretion rates. We also calculate the ionisation parameter as , where is the luminosity from 13.6 eV to 13.6 keV. Our radial streamlines mean that this is constant with radius, with the value shown Fig. 11. These predictions result in typical columns of at for black hole masses , which are close to the observed values for warm absorbers, as are the typical velocities of few hundred to a few thousand km s-1 (see Fig. 7).
6 Comparison to observations
The predictions above for thermal winds appear to be quite well matched to the observed properties of warm absorbers. However, the individual AGNs all have different mass, luminosity, inclination, and presumably spin. This makes it difficult to compare the change in wind properties using tracks of constant mass. Therefore, we instead make predictions for each individual system from its own estimated mass and luminosity. We use the radio quiet AGN sample of Laha et al. (2014), which tabulates mass and luminosity along with the observed warm absorber properties, keeping our assumption of zero spin.
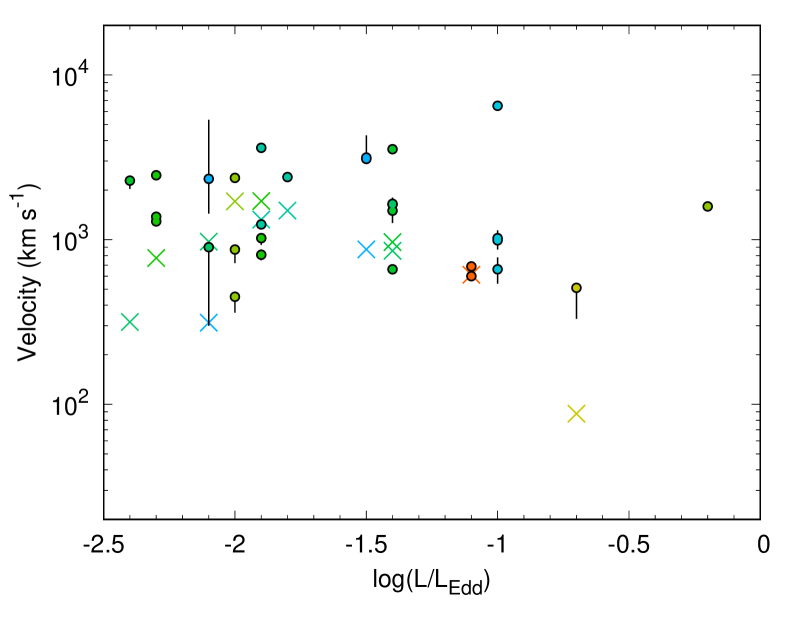
The upper panel of Fig. 12 shows a comparison between the observed wind velocities (circle bins with error bars) and the velocities we have calculated (crosses). The thermal wind model velocities are clearly consistent with the observed velocities of km s-1.
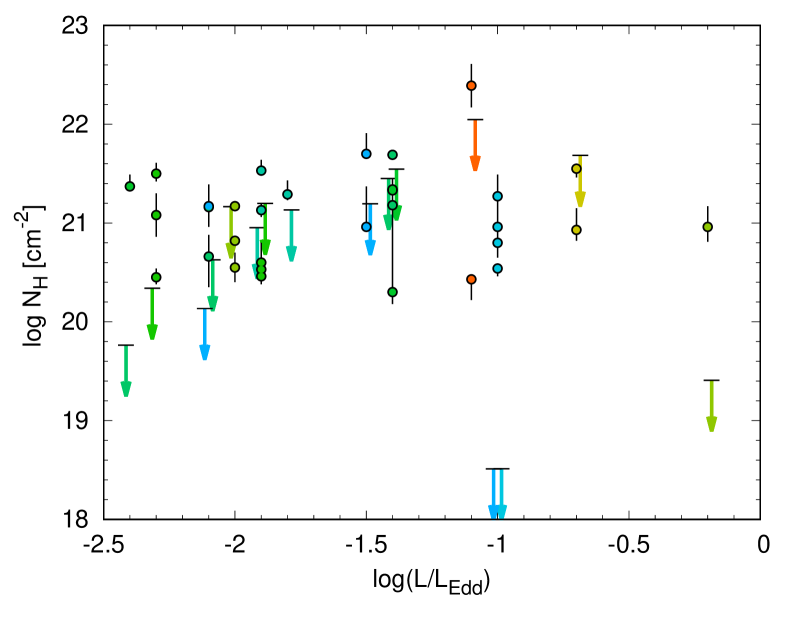
Next, we compare the column density in the middle panel in Fig. 12. The calculated values depend on the inclination angle from (see equation 10), and thus we plot the upper limit (when ) as a vertical arrow. The end point of the arrow corresponds to . Again the agreement with the observed columns is generally good, with some exceptions.
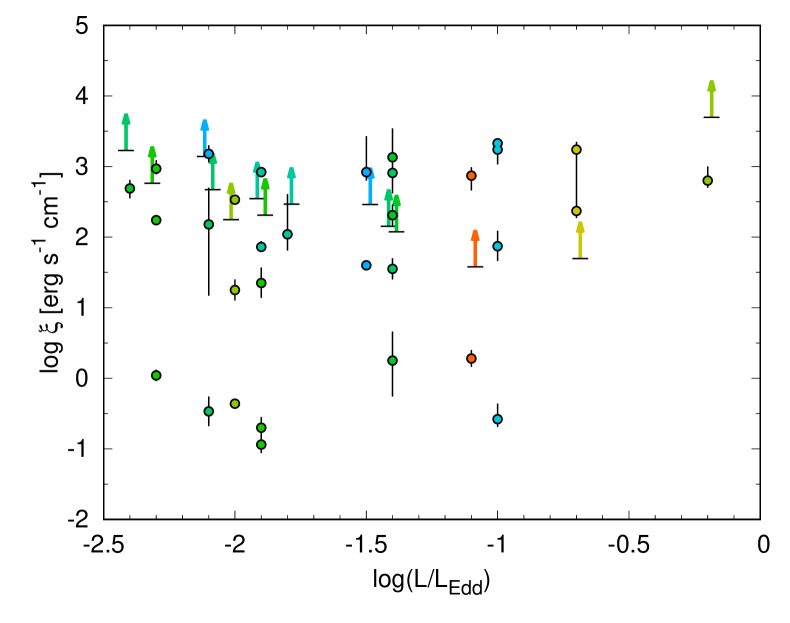
Finally, we show our results for the ionisation parameter and the corresponding observed values are shown in the bottom panel in Fig. 12, again with a vertical arrow marking the lower limit of ionisation expected from the possible range of inclination angles. Here the predicted values form an upper bound of the observed ionisation states, but there are many points which lie 2–4 orders of magnitude below. Most of these are from the same objects as are also detected with absorption columns at the much higher ionisation stage, as most of the warm absorbers detected in AGN are multi-phase.
We first consider whether the thermal wind can naturally produce such a multi-phase absorber. Studies of individual objects show that many of these phases appear to be in pressure equilibrium (e.g. Krongold et al. 2003; Krongold et al. 2007, 2009; Netzer et al. 2003). The red line in Fig. 13 shows the thermal equilibrium curves for gas in pressure balance for our SED for and . Regions to the lower right of the line have heating larger than cooling, while the upper left has cooling larger than heating. Where the thermal stability curve has an S-bend, this indicates that material on the middle branch is thermally unstable as it will rapidly heat up to join the upper branch, or cool down to join the lower branch. Two phase gas can stably co-exist in pressure equilibrium for between the minimum value on the upper branch and the maximum value on the lower (Krolik et al., 1981). There are two regions of S curve for this SED, one at where the gas can be at K on the upper branch, or K on the lower, and another separate region at where the gas can be at K or K. Since pressure then these separate phases have densities which are higher in proportion to their lower temperature, so they are characterised by a standard ionisation parameter () which is lower (Różańska et al., 2006; Gonçalves et al., 2006).
Holczer et al. (2007) introduced the absorption measure distribution (AMD) which defines the distribution of column density as a function of the standard ionisation parameter. They interpret a distinct dip in this distribution for the warm absorber gas in several objects as evidence for the thermal instability (see Behar 2009; Holczer & Behar 2012).
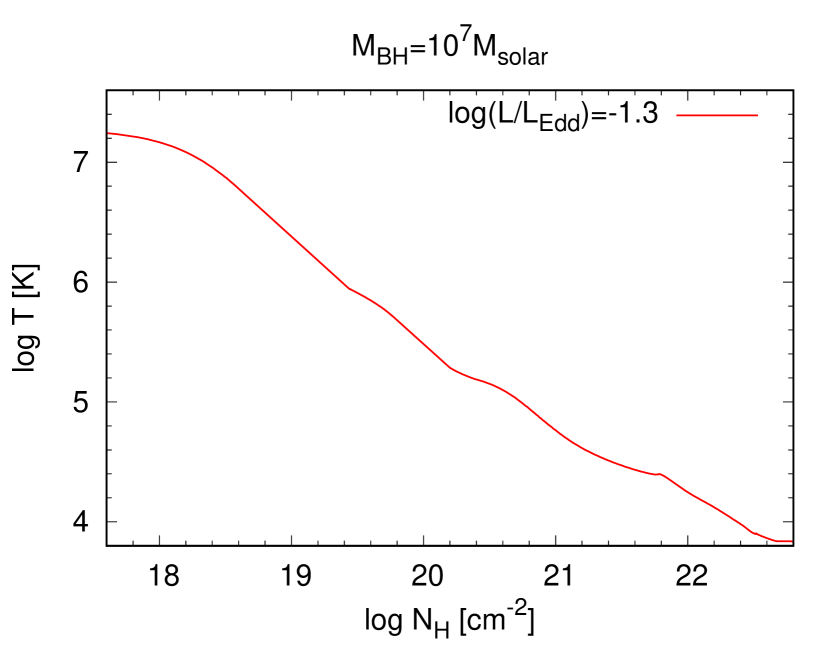
The thermal instabilities are always triggered in material with large enough column density (radiation pressure confinement: Stern et al. 2014; Goosmann et al. 2016; Adhikari et al. 2019). Fig.14 shows the temperature versus column density into an irradiated slab in pressure balance for this SED and black hole mass. Given that Fig. 2b shows that the luminosity is around the critical luminosity, this means that the Compton heating time is only just short enough to get material onto the upper branch, i.e. that its maximum ionisation is quite close to the critical ionisation parameter . The material then starts out close to the instability point so a multi-phase outflow may quite easily develop even with a total column of only cm-2.
However, the more material drops down onto the lower branch, the less there is on the upper branch. The predicted column densities with all the material in the upper branch were already a little low, so putting more material on the lower branch to decrease the tension with the ionisation parameters will increase the tension with the column density. This is especially an issue with the high mass accretion rates, where the column density is predicted to be lower, and there is no true instability (black line in Fig. 13). Instead, it seems more likely that there are additional processes at work which enhance the column density of wind material.

The thermal instability is also required to explain the UV absorption lines. In some AGNs (e.g. NGC 4151) the lower ionisation phase of the warm absorber gas can be traced through both soft X-ray absorption and UV absorption. The low ionisation parameter means that it cannot be on the upper branch of the thermal heating/cooling curve, so it has much lower temperature than required to escape as a thermal wind (Crenshaw & Kraemer, 2007). This material could be accelerated via thermal driving to its current velocity, and then cool (and probably clump) via the thermal instability.
The requirement for additional wind material is seen even more clearly in radio loud AGN. These can show warm absorbers, though the columns are generally towards the lower range of those seen in radio quiet AGN (Mehdipour & Costantini, 2019). However, the black holes are very massive () where our model gives a thermal wind launching radius which exceeds the self-shielding radius of the torus (see Fig. 5). The thermal wind column density is then negligible.
7 Discussion
Our thermal wind model successfully predicts the velocity of the warm absorbers (not the ultrafast outflows) seen in AGN, but the column density of material is often a little lower than observed especially if this material has to be shared between multiple phases of gas with different ionisation state. Instead, it seems more likely that there are additional sources of material and/or launch mechanisms for these outflows. This is especially the case for higher mass AGN, where the launch radius for thermal winds is much larger than the inner edge of the dust torus. Our assumed circular torus geometry means that there is self-shielding at these radii, so very little wind is predicted. A different assumed torus geometry would change this, e.g. a torus with conical/flared rather than circular cross-section would allow material further out to be illuminated, increasing the total column density of the thermal wind predictions as these go as . Similarly, a clumpy rather than smooth torus (e.g. Nenkova et al. 2008) will allow more irradiation at larger radii as well as make a more inhomogeneous thermal wind.
The torus shape should be determined self consistently, as it is sculpted by the mass loss via the wind. Hydrodynamic simulations of this are shown in Dorodnitsyn et al. (2008a, b) and (Dorodnitsyn & Kallman, 2009), where they start with a smooth torus of finite optical depth, and follow the evolution as the X-ray heating produces a thermal wind. However, in these simulations, the inner edge of the torus is arbitrary rather than being tied to the dust sublimation radius. They assume a torus central radius of pc, with shape such that the inner edge is at (for their ), which is much larger than the inner edge of the dust sublimation region at 0.02–0.04 pc for their black hole mass of and assumed (see Fig. 5). They predict large column densities of gas at high inclinations, but much of this material is part of the torus rather than being in a wind as their torus density distribution means that it is optically thin around its edge. This is more realistic than the infinitely optically thick torus used here, but cannot explain the observed outflow columns unless the torus (and/or BLR) is itself part of an additional wind rather than just rotating as assumed here. Nor can it explain the observed statistics of the incidence of warm absorbers in more than 50% of AGN as these large columns only cover a small fraction of the torus opening (Dorodnitsyn & Kallman, 2009). The question then becomes what drives the wind which provides the material for the torus and BLR.
Dust is an obvious component of the torus, and may well also be responsible for the underlying driving mechanism for the BLR (Czerny & Hryniewicz, 2011). Dust opacity is much larger than the electron scattering cross-section, particularly for UV wavelengths, so there is again a ‘force multiplier’ effect, reducing the effective Eddington limit. Fabian et al. (2008) showed that this is for realistic AGN SEDs for columns cm-2. Thus all of the bright AGN considered here are effectively super-Eddington for low columns of dusty gas, so should power a wind from the surface of the torus. Hydrodynamic simulations including dust have focused on the role of trapped infrared radiation in producing the scale height of the torus (Dorodnitsyn et al., 2012; Dorodnitsyn & Kallman, 2012), but models including dynamics show a strong dust driven wind from the inner edge of the torus (Wada, 2012, 2015; Chan & Krolik, 2016; Dorodnitsyn et al., 2016).
Hence it seems most likely that the warm absorbers are thermal-radiative winds, rather than solely thermal, and where the radiation pressure is mainly on the dust grains present in the torus.
8 Conclusion
Krolik & Kriss (2001) showed that the warm absorbers seen in AGN result could plausibly result from a thermal wind from the torus, and highlighted the role of the thermal instability in producing the observed multi-phase absorbing gas. Thermal winds are sensitive to the SED, and there is now more observational data on how the SED changes as a function of mass and mass accretion rate in AGN. We use the specific models of Kubota & Done (2018) which can reproduce these general trends (qsosed). These predict that the Compton temperature decreases with Eddington ratio, which increases the radius from which the wind is launched in terms of . The irradiated material in the BLR and torus has radius so thermal winds are launched from the BLR for low mass, low mass accretion rate AGN, and from the outer edge of the torus for high mass, high mass accretion rates. We use the analytic models of thermal winds developed by Done et al. (2018) to make quantitative predictions of the amount of column produced by thermal winds in AGN. We show generally that these predictions are in tension with the observations, especially if the thermal instability is invoked in order to produce the observed low ionisation gas components. Instead, dust driven winds from the inner edge of the torus is more likely to be the origin of much of the observed outflow material, with the X-ray heating contributing more to the observed multi-phase ionisation structure. Hydrodynamic simulations of this complex, dynamic environment show that this produces outflows and obscuration from the torus in line with the observations (Wada, 2015; Chan & Krolik, 2016; Dorodnitsyn et al., 2016).
Magnetic winds are not required in this picture. There are two main arguments used as evidence for such winds. In NGC 4151 (and other well studies AGN) the lower ionisation phase traced by UV absorption must have much lower temperature than required to escape as a thermal wind (Crenshaw & Kraemer, 2007). This is true, but this material could be accelerated via either thermal or dust driving and then cool (and probably clump) via the thermal instability. The second piece of evidence is that there is an anti-correlation of warm absorber column density with radio loudness in a sample of radio loud AGN (Mehdipour & Costantini, 2019). This could link the winds causally to the jet, which is clearly a magnetic structure and similar anti-correlation of wind and jet is seen directly in the stellar mass black hole binaries (Neilsen & Lee, 2009; Ponti et al., 2012). Nonetheless, in binaries the link to the jet is more likely to be via the changing SED with changing spectral state rather than causally via the jet magnetic field (Tomaru et al., 2019). The origin of the correlation in the small sample of radio loud AGN is yet to be clarified, but dust and thermal driving together clearly have the potential to explain most of the warm absorbers seen.
Acknowledgements
MM is financially supported by Japan Society for the Promotion of Science (JSPS) Overseas Research Fellowship. This work is partly supported by the Science and Technology Facilities Council (STFC) grant ST/P000541/1 (CD), Kavli Institute for the Physics and Mathematics of the Universe (IPMU) funding from the National Science Foundation No. NSF PHY17-48958 (CD), and JSPS KAKENHI Grant Number 19J13373 (RT).
References
- Adhikari et al. (2019) Adhikari T. P., Różańska A., Hryniewicz K., Czerny B., Behar E., 2019, ApJ, submitted (arXiv: 1812.05154)
- Balsara & Krolik (1993) Balsara D. S., Krolik J. H., 1993, ApJ, 402, 109
- Barvainis (1987) Barvainis R., 1987, ApJ, 320, 537
- Begelman et al. (1983) Begelman M. C., McKee C. F., Shields G. A., 1983, ApJ, 271, 70
- Behar (2009) Behar E., 2009, ApJ, 703, 1346
- Bentz et al. (2013) Bentz M. C., et al., 2013, ApJ, 767, 149
- Blandford & Payne (1982) Blandford R. D., Payne D. G., 1982, MNRAS, 199, 883
- Blustin et al. (2005) Blustin A. J., Page M. J., Fuerst S. V., Branduardi- Raymont G., Ashton C. E., 2005, A&A, 431, 111
- Chan & Krolik (2016) Chan C.-H., Krolik J. H., 2016, ApJ, 825, 67
- Crenshaw & Kraemer (2007) Crenshaw D. M., Kraemer S. B., 2007, ApJ, 659, 250
- Czerny & Hryniewicz (2011) Czerny B., Hryniewicz K., 2011, A&A, 525, L8
- Done et al. (2012) Done C., Davis S. W., Jin C., Blaes O., Ward M., 2012, MNRAS, 420, 1848
- Done et al. (2018) Done C., Tomaru R., Takahashi T., 2018, MNRAS, 473, 838
- Dorodnitsyn & Kallman (2009) Dorodnitsyn A., Kallman T., 2009, ApJ, 703, 1797
- Dorodnitsyn & Kallman (2012) Dorodnitsyn A., Kallman T., 2012, ApJ, 761, 70
- Dorodnitsyn et al. (2008a) Dorodnitsyn A., Kallman T., Proga D., 2008a, ApJ, 675, L5
- Dorodnitsyn et al. (2008b) Dorodnitsyn A., Kallman T., Proga D., 2008b, ApJ, 687, 97
- Dorodnitsyn et al. (2012) Dorodnitsyn A., Kallman T., Bisnovatyi-Kogan G. S., 2012, ApJ, 747, 8
- Dorodnitsyn et al. (2016) Dorodnitsyn A., Kallman T., Proga D., 2016, ApJ, 819, 115
- Elitzur & Shlosman (2006) Elitzur M., Shlosman I., 2006, ApJ, 648, L101
- Fabian et al. (2008) Fabian A. C., Vasudevan R. V., Gandhi P., 2008, MNRAS, 385, L43
- Fukumura et al. (2010) Fukumura K., Kazanas D., Contopoulos I., Behar E., 2010, ApJ, 715, 636
- Gonçalves et al. (2006) Gonçalves A. C., Collin S., Dumont A. M., Mouchet M., Różańska A., Chevallier L., Goosmann R. W., 2006, A&A, 451, L23
- Goosmann et al. (2016) Goosmann R. W., Holczer T., Mouchet M., Dumont A. M., Behar E., Godet O., Gonçalves A. C., Kaspi S., 2016, A&A, 589, A76
- Higginbottom et al. (2018) Higginbottom N., Knigge C., Long K. S., Matthews J. H., Sim S. A., Hewitt H. A., 2018, MNRAS, 479, 3651
- Holczer & Behar (2012) Holczer T., Behar E., 2012, ApJ, 747, 71
- Holczer et al. (2007) Holczer T., Behar E., Kaspi S., 2007, ApJ, 663, 799
- Hopkins & Elvis (2010) Hopkins P. F., Elvis M., 2010, MNRAS, 401, 7
- Jin et al. (2012) Jin C., Ward M., Done C., Gelbord J., 2012, MNRAS, 420, 1825
- Kaastra et al. (2000) Kaastra J. S., Mewe R., Liedahl D. A., Komossa S., Brinkman A. C., 2000, A&A, 354, L83
- Kaspi et al. (2000) Kaspi S., Brandt W. N., Netzer H., Sambruna R., Chartas G., Garmire G. P., Nousek J. A., 2000, ApJ, 535, L17
- Konigl & Kartje (1994) Konigl A., Kartje J. F., 1994, ApJ, 434, 446
- Krolik & Kriss (1995) Krolik J. H., Kriss G. A., 1995, ApJ, 447, 512
- Krolik & Kriss (2001) Krolik J. H., Kriss G. A., 2001, ApJ, 561, 684
- Krolik et al. (1981) Krolik J. H., McKee C. F., Tarter C. B., 1981, ApJ, 249, 422
- Krongold et al. (2003) Krongold Y., Nicastro F., Brickhouse N. S., Elvis M., Liedahl D. A., Mathur S., 2003, ApJ, 597, 832
- Krongold et al. (2007) Krongold Y., Nicastro F., Elvis M., Brickhouse N., Binette L., Mathur S., Jiménez-Bailón E., 2007, ApJ, 659, 1022
- Krongold et al. (2009) Krongold Y., et al., 2009, ApJ, 690, 773
- Kubota & Done (2018) Kubota A., Done C., 2018, MNRAS, 480, 1247
- Laha et al. (2014) Laha S., Guainazzi M., Dewangan G. C., Chakravorty S., Kembhavi A. K., 2014, MNRAS, 441, 2613
- Laor & Netzer (1989) Laor A., Netzer H., 1989, MNRAS, 238, 897
- McKernan et al. (2007) McKernan B., Yaqoob T., Reynolds C. S., 2007, MNRAS, 379, 1359
- Mehdipour & Costantini (2019) Mehdipour M., Costantini E., 2019, A&A, 625, A25
- Neilsen & Lee (2009) Neilsen J., Lee J. C., 2009, Nature, 458, 481
- Nenkova et al. (2008) Nenkova M., Sirocky M. M., Ivezić Ž., Elitzur M., 2008, ApJ, 685, 147
- Netzer et al. (2003) Netzer H., et al., 2003, ApJ, 599, 933
- Ponti et al. (2012) Ponti G., Fender R. P., Begelman M. C., Dunn R. J. H., Neilsen J., Coriat M., 2012, MNRAS, 422, L11
- Proga & Kallman (2004) Proga D., Kallman T. R., 2004, ApJ, 616, 688
- Różańska et al. (2006) Różańska A., Goosmann R., Dumont A. M., Czerny B., 2006, A&A, 452, 1
- Sako et al. (2001) Sako M., et al., 2001, A&A, 365, L168
- Shakura & Sunyaev (1973) Shakura N. I., Sunyaev R. A., 1973, A&A, 24, 337
- Starling et al. (2004) Starling R. L. C., Siemiginowska A., Uttley P., Soria R., 2004, MNRAS, 347, 67
- Stern et al. (2014) Stern J., Laor A., Baskin A., 2014, MNRAS, 438, 901
- Tomaru et al. (2019) Tomaru R., Done C., Ohsuga K., Nomura M., Takahashi T., 2019, MNRAS, submitted, arXiv:1905.11763
- Vasudevan & Fabian (2007) Vasudevan R. V., Fabian A. C., 2007, MNRAS, 381, 1235
- Vasudevan & Fabian (2009) Vasudevan R. V., Fabian A. C., 2009, MNRAS, 392, 1124
- Wada (2012) Wada K., 2012, ApJ, 758, 66
- Wada (2015) Wada K., 2015, ApJ, 812, 82
- Woods et al. (1996) Woods D. T., Klein R. I., Castor J. I., McKee C. F., Bell J. B., 1996, ApJ, 461, 767