Evolution and pulsations of population I post–AGB stars
© 2019 г. Yu. A. Fadeyev***E–mail: fadeyev@inasan.ru
Institute of Astronomy, Russian Academy of Sciences, Pyatnitskaya ul. 48, Moscow, 119017 Russia
Received June 4, 2019; revised June 11, 2019; accepted June 25, 2019
Abstract — Evolutionary calculations of population I stars with initial masses , and were carried out up to the stage of the proto–planetary nebula. Selected models of post–AGB evolutionary sequences with effective temperatures were used as initial conditions in calculations of self–escited stellar oscillations. For the first time the sequences of hydrodynamic models of radially pulsating post–AGB stars were computed using the self–consistent solution of the equations of radiation hydrodynamics and time–dependent convection. Within this range of effective temperatures the post–AGB stars are the fundamental mode pulsators with period decreasing as the star evolves from day to several days. Period fluctuations are due to nonlinear effects and are most prominent at effective temperatures K. The amplitude of bolometric light variations is at K and rapidly decreases with increasing . The theoretical dependence of the pulsation period as a function of effective temperature obtained in the study can be used as a criterion for the evolutionary status of pulsating variables suspected to be post–AGB stars.
Keywords: stars: variable and peculiar
introduction
The red giant evolutionary stage of stars with solar composition and the zero–age main sequence mass is completed due to the strong stellar wind and the loss of the major fraction of the hydrogen envelope. The star leaves the asymptotic giant branch (AGB) and crosses the Hertzsprung–Russel diagram (HRD) at nearly constant luminosity towards the region of planetary nebula cores with effective temperatures K. An idea that the planetary nebulae originate from red giants was suggested by Shklovsky (1956) and was later confirmed by evolutionary computations (Paczyński, 1971; Schönberner, 1979; 1981; Wood, Faulkner, 1986; Vassiliadis, Wood, 1994; Blöcker, 1995; Weiss, Ferguson, 2009; Miller Bertolami, 2016).
Formation of the opaque gas–dust envelope surrounding the star on the tip of the AGB substantially restricts abilities of optical observations, so that the evolutionary transition to the post–AGB stage still remains unclear. The strong stellar wind on the tip of the AGB seems to be due to nonlinear stellar pulsations that lead to dynamical instability of the outer stellar layers (Tuchman et al., 1978). Therefore, large infrared (IR) excesses detected in post–AGB stars (Volk, Kwok, 1989; Hrivnak et al., 1989; 1994; Ikonnikova et al., 2018) indicate existence of circumstellar dust grains condensed during the preceding evolutionary stage with high mass loss rates.
The photometric variability due to stellar pulsations is a typical property of post–AGB stars. The period of light variations ranges from several dozen days (Arkhipova et al., 2010; Hrivnak et al.2015; 2018) to day (Arkhipova et al., 2009; 2016; Ikonnikova et al., 2018). Moreover, the pulsating variable AI CMi with period day seems to be the early post–AGB star (Arkhipova et al., 2017). A common feature of post–AGB stars is a lack of strict repetition in light variations, so that observational estimates of the period are often highly uncertain.
The post–AGB stars are on the late stage of stellar evolution so that comparison of observations with results of evolutionary computations is often accompanied with difficulties arising from uncertainties of the theory (e.g., the mass loss rate on the AGB stage). This problem can be clarified with application of the stellar pulsation theory. Results of the linear analysis of pulsational instability were presented by Zalewski (1985; 1993) and Gautschy (1993) who showed that the region of pulsational instability of post–AGB stars on the HRD extends to effective temperatures as high as K. However one should bear in mind that at luminosity to mass ratios typical for post–AGB stars () the low gas density and the small adiabatic exponent in the pulsating envelope imply high nonadiabaticity and strong nonlinearity of stellar oscillations. Results of hydrodynamic computations show that radial oscillations of low–mass supergiants of intermediate spectral types have the large amplitude and absence of strict periodicity is due to nonlinear effects (Fadeyev, Tutukov, 1981; Fadeyev, 1982; 1984; Aikawa, 1985a; 1985b; 1991; 1993; Fokin et al., 2001). Unfortunately, in all these works the authors ignored convection and assumed that energy transfer in the pulsating envelope is due to radiation. However the role of convection in stellar pulsation motions becomes important at effective temperatures K, i.e. at pulsation periods day.
The goal of the present work is to investigate nonlinear oscillations of post–AGB stars with effective temperatures . The equations of radiation hydrodynamics and time–dependent convection are solved with initial conditions obtained from selected models of previously calculated evolutionary sequences. Computations of stellar evolution were done with the MESA code version 10398 (Paxton et al., 2018) from the main sequence to the stage of the proto–planetary nebula with effective temperature K. Details of evolutionary computations (the nuclear network, convective mixing, mass loss rates) are described in our previous study (Fadeyev, 2018). The initial composition of stellar material was assumed to correspond to population I stars with fractional mass abundances of hydrogen and helium and , respectively. Abundances of elements heavier than helium were scaled according to Grevesse and Sauval (1998). Equations of hydrodynamics and parameters of the time–dependent convection theory (Kuhfuß, 1986) are discussed in our earlier papers (Fadeyev, 2013; 2015).
evolutionary sequences and initial conditions
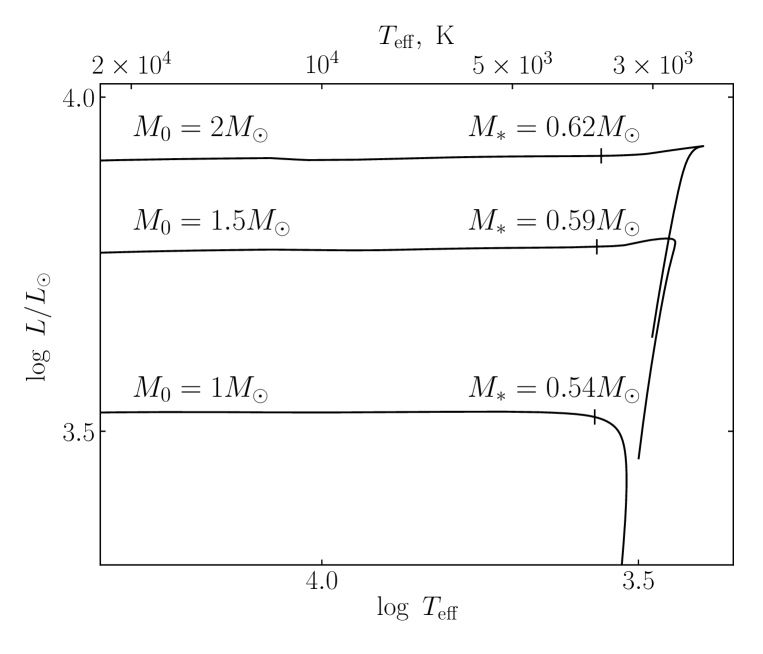
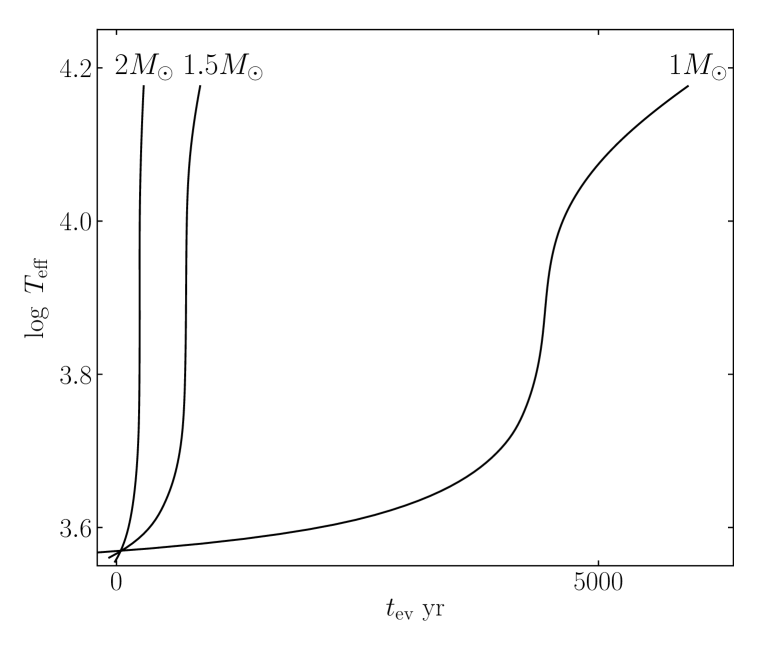
In the present study we computed three evolutionary sequences of stars with initial masses on the main sequence , and . Evolutionary tracks used in the present study for determination of initial conditions are shown in Fig. 1. Increase of luminosity in the right part of the figure represents the final phase of the AGB stage after the last thermal flash of the helium burning shell source. During this phase the mass of the hydrogen envelope rapidly decreases, whereas the stellar luminosity is generated in the hydrogen burning shell. According to Miller Bertolami (2016) we assume that the the post–AGB stage begins when the hydrogen envelope mass to star mass ratio is . The onset of the post–AGB stage is indicated for each track in Fig. 1 by the vertical dash where for the sake on convenience the evolutionary time is set to zero (). Further stellar evolution proceeds towards higher effective temperatures at insignificantly changing luminosity.
Main properties of stars at the beginning of the post–AGB stage are listed in Table 1, where is the initial stellar mass, is the star age measured from the zero age main sequence, is the star mass, is the mass of the degenerate carbon–oxygen core, is the stellar luminosity, is the effective temperature.
hydrodynamic models of post–AGB stars
The stellar radius as well as the mass of hydrogen and helium ionization zones decrease as the post–AGB star evolves on the HRD towards the area of planetary cores. Therefore, evolutionary decrease of the pulsation period is accompanied by decreasing pulsation instability growth rate and diminishing role of nonlinear effects in stellar oscillations. At effective temperatures K radial pulsations are driven in the hydrogen ionization zone which encompasses the substantial part of the stellar envelope. In stars with higher effective temperatures radial oscillations are driven in the helium ionization zones. Unfortunately, absence of strict repetition of pulsation motions does not allow us to calculate the mechanical work done by each mass zone of the hydrodynamic model (here is the total pressure and is the specific volume) in order to evaluate its contribution into excitation or suppression of pulsational instability.
As in our earlier studies devoted to nonlinear pulsations of AGB stars (Fadeyev, 2017; 2018) the pulsation period was determined using the discrete Fourier transform of the kinetic energy of the pulsating stellar envelope. Thus, the period estimate of each hydrodynamic model was obtained by averaging over the time interval of the solution of the equations of hydrodynamics. For most hydrodynamic models the solution of the Cauchy problem comprised nearly a hundred pulsation cycles.
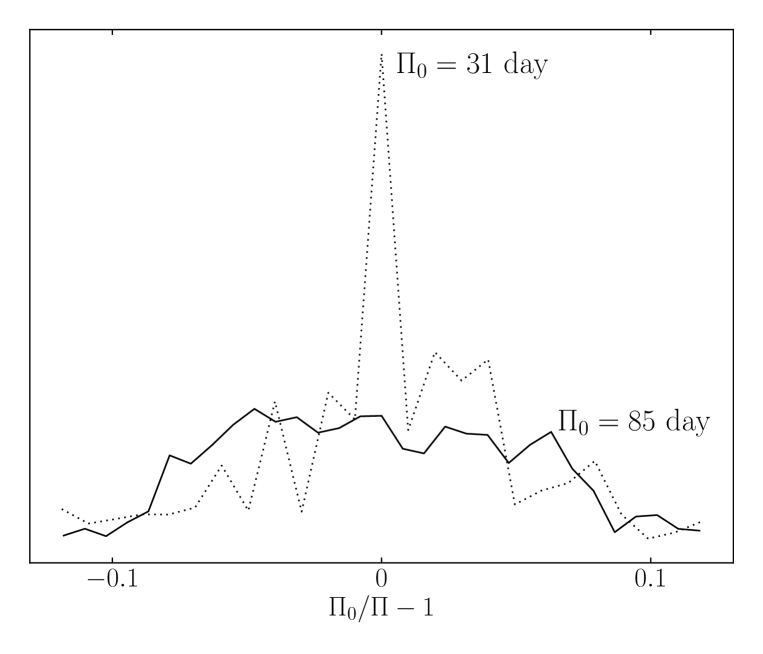
A reduction of the role of nonlinear effects during evolution of the post–AGB star is illustrated in Fig. 3 where the plots of normalized power spectrum of the pulsation kinetic energy are shown for two hydrodynamic models of the evolutionary sequence . At the stellar effective temperature K the growth rate of kinetic energy is and the mean fundamental mode period is day. As can be seen in Fig. 3, cycle–to–cycle variations of the period due to nonlinear effects range within of the mean period. In the star with effective temperature K the growth rate decreases up to whereas cycle–to–cycle variations of the period around its mean value reduce to a few per cent.
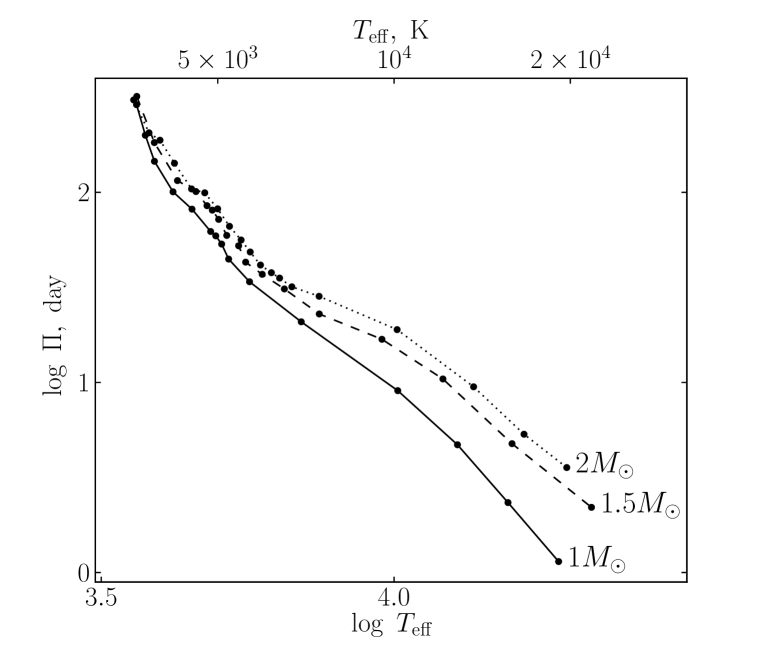
The plots of the mean radial pulsation period as a function of effective temperature for evolutionary sequences , and are shown in Fig. 4. At the beginning of the post–AGB stage the pulsation period is in all evolutionary sequences. While the effective temperature increases up to K the period decreases by more than two orders of magnitude. For more convenient comparison of theoretical dependences with observations the star age and the pulsation period are listed for each evolutionary sequence in Table 2 as a function of the effective temperature. The presented tabular data were obtained by nonlinear interpolation of the results of evolutionary and hydrodynamic computations.
In the last column of Table 2 we give typical amplitude of the bolometric light . In stars with effective temperature K modulation of radiative flux takes place in the hydrogen ionization zone, so that the amplitude of bolometric light is mag. At effective temperatures K the principal role in modulation of the radiative flux belongs to helium ionization zones and the light amplitude reduces to . Further evolutionary increase of effective temperature is accompanied by decrease of the mass of the pulsating envelope so that the bolometric light amplitude becomes less than 0.01 mag for K.
conclusions
In this paper we presented results of stellar evolution and nonlinear stellar pulsation calculations that describe the evolutionary change of the pulsation period of post–AGB stars. Self–consistent solution of the equations of radiation hydrodynamics and time–dependent convection allowed us to compute sequences of hydrodynamic models for effective temperatures ranging from 3600 K to K. Nearly twentyfold change of the evolution rate within the initial mass interval allows us to conclude that most of observed post–AGB stars originate from stars with intial mass . For more detailed comparison of the theory with observations the existing grids of evolutionary and hydrodynamic models of post–AGB stars should be extended due to different values of initial metal abundances and mass loss rates.
Dependences given in Fig. 4 and in Table 2 can be used for determination of the evolutionary status of the observed pulsating variable which is suspected to be the post–AGB star. For example, let us consider the pulsating variable AI CMi. According to the General Catalogue of Variable Stars (Samus’ et al., 2017) AI CMi is the semiregular pulsating variable of the spectral type G5Iab with period day. Assuming that the mean effective temperatures corresponding to the spectral type of AI CMi is we find from Table 2 that the upper limit of the pulsation period of the post–AGB star is nearly two times less, that is day. It should be noted that the main obstacle in determination of the evolutionary status of the suspected post–AGB star is uncertainty in observational estimate of the period. Therefore, contradiction between observational estimate of the period and evolutionary status of AI CMi as the post–AGB star might be avoided due to smaller observational estimates of .
references
-
1.
T. Aikawa, Astrophys. Space Sci. 112, 125 (1985a).
-
2.
T. Aikawa, Astrophys. Space Sci. 116, 401 (1985b).
-
3.
Т. Aikawa, Astrophys. J. 374, 700 (1991).
-
4.
T. Aikawa, MNRAS 262, 893 (1993).
-
5.
V.P. Arkhipova, V.F. Esipov, N.P. Ikonnikova, G.V. Komissarova, A.M. Tatarnikov, and B.F. Yudin, Astron. Lett. 35, 764 (2009).
-
6.
V.P. Arkhipova, N.P. Ikonnikova, and G.V. Komissarova, Astron. Lett. 36, 269 (2010).
-
7.
V.P. Arkhipova, O.G. Taranova, N.P. Ikonnikova, V.F. Esipov, G.V. Komissarova, V.I. Shenavrin, and M.A. Burlak, Astron. Lett. 42, 756 (2016).
-
8.
V.P. Arkhipova, N.P. Ikonnikova, V.F. Esipov, and G.V. Komissarova, Astron. Lett. 43, 416 (2017).
-
9.
T. Blöcker, Astron. Astrophys. 299, 755 (1995).
-
10.
Yu.A. Fadeyev, Astrophys Space Sci. 86, 143 (1982).
-
11.
Yu.A. Fadeyev, Astrophys Space Sci. 100, 329 (1984).
-
12.
Yu.A. Fadeyev and A.V. Tutukov, MNRAS 195, 811 (1981).
-
13.
Yu.A. Fadeyev, Astron. Lett. 39, 306 (2013).
-
14.
Yu.A. Fadeyev, MNRAS 449, 1011 (2015).
-
15.
Yu.A. Fadeyev, Astron. Lett. 43, 602 (2017).
-
16.
Yu.A. Fadeyev, Astron. Lett. 44, 546 (2018).
-
17.
A.B. Fokin, A. Lébre, H. Le Coroller, and D. Gillet, 2001, Astron. Astrophys. 378, 546 (2001).
-
18.
A. Gautschy, MNRAS 265, 340 (1993).
-
19.
N. Grevesse and A.J. Sauval, Space Sci. Rev. 85, 161 (1998).
-
20.
B.J. Hrivnak, S. Kwok, and K.M. Volk, Astrophys. J. 346, 265 (1989).
-
21.
B.J. Hrivnak, S. Kwok, and T.R. Geballe, Astrophys. J. 420, 783 (1994).
-
22.
B.J. Hrivnak, W. Lu, and K.A. Nault, Astron. J. 149, 184 (2015).
-
23.
B.J. Hrivnak, G. Van de Steene, H. Van Winckel, W. Lu, and J. Sperauskas, Astron. J. 156, 300 (2018).
-
24.
N.P. Ikonnikova, O.G. Taranova, V.P. Arkhipova, G.V. Komissarova, V.I. Shenavrin, V.F. Esipov, M.A. Burlak, and V.G. Metlov, Astron. Lett. 44, 457 (2018).
-
25.
R. Kuhfuß, Astron. Astrophys. 160, 116 (1986).
-
26.
M.M. Miller Bertolami, Astron. Astrophys. 588, A25 (2016).
-
27.
B. Paczyński, Acta Astron. 21, 417 (1971).
-
28.
B. Paxton, J. Schwab, E.B. Bauer, L. Bildsten, S. Blinnikov, P. Duffell, R. Farmer, J.A. Goldberg, et al., Astropys. J. Suppl. Ser. 234, 34 (2018).
-
29.
N.N. Samus’, E.V. Kazarovets, O.V. Durlevich, N.N. Kireeva, and E.N. Pastukhova, Astron. Rep. 61, 80 (2017)].
-
30.
D. Schönberner, Astron. Astrophys. 79, 108 (1979).
-
31.
D. Schönberner, Astron. Astrophys. 103, 119 (1981).
-
32.
I.S. Shklovsky, Astronomicheskii Zhurnal 33, 315 (1956).
-
33.
Y. Tuchman, N. Sack, and Z. Barkat, Astrophys. J. 219, 183 (1978).
-
34.
E. Vassiliadis and P.R. Wood, Astrophys. J. Suppl. Ser. 92, 125 (1994).
-
35.
K.M. Volk and S. Kwok, Astrophys. J. 342, 345 (1989).
-
36.
A. Weiss and J.W. Ferguson, Astron. Astrophys. 508, 1343 (2009).
-
37.
P.R. Wood and D.J. Faulkner, Astrophys. J. 307, 659 (1986).
-
38.
J. Zalewski, Acta Astron. 35, 51 (1985).
-
39.
J. Zalewski, Acta Astron. 43, 431 (1993).
| yr | , K | , yr | ||||
|---|---|---|---|---|---|---|
| 1.0 | 12.607 | 0.542 | 0.493 | 3322 | 3707 | 7485 |
| 1.5 | 3.040 | 0.590 | 0.550 | 5971 | 3678 | 1077 |
| 2.0 | 1.352 | 0.615 | 0.581 | 8169 | 3620 | 342 |
| , K | |||||||
|---|---|---|---|---|---|---|---|
| , yr | , day | , yr | , day | , yr | , day | ||
| 3600 | -1642 | 320.9 | -146 | 346.4 | -11 | 298.1 | 1.0 |
| 3800 | 953 | 180.8 | 171 | 207.1 | 77 | 207.8 | |
| 4000 | 2191 | 123.1 | 357 | 149.5 | 128 | 185.6 | |
| 4200 | 2866 | 100.1 | 466 | 121.5 | 161 | 145.7 | |
| 4500 | 3456 | 82.7 | 567 | 100.7 | 192 | 104.7 | |
| 5000 | 3957 | 57.5 | 656 | 73.4 | 220 | 81.7 | |
| 6000 | 4307 | 29.8 | 707 | 36.7 | 237 | 39.9 | 0.5 |
| 8000 | 4461 | 15.2 | 722 | 20.9 | 240 | 26.6 | 0.1 |
| 10000 | 4630 | 9.4 | 729 | 15.7 | 241 | 19.4 | 0.01 |
| 12000 | 5033 | 5.8 | 759 | 10.7 | 252 | 13.3 | |
| 15000 | 5927 | 2.7 | 868 | 5.7 | 282 | 7.3 | |