GASP. XX. From the loose spatially-resolved to the tight global SFR-Mass relation in local spiral galaxies
Abstract
Exploiting the sample of 30 local star-forming, undisturbed late-type galaxies in different environments drawn from the GAs Stripping Phenomena in galaxies with MUSE (GASP), we investigate the spatially resolved Star Formation Rate-Mass (-) relation. Our analysis includes also the galaxy outskirts (up to effective radii, ), a regime poorly explored by other Integral Field Spectrograph surveys. Our observational strategy allows us to detect H out to more than 2.7 for 75% of the sample. Considering all galaxies together, the correlation between the and is quite broad, with a scatter of 0.3 dex. It gets steeper and shifts to higher values when external spaxels are excluded and moving from less to more massive galaxies. The broadness of the overall relation suggests galaxy-by-galaxy variations. Indeed, each object is characterized by a distinct - relation and in some cases the correlation is very loose. The scatter of the relation mainly arises from the existence of bright off-center star-forming knots whose - relation is systematically broader than that of the diffuse component. The - (total gas surface density) relation is as broad as the - relation, indicating that the surface gas density is not a primary driver of the relation. Even though a large galaxy-by-galaxy variation exists, mean and values vary of at most 0.7 dex across galaxies. We investigate the relationship between the local and global SFR-M∗ relation, finding that the latter is driven by the existence of the size-mass relation.
keywords:
galaxies: evolution – galaxies: star formation – galaxies: spiral1 Introduction
The Star Formation Rate (SFR) - Mass relation () is one of the most studied relations in astrophysics (e.g. Brinchmann et al., 2004; Salim et al., 2007; Noeske et al., 2007a, b). It shows how tightly a galaxy’s SFR and its total stellar mass are related, at any redshift, for star forming galaxies (Star Forming Main Sequence, SFMS). Higher stellar mass systems undergo more intense star formation activity than lower mass systems. At all redshifts, the dispersion of the correlation is only 0.2-0.3 dex in SFR for a fixed mass and the slope is somewhat smaller than unity, implying that the relative rate at which stars form in galaxies, i.e. the specific star formation rate (SSFR), declines weakly with increasing galaxy mass (Salim et al., 2007; Schiminovich et al., 2007). From to high redshift the normalization increases to higher values: by at a fixed stellar mass SFRs are higher by a factor of (e.g. Noeske et al., 2007a; Daddi et al., 2007; Vulcani et al., 2010; Elbaz et al., 2011; Whitaker et al., 2012; Speagle et al., 2014; Schreiber et al., 2015; Barro et al., 2017).
The existence of such relation points to a scenario where galaxies form through secular processes rather than stochastic merger-driven star-forming episodes. Universal laws seem to govern their evolution throughout cosmological time and across many different environments. Galaxies evolve along the SFMS, increasing in mass through the accretion of cold gas through mergers and/or from the cosmic web, until the supply of gas is shut off, most likely when a critical mass is reached (Cattaneo et al., 2006). Star formation is thus interrupted, and the galaxy moves to the red sequence, where it may further grow in mass and size through minor mergers (e.g., Faber et al., 2007; Lilly et al., 2013). The quenching phase is critical in the life of a galaxy, nonetheless, the conditions leading the the galaxy quenching are still obscure.
A great limitation to the comprehension of the connection between SFR and is that most studies consider galaxies as a whole, with integrated observations that do not distinguish among the morphological components, or that only partially cover the galaxies and are thus subject to aperture effects. A step forward is to characterise the relation on smaller scales, using spatially resolved data.
If the relation between star formation and mass still held on small scales, it would suggest that the global SFR- relation is primarily the outcome of the local correlation and the mechanism that drives the star formation activity with respect to the stellar mass could be universal across various physical scales, similarly to the Kennicutt-Schmidt relation (Kennicutt, 1998b) between the SFR surface density () and the cold gas surface density that has been found to hold both locally (e.g., Bigiel et al., 2008) and globally. The opposite is indeed unreasonable, as it seems rather fine-tuned that a mechanism acting on global scales affects both the surface mass density () and exactly in the same way, without a local process being involved or that a process reverts to the mean when averaged over large volumes.
On the other hand, the lack of a correlation between these spatially resolved quantities would suggest a galaxy-wide process that regulates the SFR of galaxies as a whole.
Outside our Galaxy, spatially resolved properties have been investigated for M31 (Viaene et al., 2014), who performed SED fitting of a panchromatic dataset, covering UV to submm wavelengths at a physical resolution of 140 600 pc. They found that regions of higher tend to host less star formation, suggesting an internal downsizing process in star formation, in which the regions of highest stellar density have already stopped forming stars. In addition, star formation at small scales has a weak dependence on the stellar mass: small- scale environments characterised by different stellar masses can be associated with very different levels of star formation.
An attempt to study the spatially resolved SFMS relation in local (0.01 < z < 0.02) massive disc galaxies using photometric data was performed by Abdurro’uf & Akiyama (2017), who combined seven bands imaging data from Galaxy Evolution Explorer (GALEX) and Sloan Digital Sky Survey (SDSS) fitting the spatially resolved SED of a galaxy with a set of model photometric SEDs using a Bayesian statistics approach. They showed that the relation is almost linear and presents a bending at . The same authors also applied the same technique at higher redshift, finding overall similar results (Abdurro’uf, 2018). Exploiting 10-band photometry from the UV to the near-infrared at HST resolution, Morselli et al. (2018) derived spatially resolved maps of stellar masses and SFRs, finding that the star formation activity is centrally enhanced in galaxies above the SFMS and centrally suppressed below it. The level of suppression correlates with the distance from the SFMS. They concluded that the presence of the bulge plays an important role: at a fixed stellar mass, bulge-dominated galaxies are preferentially located below the SFMS, while disk-like galaxies with low Sersic indexes are preferentially located on the upper envelope of the SFMS. The suppression of star formation activity in the central region of galaxies below the SFMS points to an inside-out quenching scenario, as star formation is still ongoing in the outer regions. The importance of separating the contribution of bulges and disks has also been emphasized by Abramson et al. (2014), who argued that re-normalizing the SFR by disk stellar mass, the star formation efficiency does not depend anymore on galaxy mass for star-forming disks, In contrast, Willett et al. (2015) found no statistically significant difference in the SFR- relations in a wide range of nearby morphological sub-types of star-forming disk galaxies, suggesting that these systems are strongly self-regulated.
The great step forward to the comprehension of the connection between SFR and is due to the advent of the Integral Field Spectroscopy (IFS) surveys, such as ATLAS3D (Cappellari et al., 2011)111Note that because of its focus on early type galaxies, ATLAS3D essentially avoids star forming systems, it is not an ideal sample to study the SFMS (McDermid et al., 2015)., CALIFA (Sánchez et al., 2012; Husemann et al., 2013; García-Benito et al., 2015), SAMI (Bryant et al., 2015), and MaNGA (Bundy et al., 2015), that have been designed to better understand the star formation and quenching in galaxies and that should help disentangle the contributions of different parameters to the SFR- relation, in the local universe. These surveys observed from to 10000 galaxies, with a spatial coverage ranging from at most 1 to 3 effective radii (). A complete comparison among the different surveys is given in Tab. 3 of Bundy et al. (2015).
All the largest IFU surveys have found overall concordant results, that can be summarised as follows. In nearby galaxies, and for regions where star formation dominates the ionization constitute a tight correlation (Rosales-Ortega et al., 2012; Sánchez, 2013; Pan et al., 2018; Liu et al., 2018; Erroz-Ferrer et al., 2019). Hall et al. (2018) have found that the slopes and zero-points of the different SFMS probed at different spatial resolution scales ranging from 0.05 to 10 kpc remain essentially the same. Also the scatter at each resolution scale is relatively constant out to 0.5-1 kpc, dropping slightly beyond that range (see also Kruijssen & Longmore, 2014). This correlation is invariant to changes in global properties, such as inclination, total stellar mass, local environment, Hi mass, redshift (Cano-Díaz et al. 2016; Ellison et al. 2018; Hall et al. 2018, but see Medling et al. 2018 for a dependence of the SFR distribution on galaxy local number density).
Cano-Díaz et al. (2016) exploiting CALIFA data and Hsieh et al. (2017) investigating MaNGA data have also shown that the slope and dispersion of this local SFMS are similar to those of the global SFR- relation (see also Hall et al., 2018). This result has also been shown to hold at higher redshift (Wuyts et al., 2013; Magdis et al., 2016). The remarkable agreement between the local and global SFR and relations suggests that the global main sequence may originate from a more fundamental relation on small scales and that the SFR is controlled by the amount of old stars locally (Hsieh et al., 2017).
The scatter of the - relation is strongly related to Hubble type (González Delgado et al., 2016), with the relation becoming less tight when early type galaxies are considered in the sample. In fact, a subpopulation of non passive early type galaxies exists (Sarzi et al., 2010; Medling et al., 2018) and these are preferentially located below the SFMS. According to Medling et al. (2018), the presence of a bulge plays only a marginal role: some galaxies with bulges continue their star formation exactly as late-type spirals would. On the other hand, González Delgado et al. (2016); Maragkoudakis et al. (2017) found that galaxies with higher bulge fractions tend to exhibit lower SFR for their . In M31, Viaene et al. (2014) found that the bulk of stars formed at early epochs in the bulge, and the more recent star formation happens at larger galactocentric distances (i.e. kpc).
The clear role of Hubble type in defining the offset around the overall - relation suggests that some global morphology-related property modulates the local , such as the gas content (Roberts & Haynes, 1994; Tacconi et al., 2013).
In spite of the many works focused on the spatially resolved - relation, no study has focused on the relation separately for bright HII regions and diffuse component. Indeed, the two components give different information about the gas-stellar cycle. HII regions are photoionised by massive young stars formed recently; the diffuse component (also known as warm ionized medium, WIM) is a warm ( K), ionized, low density (0.1 cm-3) gas between HII regions typically with low ionization parameter that can extend 1 kpc or more above the disk plane (Mathis, 2000; Haffner et al., 2009, and references therein). This gas component is most likely ionized by stars (O, B and hot evolved stars) in the disk whose Lyman continuum photons travel large path lengths (Mathis, 1986, 2000; Domgorgen & Mathis, 1994; Sembach et al., 2000; Wood & Mathis, 2004; Wood et al., 2010). Understanding if the two components follow similar - relations is thought important to understand their physics. Recently, a lot of effort is being put to characterise the metallicity of this diffuse component (e.g. Yan, 2018; Kumari et al., 2019). Erroz-Ferrer et al. (2019) have contrasted the metallicity of the HII region and the diffuse component, finding that the former have on average metallicities 0.1 dex higher than the latter.
In this paper we present the analysis of the spatially resolved SFR- relation for 30 undisturbed late-type galaxies in different environments drawn from the GAs Stripping Phenomena in galaxies with MUSE (GASP222http://web.oapd.inaf.it/gasp/index.html), an ESO Large programme that exploits the integral-field spectrograph MUSE mounted at the VLT with the aim to characterise where, how and why gas can get removed from galaxies in different environments. A complete description of the survey strategy, data reduction and analysis procedures is presented in Poggianti et al. (2017, Paper I).
Sections 2 presents the data sample and the data analysis, while Section 3 includes the results. We study the spatially resolved SFR- relation (-) for all galaxies (§3.1) and also for each galaxy separately (§3.2), emphasizing the galaxy-by-galaxy variations. We show how the variation is mainly due to the presence of bright off-center H knots, whose spatial distribution is different from one object to the other and whose is not strictly related to the value of in the same resolution element. We also investigate the relationship between and total gas surface density () (§3.3) and connect the local and global relations (§3.4), showing how the latter is a byproduct of the galaxy size mass relation. In Section 4 we discuss the results and conclude.
Throughout all the papers of the GASP series, we adopt a Chabrier (2003) initial mass function (IMF) in the mass range 0.1-100 M⊙. The cosmological constants assumed are , and H km s-1 Mpc-1.
2 Data sample, observations and data analysis
The GASP targets are at redshift , span a wide range of galaxy stellar masses, from to and are located in different environments (galaxy clusters, groups, filaments and isolated). The GASP project observed 114 galaxies in total. 76 of them are in clusters and 38 of them are in the less massive environments. The sample includes both galaxies selected as stripping candidates and undisturbed galaxies. A complete description of the survey strategy, observations, data reduction and analysis procedure is presented in Paper I.
We stress that our observations cover the entire optical extension of the galaxy (see below for the definition of the galaxy sizes), up to several effective radii, so our data are not affected by aperture loss.
2.1 Data sample
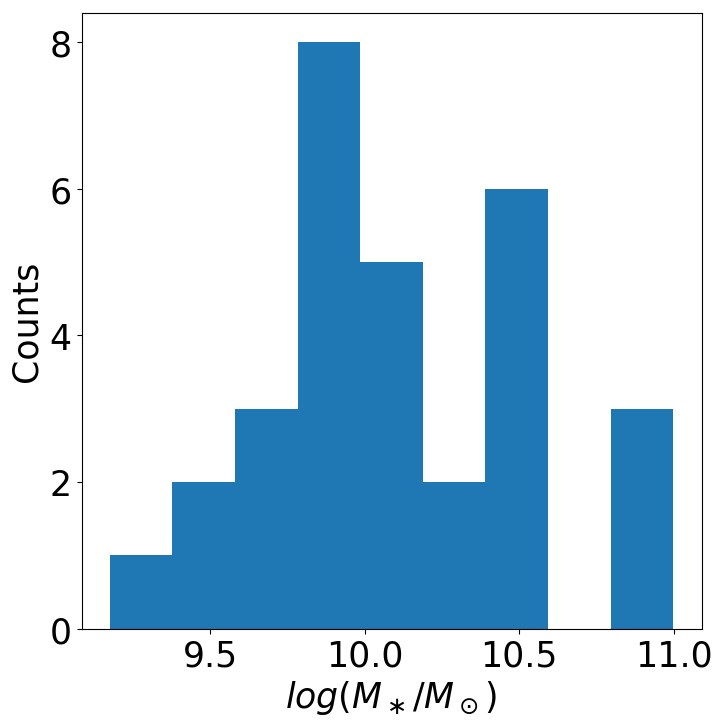
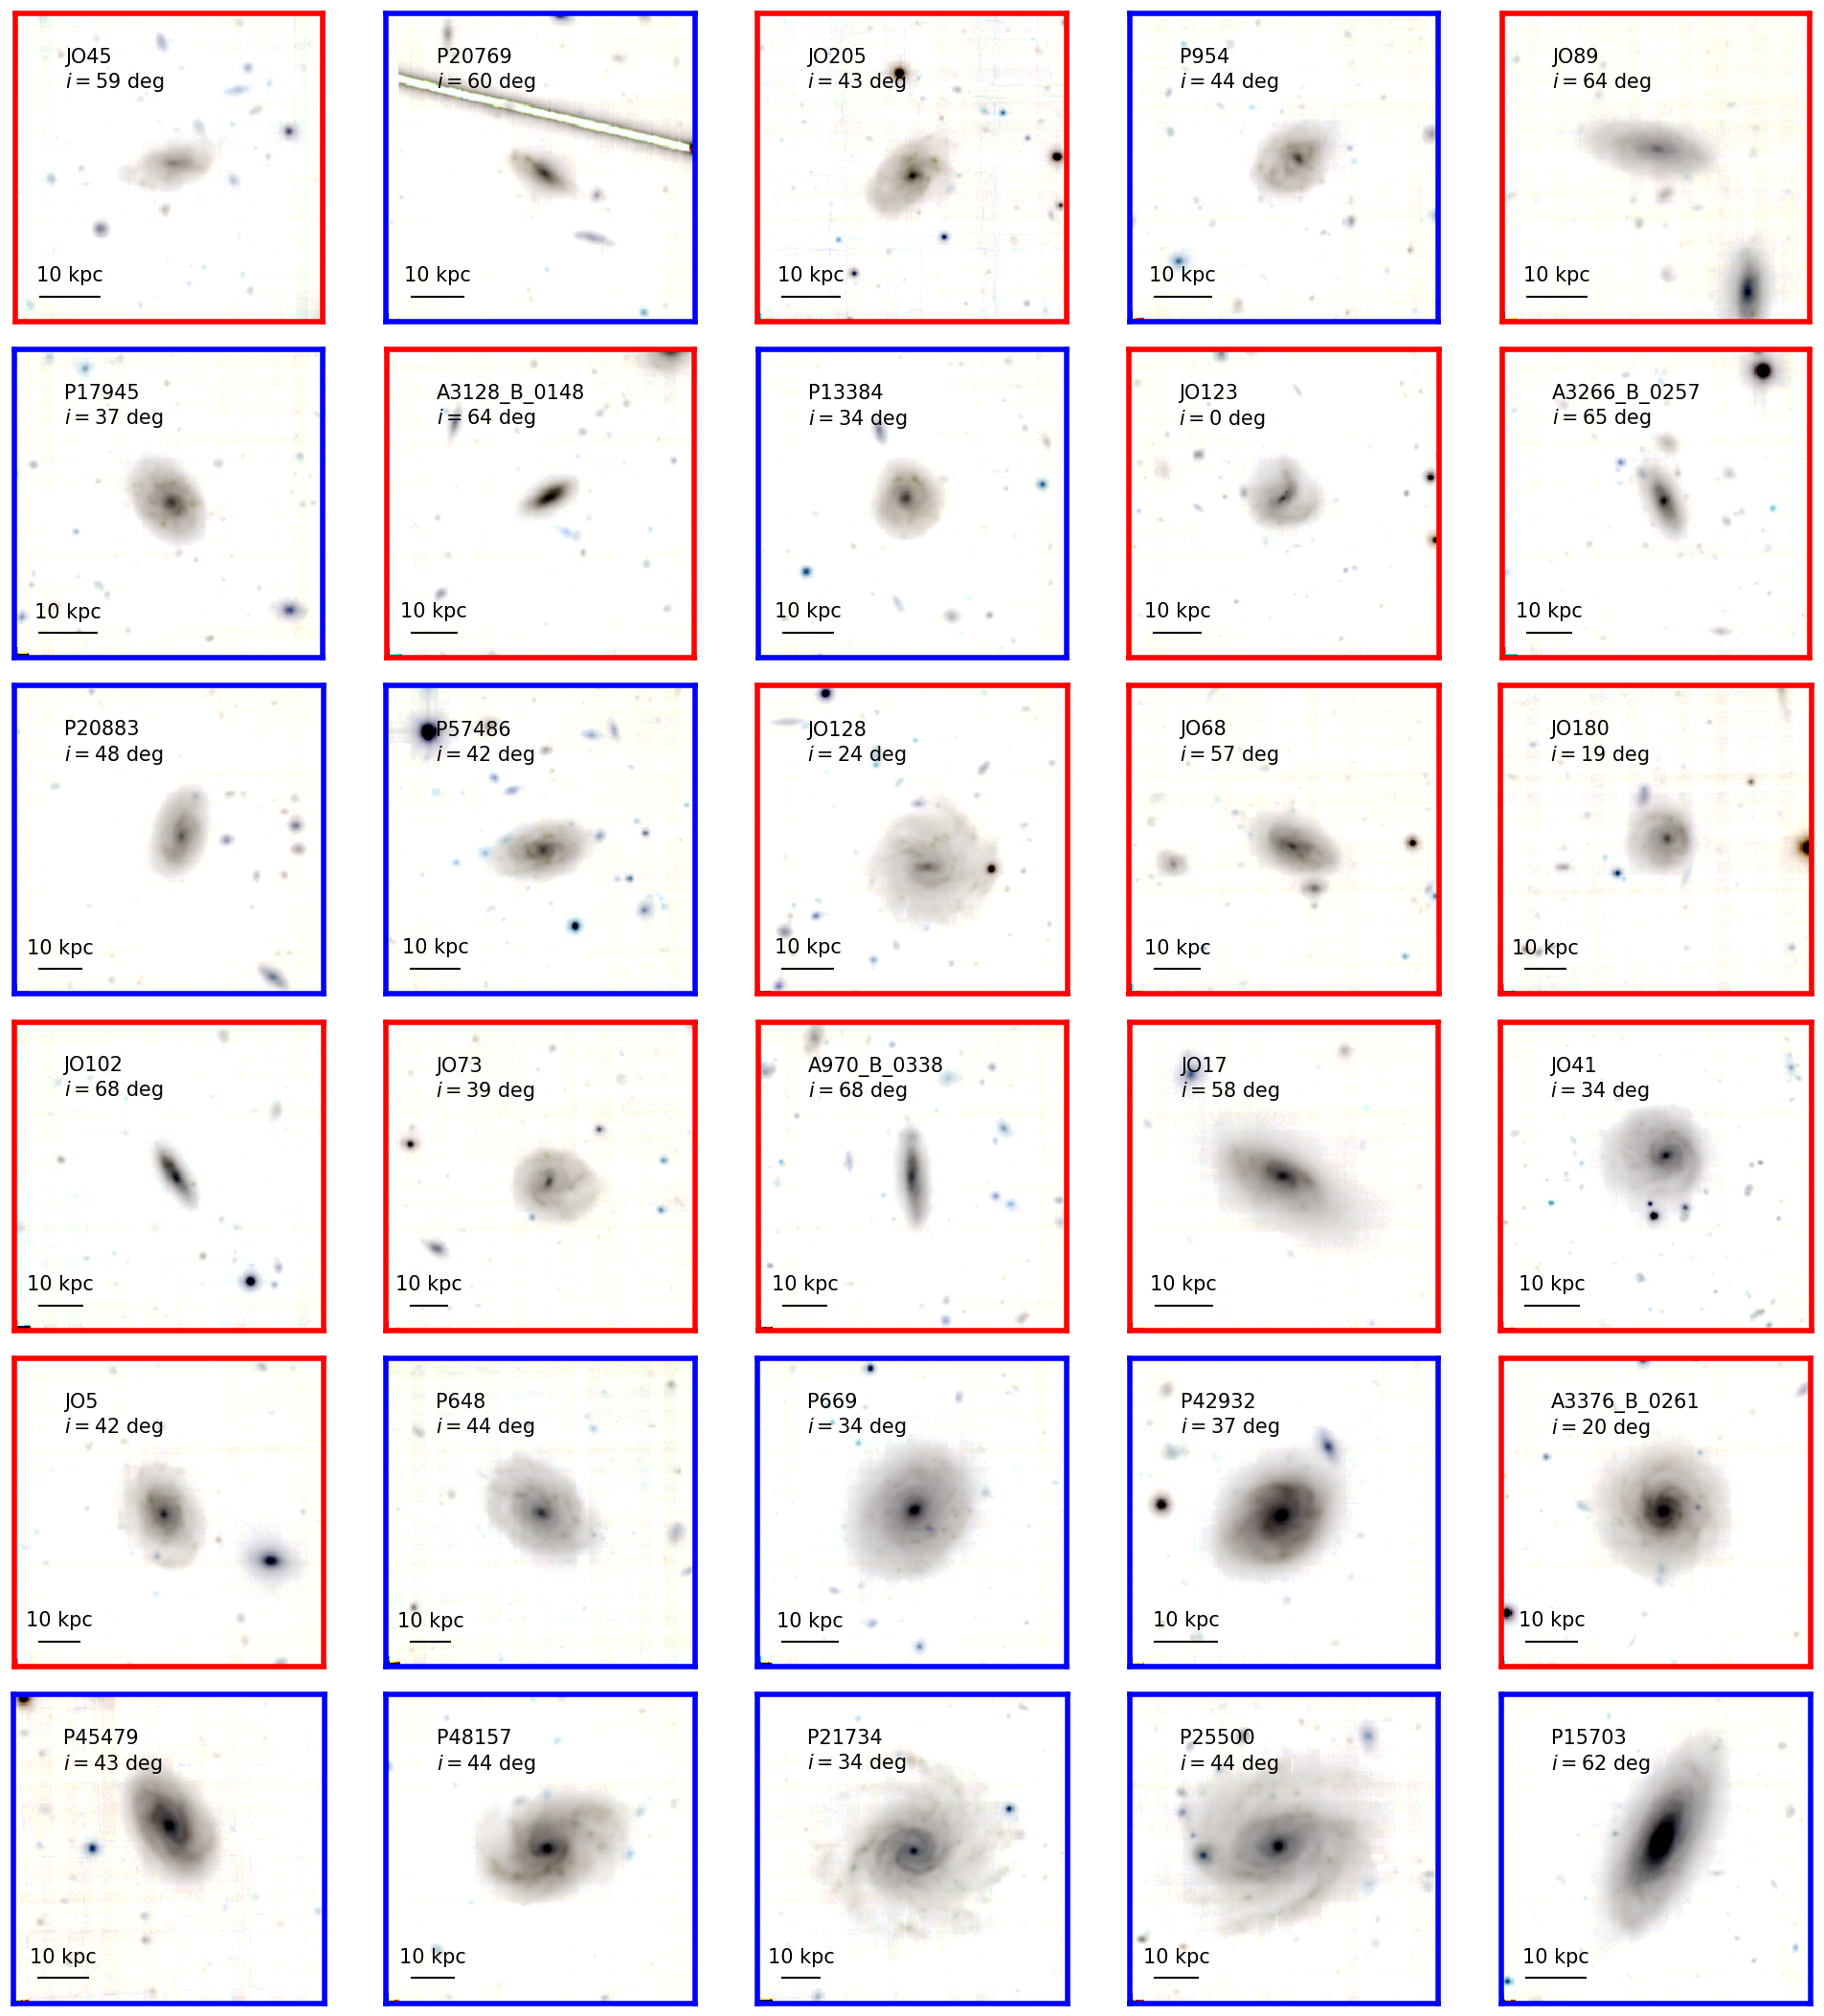
For this work we exploit the control sample selected in Vulcani et al. (2018, Paper XIV). They extracted from the cluster+field control sample those galaxies that indeed are undisturbed and do not show any clear sign of environmental effects (ram pressure stripping, tidal interaction, mergers, gas accretion…) on their spatially resolved star formation distribution, for a total of 16 cluster members and 14 field galaxies. We refer to Table 2 of Paper XIV for the list of the objects, along with redshifts, coordinates, integrated stellar masses and star formation rates. We remove from their sample JO93 and P19482 that, after a careful inspection of their H maps, turned out to be in an initial phase of stripping. Figure 1 shows the total stellar mass distribution of the galaxies entering the sample, while Fig. 2 presents an overview of the sample, sorted by increasing total stellar mass, and shows the colour composite images of the targets, obtained combining the reconstructed , and filters from the MUSE datacube. As galaxies are drawn from different environments, we highlight with a red square the galaxies belonging to the cluster sample, with a blue square those belonging to the field. This colour scheme will be adopted throughout the paper. Cluster galaxies are found at intermediate projected cluster centric distances, in the range 0.7-1.3 R200,
2.2 Data analysis
As extensively presented in Paper I, we corrected the reduced datacube for extinction due to our Galaxy and subtracted the stellar-only component of each spectrum derived with our spectrophotometric code sinopsis (Fritz et al., 2017). In addition to the best fit stellar-only model cube that is subtracted from the observed cube, sinopsis provides for each MUSE spaxel stellar masses, luminosity-weighted and mass-weighted ages and star formation histories in four broad age bins.
We then derived emission line fluxes with associated errors using kubeviz (Fossati et al., 2016), an IDL public software. We consider as reliable only spaxels with S/N(H)>5. H luminosities corrected both for stellar absorption and for dust extinction were used to compute SFRs, adopting the Kennicutt (1998a)’s relation: . The extinction is estimated from the Balmer decrement assuming a value and the Cardelli et al. (1989) extinction law. The MUSE data reach a surface brightness detection limit of and at the 3 confidence level (Paper I), which translate into a limit of .
We used the extinction also to derive the gas mass density, using the empirical relation discussed in Barrera-Ballesteros et al. (2018): . This relationship was calibrated using the observed gas mass density from spatially resolved observations of CO and the V-band attenuation for galaxies in the CALIFA EDGE survey (Bolatto et al., 2017).
We employed the standard diagnostic diagram [OIII]5007/ vs [OI]6300/ to separate the regions powered by star formation from regions powered by AGN or LINER emission. Only spaxels with an S/N3 in all emission lines involved are considered. We adopted the division lines by Kauffmann et al. (2003b). For the majority of the galaxies most of the H is powered by photoionization (plots not shown),and no galaxy in the sample hosts an AGN in its center. To compute SFRs, we considered only the spaxels whose ionised flux is powered by Star Formation.
As largely discussed by Poggianti et al. (2019, Paper XIII), the diagnostic diagram based on the [OI] is generally very sensitive to physical processes different from Star Formation, such as thermal conduction from the surrounding hot ICM, turbulence and shocks. Our choice to use the [OI]-based diagnostic diagram instead of other available line-ratio diagrams can therefore be considered as a conservative lower limit of the real star formation budget. Appendix A will discuss some results using the [NII]-based diagnostic diagram, for comparison.
For each spaxel in each galaxy we also computed the galactocentric radius fixing the centre of the galaxy to the peak of the stellar mass map. The radius is then expressed in units of , which is computed on I-band images by measuring the radius of an ellipse including half of the total light of the galaxy (Vulcani et al. 2019a - Paper XVI - and Franchetto et al. in prep.). We remind the reader that our observational strategy allows us to detect H also in the galaxy outskirts: 75% of the sample have a H coverage larger than 2.7. This maximum extension of the H disk in units of , is independent of stellar mass (plot not shown).
We correct all quantities for the effect of inclination. We note however that no edge-on galaxy is present in the sample: galaxies span the range .
3 Results
3.1 The - relation of all galaxies
The total integrated SFR- relation for the sample has been presented in Paper XIV,333Note that in Paper XIV we identified regions powered by star formation using the diagnostic diagrams based on the [NII] line rather than those based on the [OI] line. However, this choice does not affect the results, therefore we do not discuss again the global SFR- relation of the sample. here we focus on the spatially resolved relation.
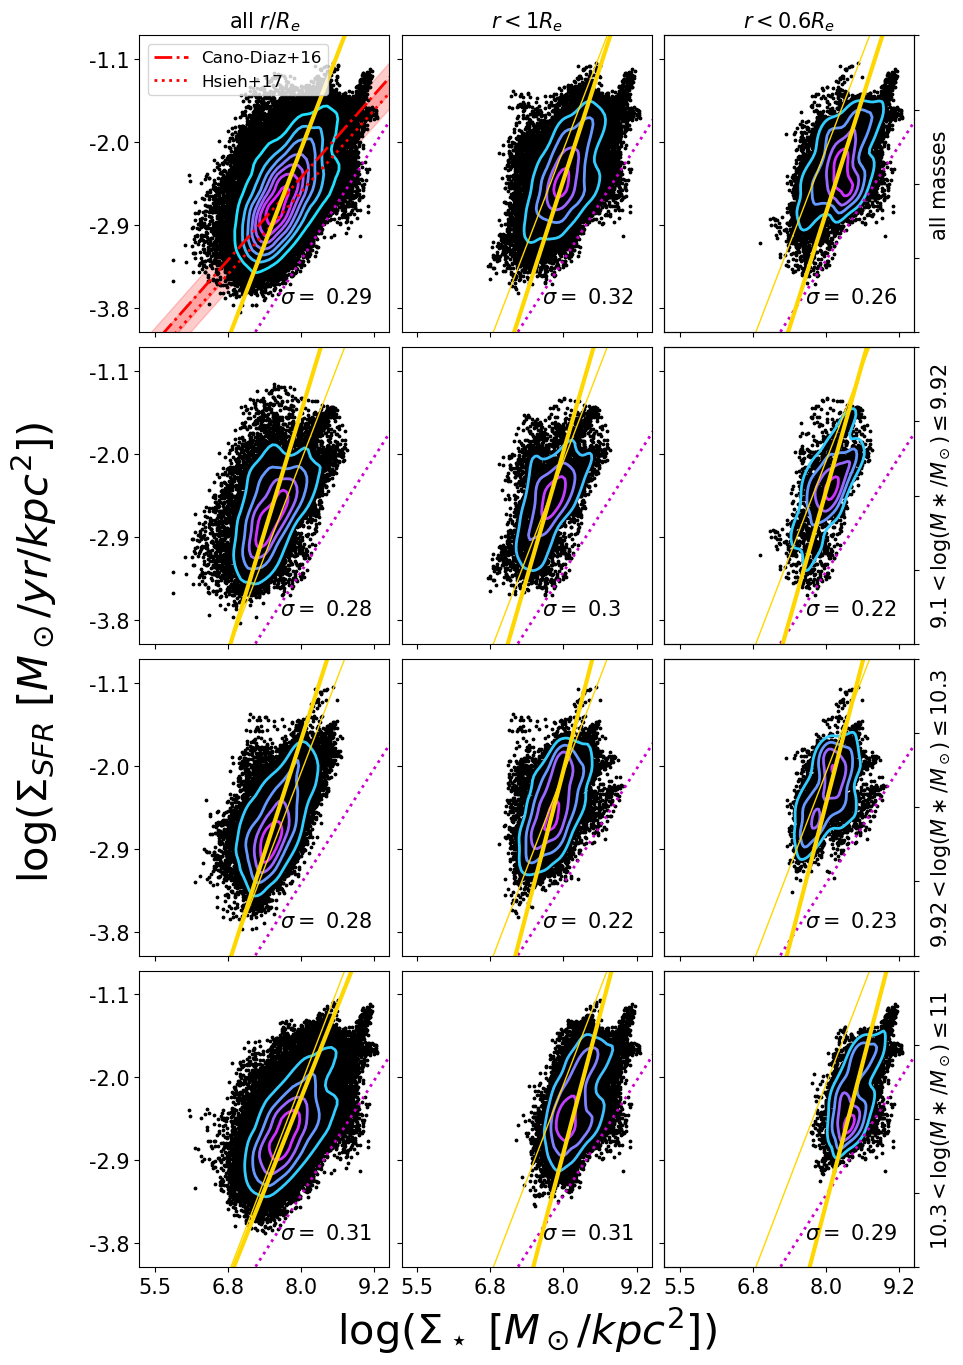
The upper left panel of Figure 3 shows the - relation, using all the 92020 star forming spaxels included in our sample. The effective threshold in spatially resolved specific SFR entailed by the adopted cuts in S/N corresponds to and it is also shown. By selection, 99% of the spaxels stay above the threshold. A correlation between the two quantities is immediately visible, with more massive spaxels typically having higher values of SFR, even though the scatter of the relation is quite large. To compute the scatter, we subdivided the sample in 10 bins and computed the standard deviation of in each bin separately. We then took the mean value as typical scatter, which turns out to be dex. The correlation spans almost five orders of magnitude in and three in .
We compare our results with those presented in Cano-Díaz et al. (2016); Hsieh et al. (2017). Both studies have highlighted that the - relation is rather tight, having a standard deviation of at most 0.2 dex, and has a slope of . Cano-Díaz et al. (2016) based their analysis on CALIFA data, and analysed 306 galaxies of all morphological types and environments, with inclinations , in the redshift range and in the mass range . The CALIFA observational strategy guarantees a coverage of the spatial extension of the galaxies up to 2.5 effective radii, and spatial resolution of 1kpc at the average redshift of the survey. To select regions powered by star formation, they used both the BPT diagrams based on [N II] and the WHAN diagram (Cid Fernandes et al., 2011) (EW(H) ).
The analysis by Hsieh et al. (2017) is based on MaNGA data. Their targets were selected to represent the overall galaxy population with stellar masses greater than at . 1085 non interacting galaxies entered their selection. The MaNGA observational strategy guarantees a coverage of the spatial extension of the galaxies up to 1-5-2.5 effective radii, and spatial resolution of 1kpc at the average redshift of the survey. To select regions powered by star formation, they used both the BPT diagrams based on [S II] and a modified version of the WHAN diagram (Cid Fernandes et al., 2011) (H)<-0.4 and EW(H)). To compute the fit to the relation, they applied the both the ordinary least squares method and the orthogonal distance regression.
Qualitatively, our relation, fitted with a linear least-squares regression, is much broader and steeper, having a slope of 1.560.07. Quantitative comparisons between ours and their analyses is not possible, as works did not specify the spatial extension coverage of the galaxies that entered their samples, nor the minimum and reached by their galaxies. In addition, different selection criteria have been adopted to select regions photoionised by star formation. All these aspects, along with the sample selection, analyzing method, fitting recipe and spatial resolution, play important roles in the determination of the slope of the fit. Overall, literature results range from 0.6 to (see also Sánchez, 2013; Wuyts et al., 2013; Abdurro’uf & Akiyama, 2017; Hsieh et al., 2017; Maragkoudakis et al., 2017).
To mimic the effect of the different spatial coverage on galaxies and different mass ranges probed, Fig. 3 also shows the - relation using only the spaxels within 1 and 0.6 , and in three different mass bins. It unveils that relations get steeper and shift to higher values when spaxels at large galactocentric distances are excluded from the fit, as shown by the position of the fitting line in Fig. 3. This is true both for the entire population and for galaxies in a given stellar mass bin. At each given galactocentric distance, the fit also shifts to higher values going from low to high mass galaxies. It appears evident that relations have smaller scatter when considering only central spaxels and less massive galaxies, even though the smallest scatter is always dex. Most of the spaxels with are found only in the external regions. Note that this is approximately the same radial regime where Erroz-Ferrer et al. (2019) found a break down of the relation, above which the relation is steeper and below which it is flatter.
Galaxy outskirts - most likely missed by previous larger surveys - might be subject to different physical processes and therefore follow less tight relations, broadening the overall trends.
It is also interesting to note that in the most massive bin there are hints for the coexistence of two parallel relations: one produced by the spaxels in the regions 0.6 and, shifted toward lower values, one produced by the spaxels in the intermediate regions (). This behaviour is not visible at lower masses. The highest mass bin includes galaxies more massive than , which is a well known discriminating value in galaxy evolution. Kauffmann et al. (2003a) were the first to show that galaxies less massive than this value have low surface mass densities, low concentration indices typical of discs and young stellar populations. More massive galaxies have high surface mass densities, high concentration indices typical of bulges, and predominantly old stellar populations.
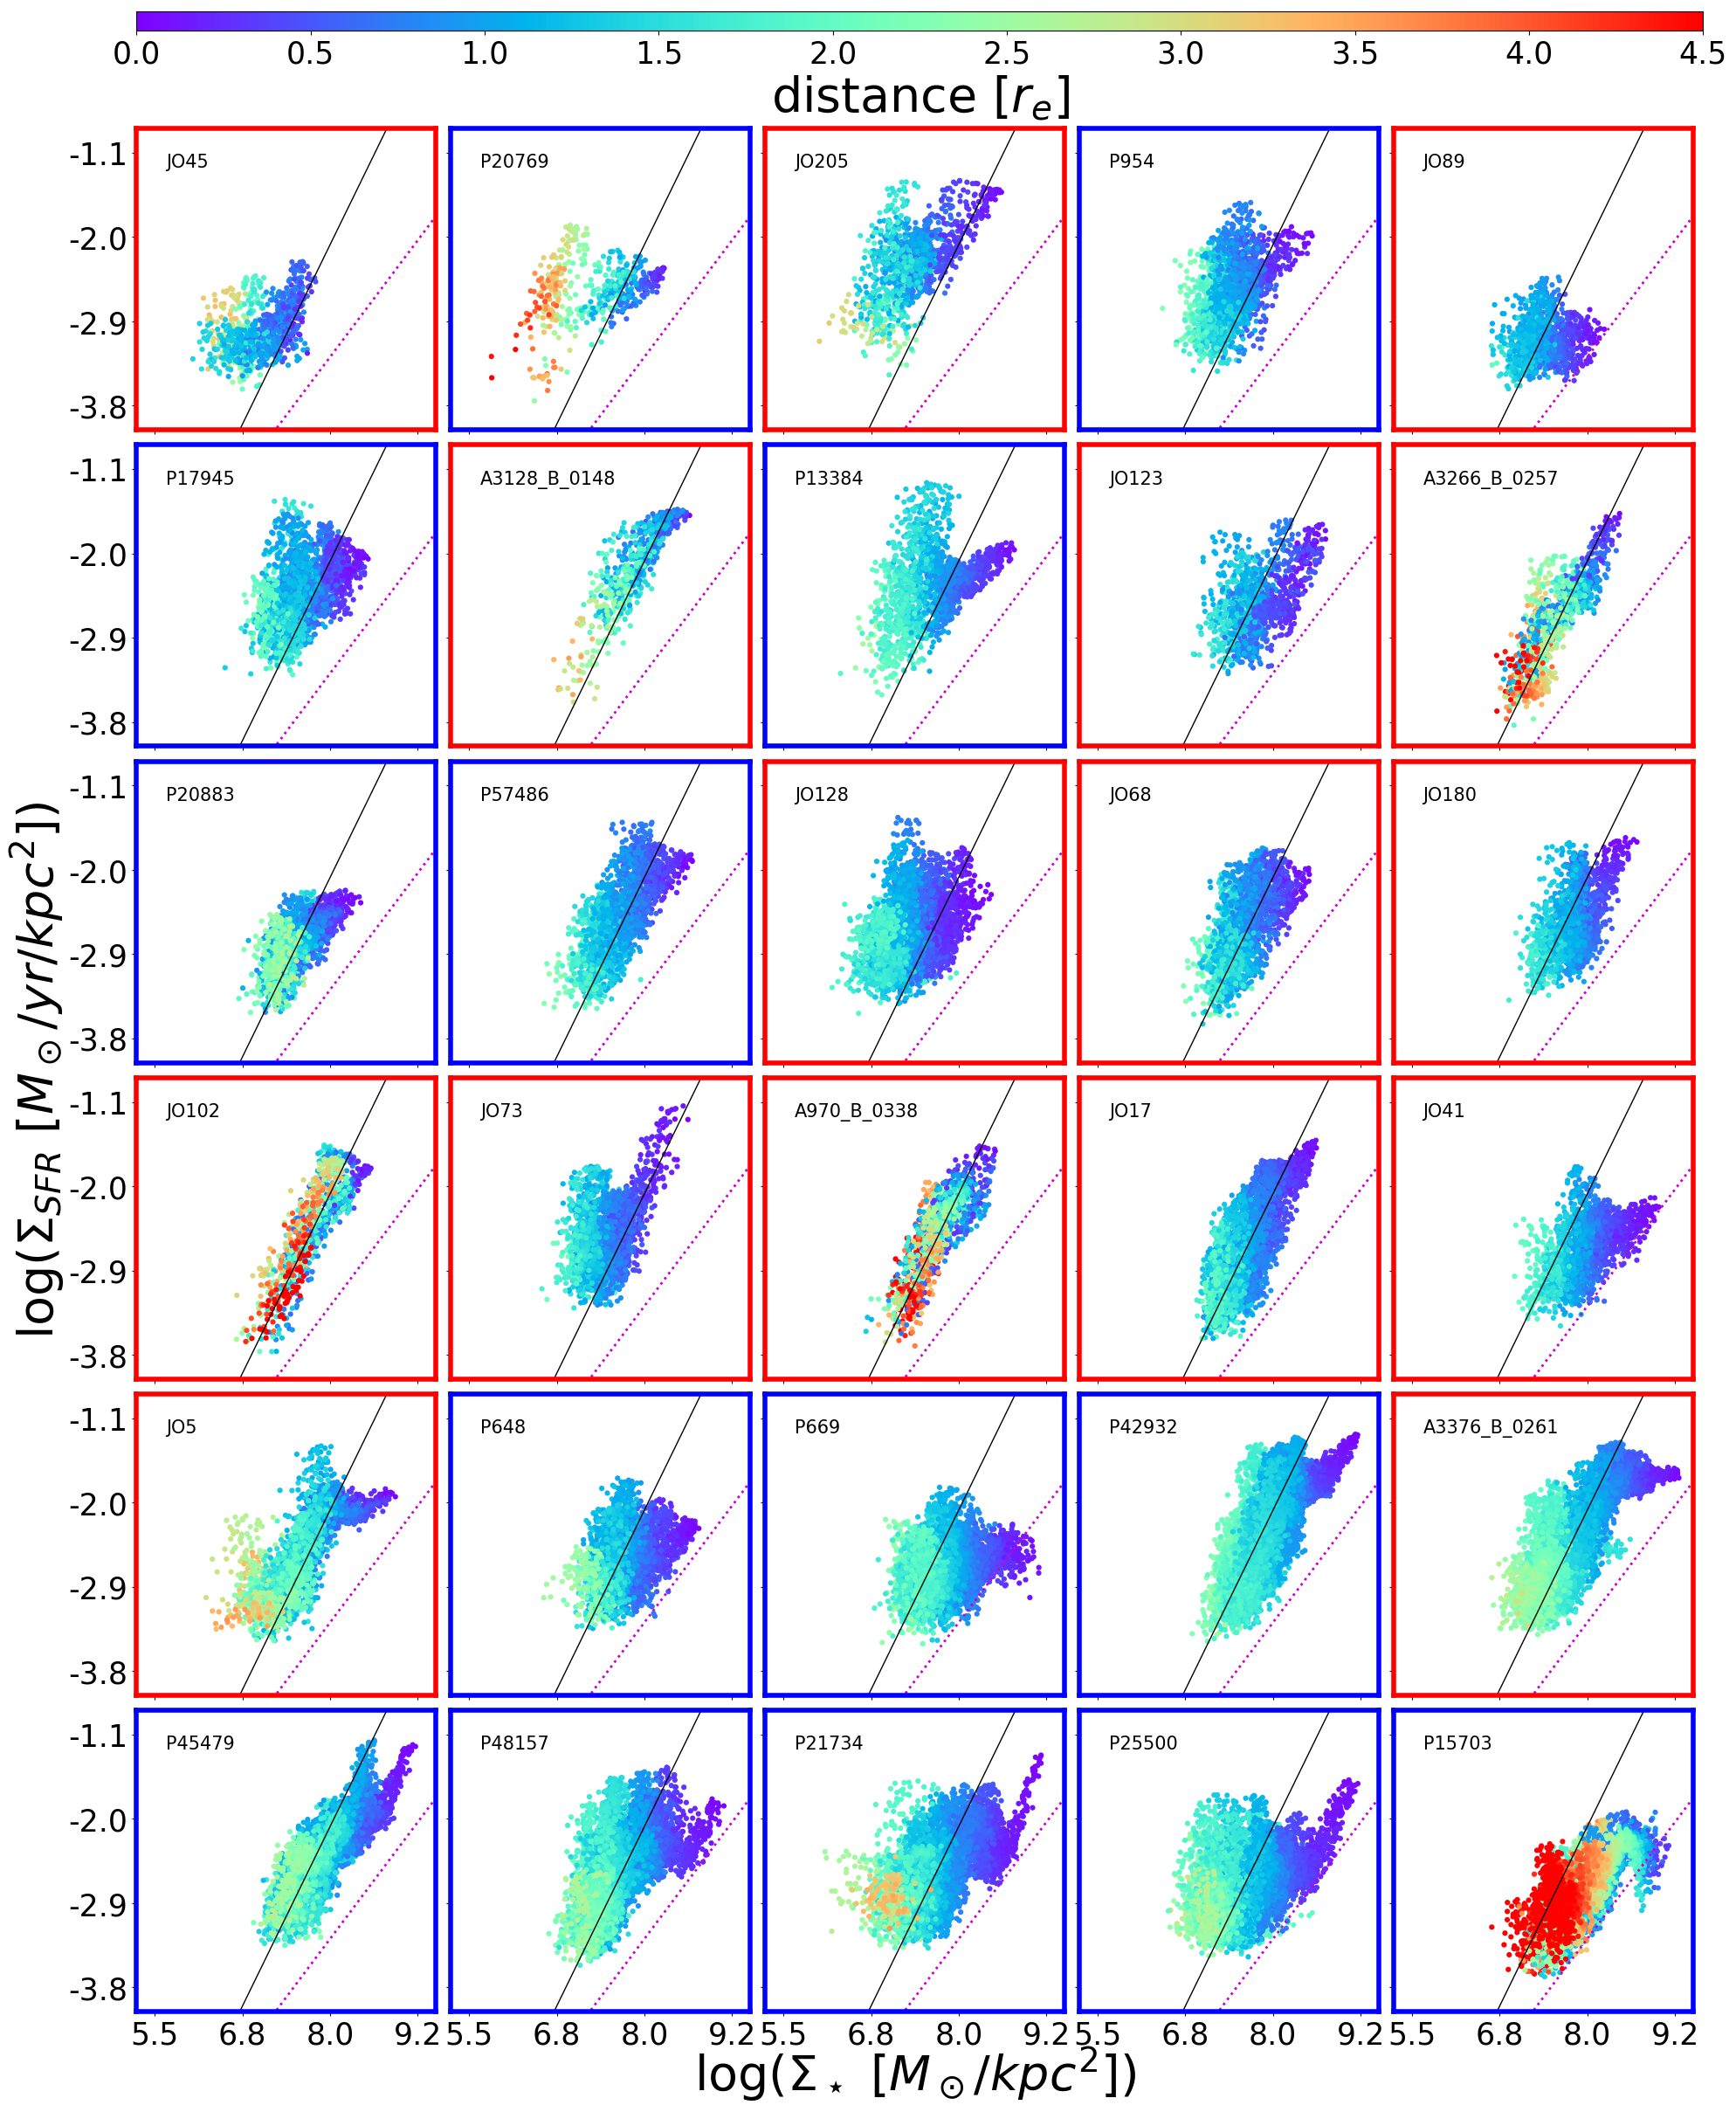
We note that, plotting at the same time all galaxies together, it is not clear whether they all follow similar relations or if each galaxy is characterized by a different slope, intercept, scatter. In the next subsection we therefore characterise each galaxy separately.
3.2 The galaxy-by-galaxy - relation
Figure 4 presents the - relation for each galaxy separately, distinguishing among spaxels at different galactocentric distances. It appears evident that, even though overall in most cases a correlation does exist, each object spans a distinct locus on the - plane (in agreement with Hall et al., 2018) and the relation that better describes it is characterized by a different slope and scatter. Table 1 presents the slope, intercept, coefficient correlation value (r_value), the scatter and the standard error of the estimate for each galaxy separately. Half of the sample has r_value, indicating there is no correlation between the and and suggesting that fitting relations is meaningless. Only 6/30 galaxies have r_value, suggesting a rather strong correlation. In all cases the p-value is close to zero, supporting the reliability of the results.
The slope of the relation for each of the individual galaxies is close to one, especially for those with the highest r_value, and even shallower when the correlation is weaker. The steep slope of the global relation (Fig. 3) is therefore probably a consequence of the different intercepts of the galaxies in the sample.
| ID | slope | intercept | r_value | std_err | scatter |
|---|---|---|---|---|---|
| A3128_B_0148 | 1.01 | -10.04 | 0.866 | 0.024 | 0.24 |
| JO102 | 1.2 | -11.67 | 0.852 | 0.025 | 0.27 |
| A3266_B_0257 | 1.05 | -10.6 | 0.833 | 0.023 | 0.28 |
| P45479 | 0.8 | -8.65 | 0.82 | 0.008 | 0.19 |
| A3376_B_0261 | 0.84 | -8.91 | 0.817 | 0.007 | 0.24 |
| A970_B_0338 | 1.06 | -10.62 | 0.815 | 0.023 | 0.23 |
| P15703 | 0.63 | -7.72 | 0.765 | 0.007 | 0.22 |
| JO5 | 0.76 | -8.25 | 0.763 | 0.012 | 0.21 |
| JO17 | 1.08 | -10.9 | 0.761 | 0.015 | 0.25 |
| P42932 | 0.91 | -9.47 | 0.745 | 0.009 | 0.23 |
| P57486 | 0.88 | -9.18 | 0.718 | 0.018 | 0.2 |
| P20883 | 0.62 | -7.43 | 0.653 | 0.016 | 0.22 |
| JO205 | 0.56 | -6.37 | 0.626 | 0.021 | 0.23 |
| JO68 | 0.8 | -8.67 | 0.617 | 0.023 | 0.29 |
| P21734 | 0.48 | -6.21 | 0.605 | 0.007 | 0.22 |
| P48157 | 0.61 | -7.12 | 0.595 | 0.01 | 0.26 |
| JO180 | 0.66 | -7.7 | 0.533 | 0.026 | 0.16 |
| JO41 | 0.44 | -6.13 | 0.525 | 0.016 | 0.21 |
| JO123 | 0.47 | -6.18 | 0.502 | 0.024 | 0.22 |
| JO73 | 0.57 | -6.77 | 0.471 | 0.024 | 0.33 |
| P954 | 0.51 | -6.33 | 0.466 | 0.022 | 0.28 |
| JO45 | 0.33 | -5.25 | 0.442 | 0.022 | 0.17 |
| P17945 | 0.45 | -5.82 | 0.435 | 0.019 | 0.28 |
| P25500 | 0.3 | -4.94 | 0.41 | 0.007 | 0.27 |
| P13384 | 0.34 | -4.93 | 0.378 | 0.021 | 0.25 |
| P648 | 0.33 | -5.11 | 0.347 | 0.015 | 0.19 |
| JO128 | 0.34 | -5.12 | 0.343 | 0.014 | 0.28 |
| P20769 | 0.18 | -3.9 | 0.323 | 0.024 | 0.21 |
| P669 | 0.15 | -3.83 | 0.22 | 0.009 | 0.23 |
| JO89 | 0.07 | -3.57 | 0.09 | 0.022 | 0.19 |
We note that masking the spaxels most likely located in the galaxy bulge - whose size has been obtained applying a 2D fitting on the i-band images (see Franchetto et al. in prep.)- does not affect the results. We therefore include them in the forthcoming analysis.
Some galaxies show quite elongated sequences (e.g. A3128_B_0148, P57486), while in some other cases a cloud rather than a sequence is observed (e.g. JO45, JO89). Few galaxies really show a flattening (A3376_B_0261, P669) or bending (P48157, P15703) of the relation at higher values. Note that this behaviour is not due to the presence of the bulge, as trends stay also when the contribution of the bulge is removed (plot not shown). Moretti et al. (in prep.) will provide a detailed description of these objects presenting anomalies in the central regions.
For some galaxies the scatter increases with decreasing (e.g. P25500), for some others different sequences coexist (e.g. P20769, P13384, JO5). Only a few galaxies show a really tight and unique sequence (e.g. A3128_B_0148, JO102, A970_B_0338). The latter are all in clusters. Apart from that, no other outstanding environmental effects are evident. This result is somehow expected, given that the cluster members in the control sample most likely just entered the cluster environment from the field and have had not time yet to feel cluster specific processes. This is confirmed by the location in projected phase-space (plot not shown): their cluster centric distribution spans from 0.7 to 1.3 , and their relative velocities are within <2, where is the galaxy velocity with respect to the velocity of the cluster and is the velocity dispersion of the cluster, consistent with the fact that they have not approached yet the cluster center.
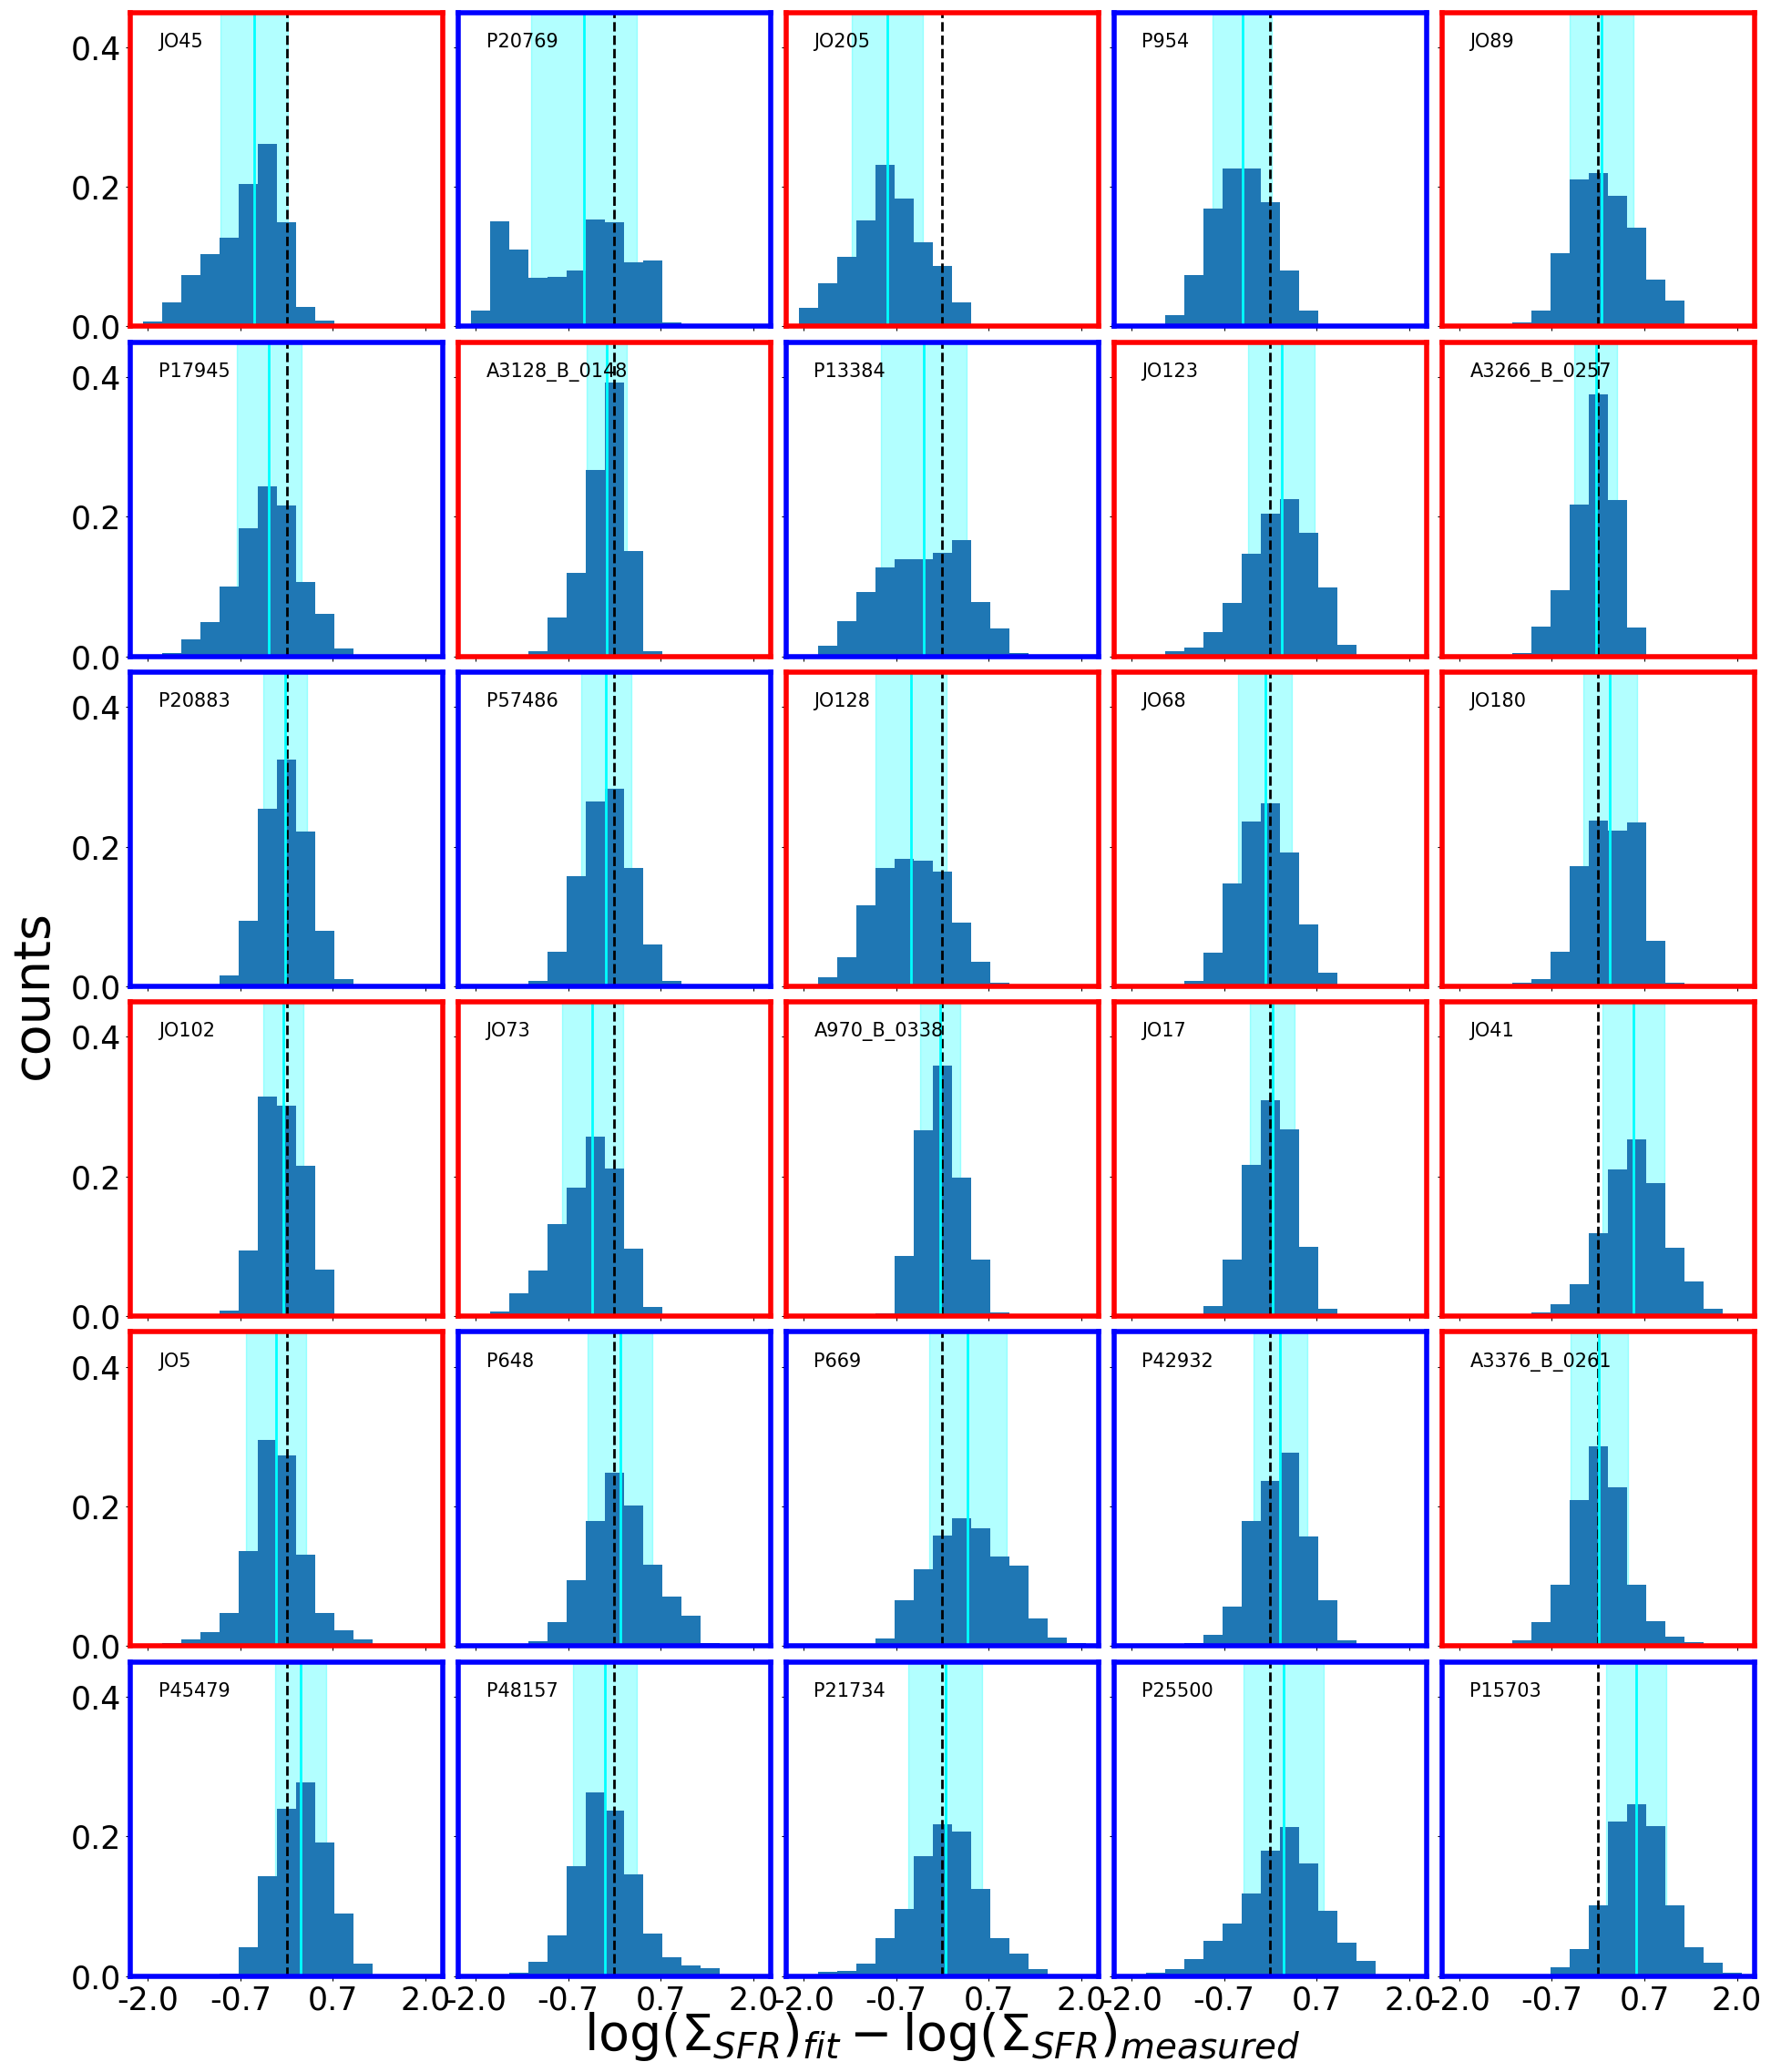
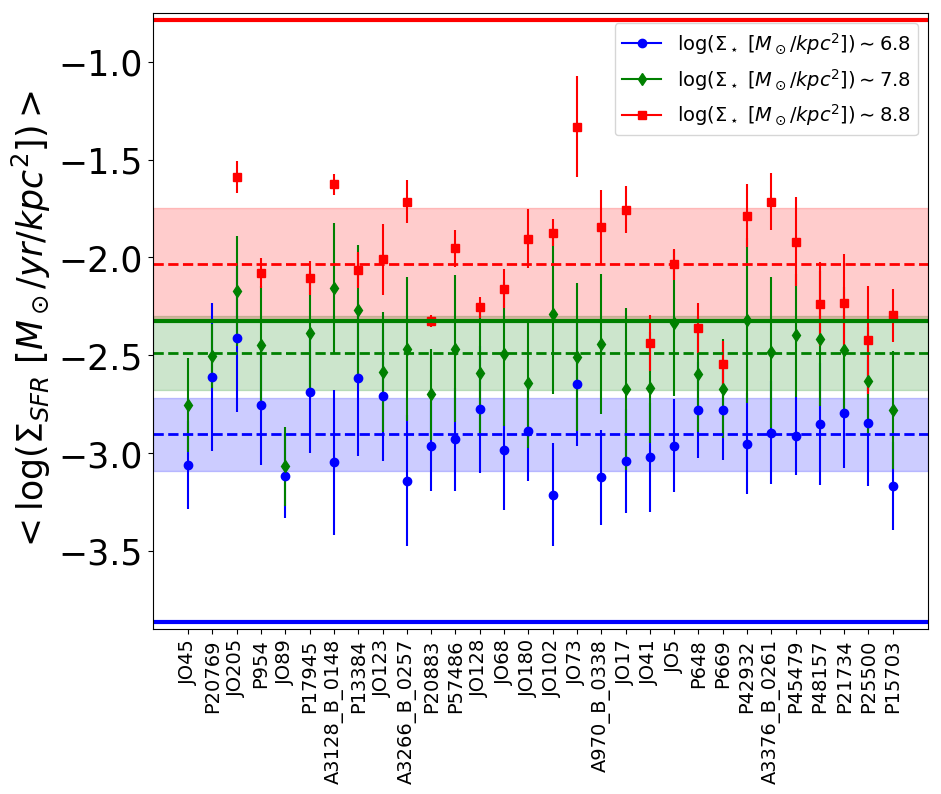
To better highlight the galaxy- by-galaxy variations with respect to the relation obtained considering all galaxies together, for each galaxy we compute the difference between the galaxy and their expected value according to the fit to the entire sample (Fig.3), given their . Figure 5 shows the distribution of these differences for each galaxy separately. If a galaxy had the same - as the entire sample, the median value of the distribution would be 0 (marked by a black line in the plot). In each panel, the cyan line shows the median of the distribution and in many cases it coincides with the black line (e.g. JO17, JO68, A3376_B_0261). In contrast, for some galaxies (e.g. JO45, JO41, JO205, P15703), the median of the distribution is significantly different, suggesting that the - of the galaxy significantly deviates from the total one. In addition to the median values, also the shapes of the distributions give important information: while in some cases they are quite narrow (e.g. A970_B_0338, A3128_B_0148), in many other cases they are broad (e.g. P13384), show asymmetric tails (e.g. JO45) and are even double peaked (e.g. P20769). These results highlight that no a universal - relation exists for the galaxies.
Figure 4 also allows to inspect the position of each spaxel with respect to the galaxy center. Considering galactocentric distance, we find that spaxels in the external regions are characterised by systematic lower values, and spaxels at similar distance in terms of are distributed in the - plot on almost vertical relations, suggesting that the correlation between and distance might be stronger than and . Nonetheless, if we contrast the and distance, we find relations as broad as those presented in Fig. 4, having a similar scatter (plot not shown).
To better characterise the galaxy-by-galaxy variations, we consider separately the spaxels in three equally spaced mass density bins, centered at , , , and compute the median along with the scatter, measured as one standard deviation. The left panel of Fig. 6 shows these values for each galaxy separately, sorted by increasing total stellar mass. The scatter ranges from 0.2 to 0.3 dex in the three bins. Even though almost all the plotted points agree within the errors with the median values, this Figure shows again that each galaxy is characterized by a different slope and scatter in the - relation. In addition, it appears evident that while at intermediate values of galaxies have values similar to what expected from the total fit, both at low and high values they strongly deviate from it, being systematically higher and lower, respectively.
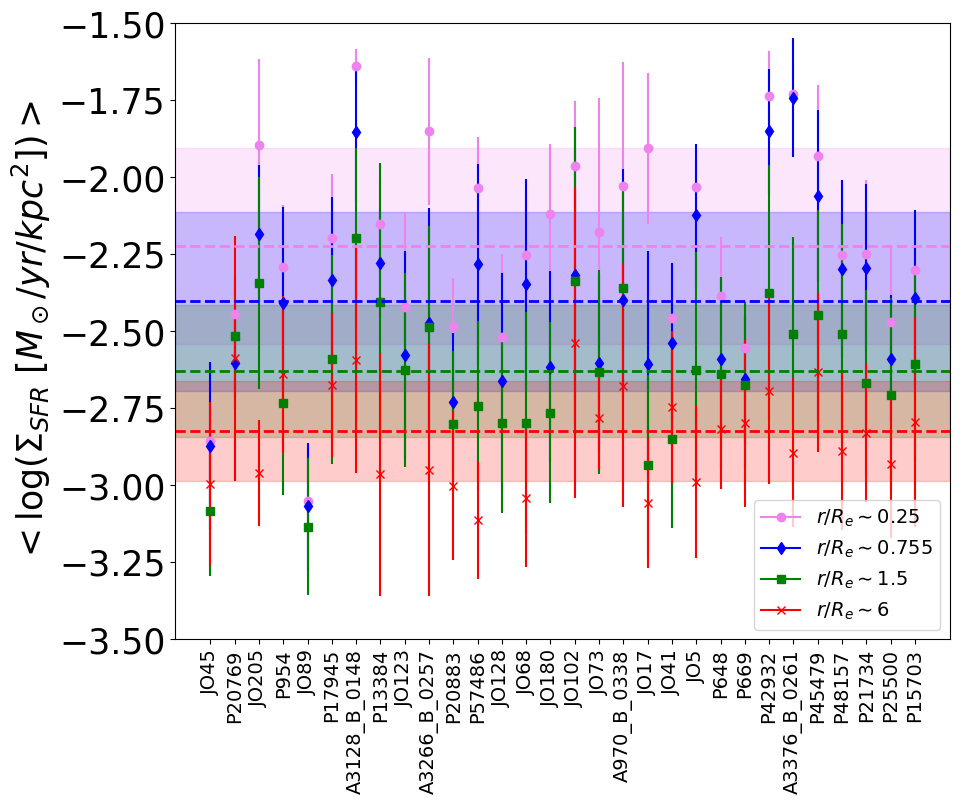
The right panel of Fig. 6 shows the median along with the scatter of the spaxels in four different galactocentric distance bins. The galaxy by galaxy variation is outstanding, especially for r/r1, suggesting that regions characterised by high values of star formation can be present at different distances in different galaxies. The scatter is always large, ranging from 0.15 to 0.35 dex. In the next section we will focus on these off-center star forming regions.
Taken together, Figures 4 and 6 indicate that variations are evident not only among different galaxies, but also among regions within galaxies (defined according to galactocentric distance, or ), implying that there is no “universal" relation between and .
We note that we have investigated whether the magnitude of the scatter depends on a number of global parameters, namely the total stellar mass, the SFR, the - i.e. the differences between the galaxy SFRs and their expected value according to the fit of the SFR- relation, given their mass (Paper XIV), the galaxy inclination, the number of knots, the SFR in the knots, the SFR in the knots divided by the total stellar mass, the effective radius, but found no statistically significant trends. Appendix B better discusses this point.
3.2.1 Star forming knots and diffuse emission
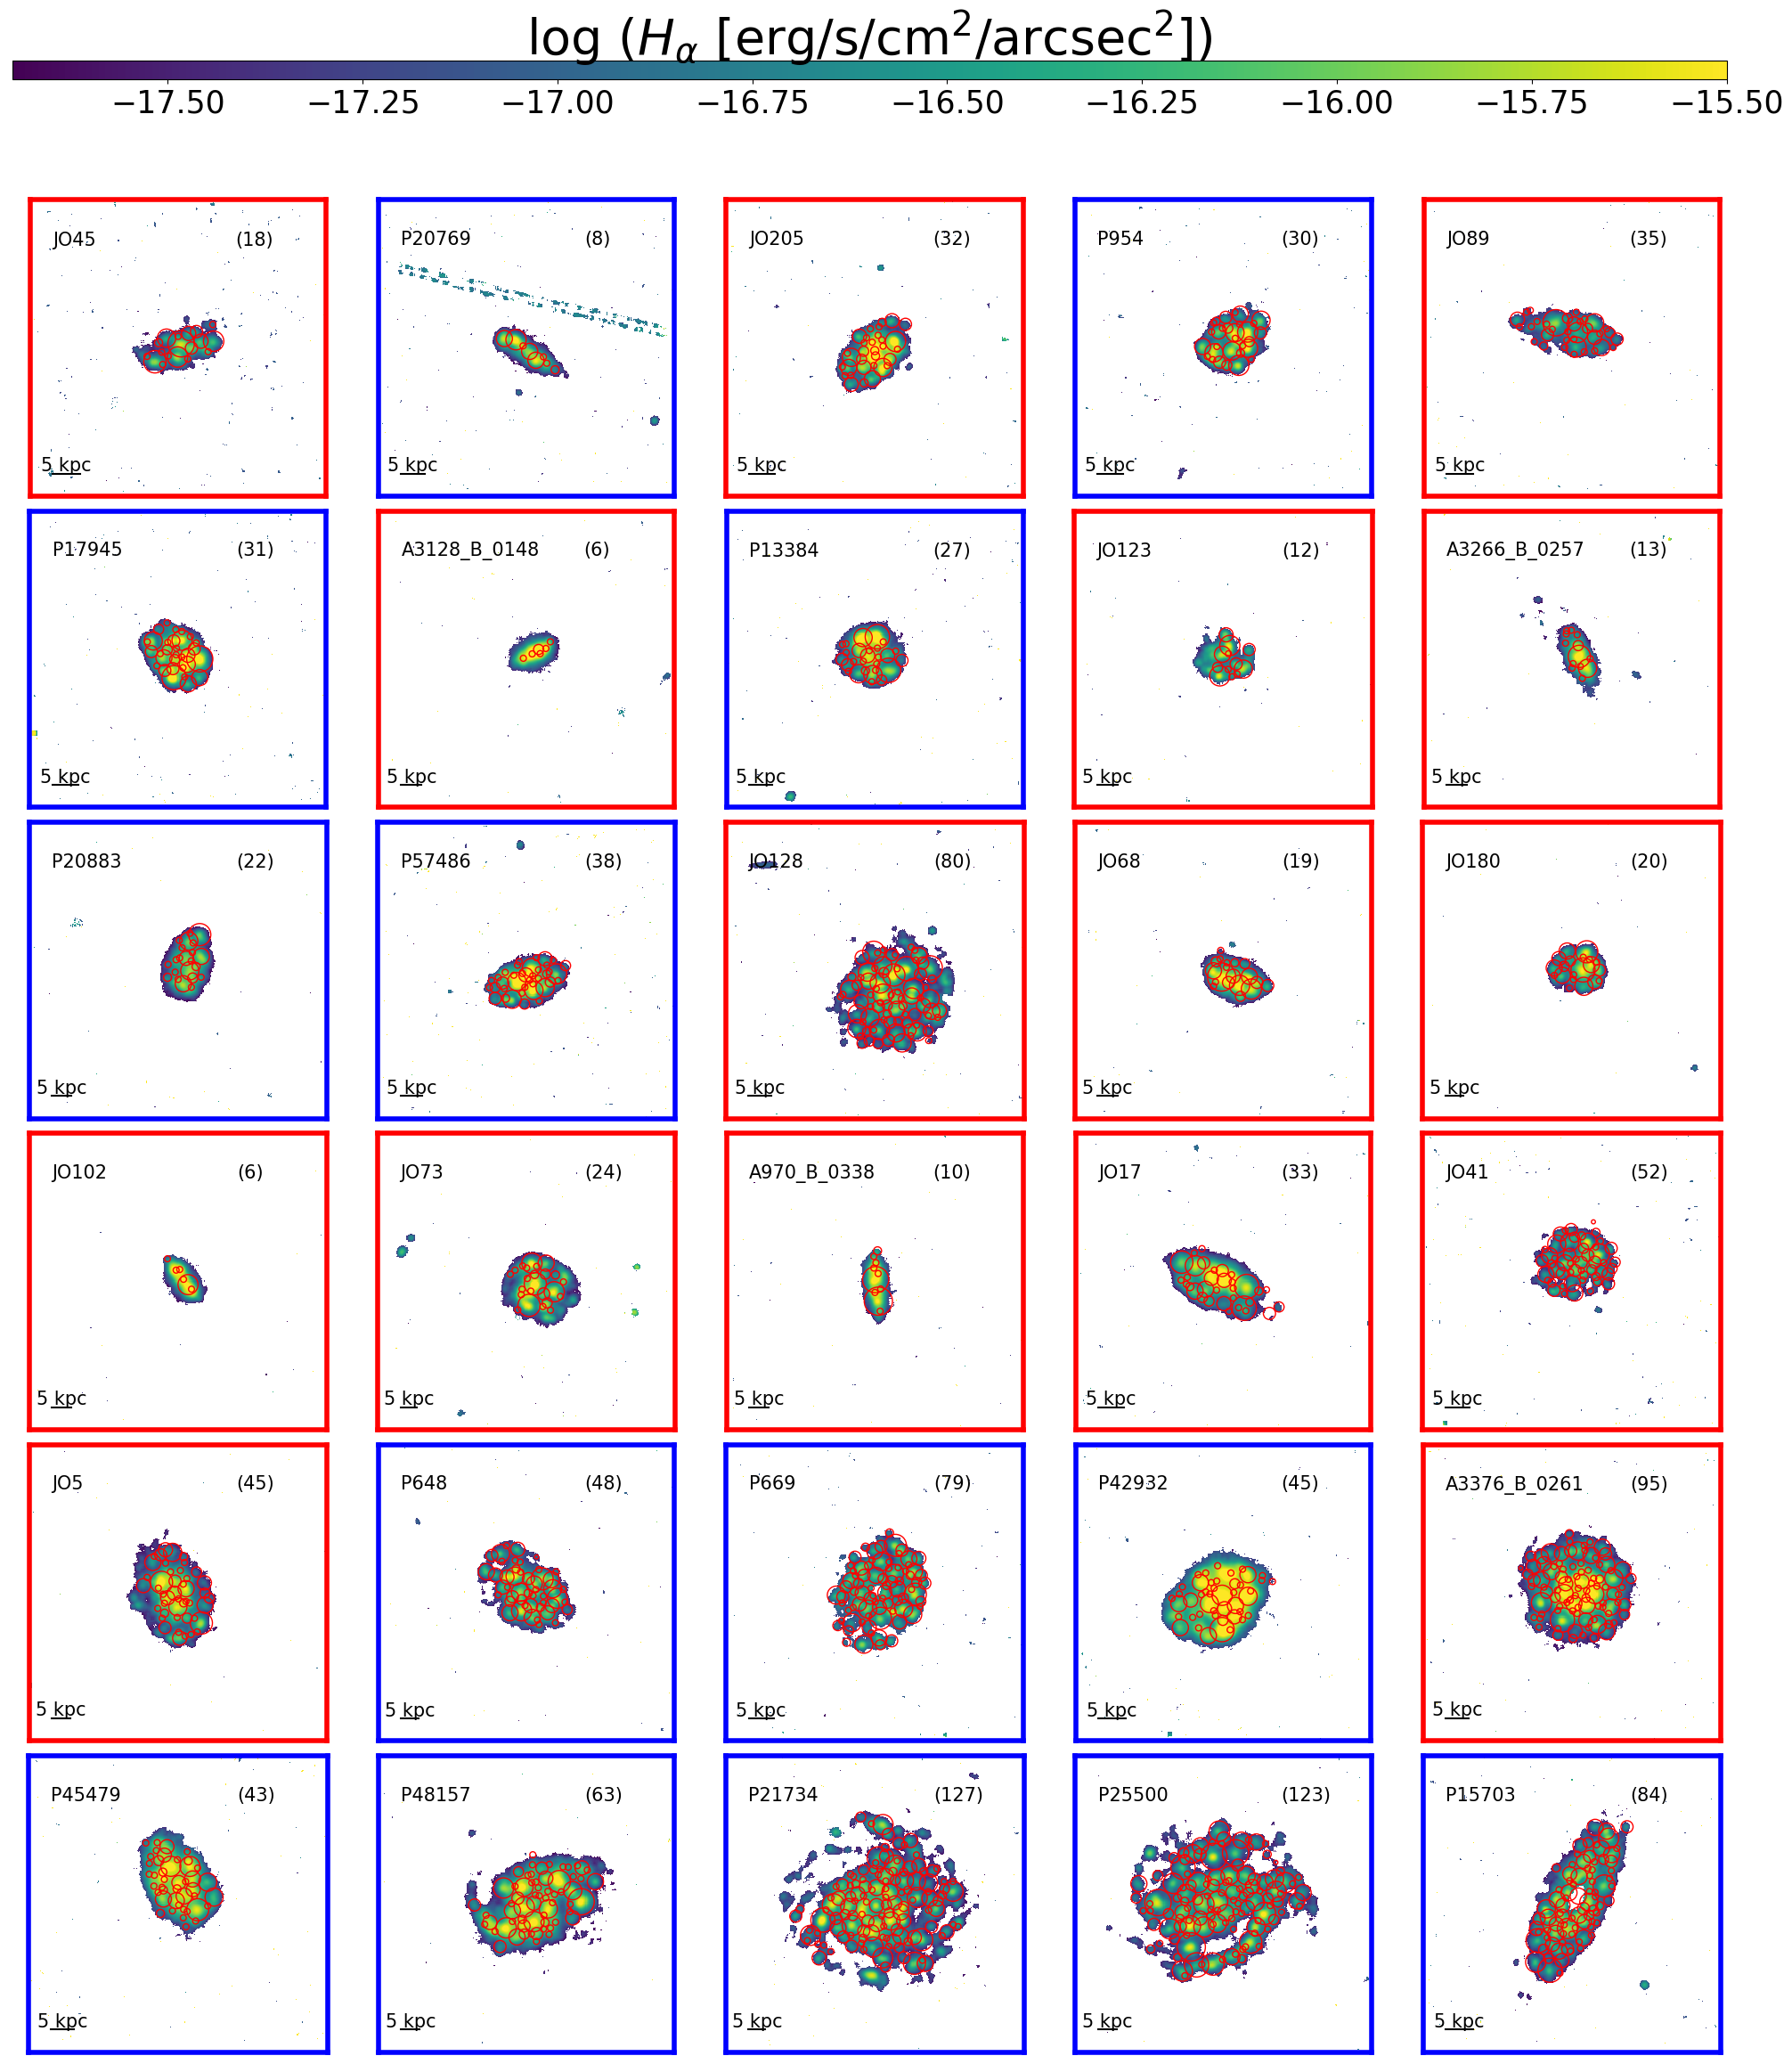
There are several parameters that might drive the - relations. One of these is the presence and spatial distribution of concentrated star forming regions, spread throughout the galaxy disk. Indeed, Figure 7 shows that the all galaxies present bright H knots with H surface brightness typically between . As discussed also in \al@Poggianti2017a, Poggianti2019; \al@Poggianti2017a, Poggianti2019, these are star-forming clumps embedded in regions of more diffuse emission. Paper I describes in detail how these clumps are identified. Briefly, a shell script including IRAF and FORTRAN routines has been developed. The script searches the local minima of the laplace + median filtered H MUSE image. The boundaries of these clumps (i.e. their radius, having assumed circular symmetry) is estimated considering outgoing shells until the average counts reach a threshold value that defines the underlying diffuse emission.
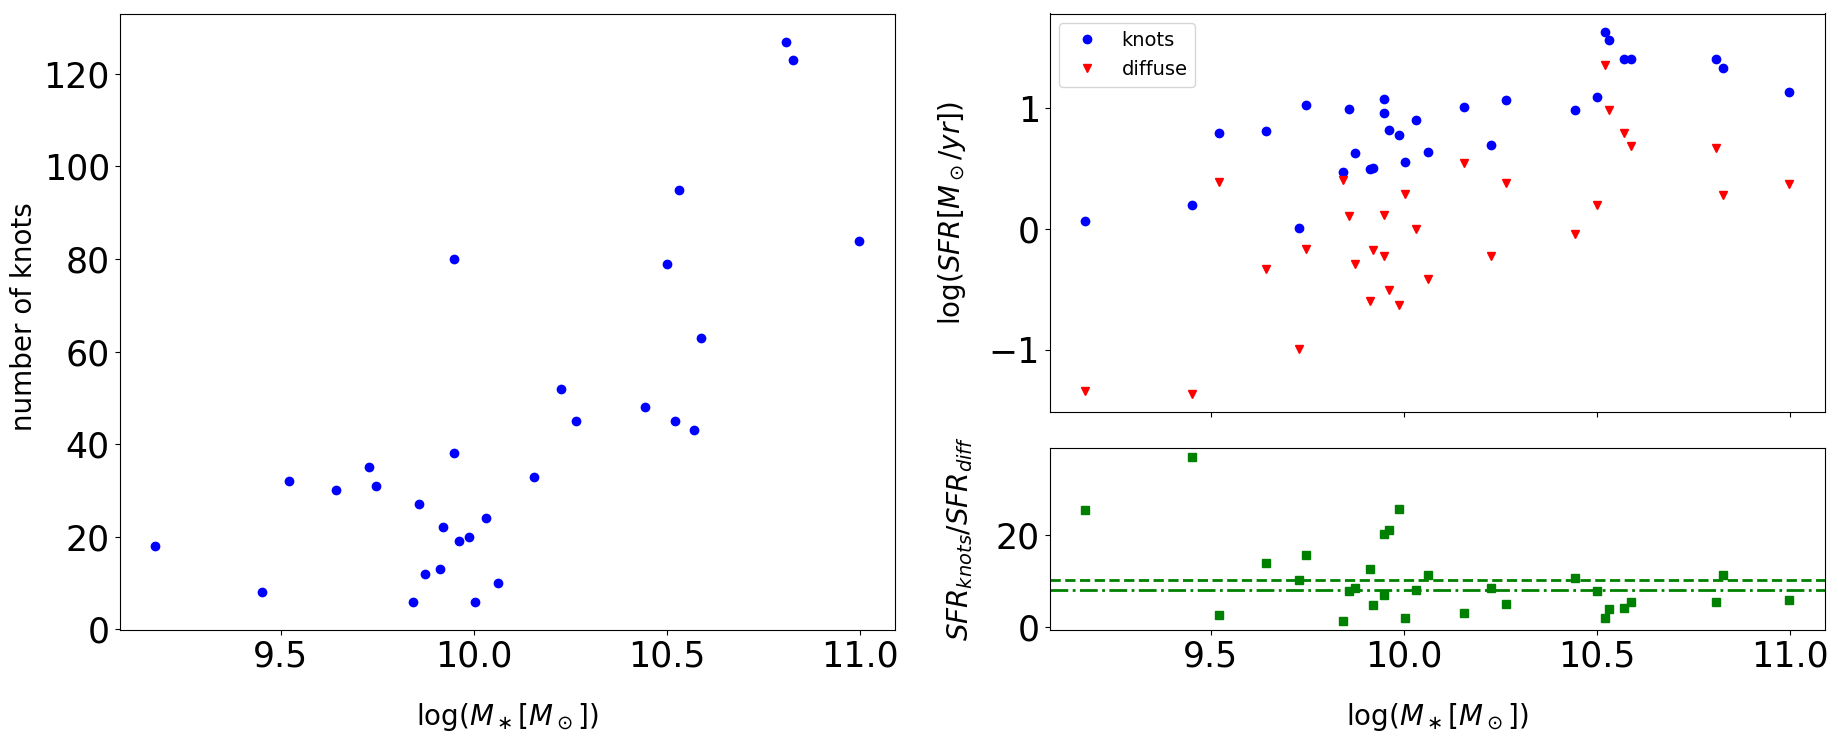
Both the number of knots and the total SFR in these knots are somehow correlated with the total mass of the galaxy, even though a quite spread exist, as shown in Fig. 8 (see also Paper XIII, ). The more massive the galaxy the higher the number of knots. The right panel of the Figure shows that the SFR in the knots is systematically higher than the SFR in the diffuse component, on average by a factor of .
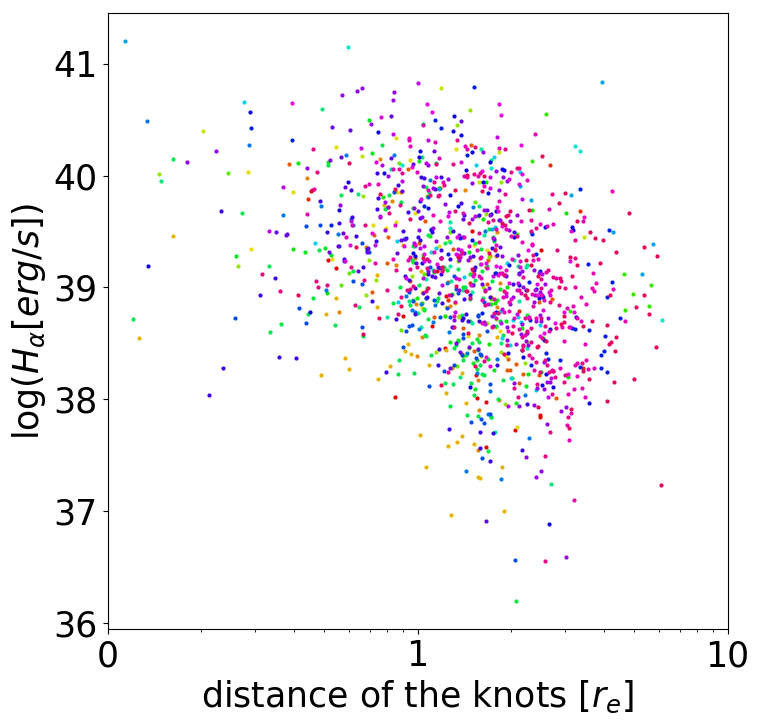
Figure 9 shows the H luminosity of the knots as a function of the galactocentric distance in units of , for each galaxy separately. Even though an overall anticorrelation exists, with more distant knots being less H luminous (and therefore less star forming), the relation spans over three orders of magnitude at a fixed galactocentric distance, showing how knots at the same galactocentric distance can have systematically different star forming properties.
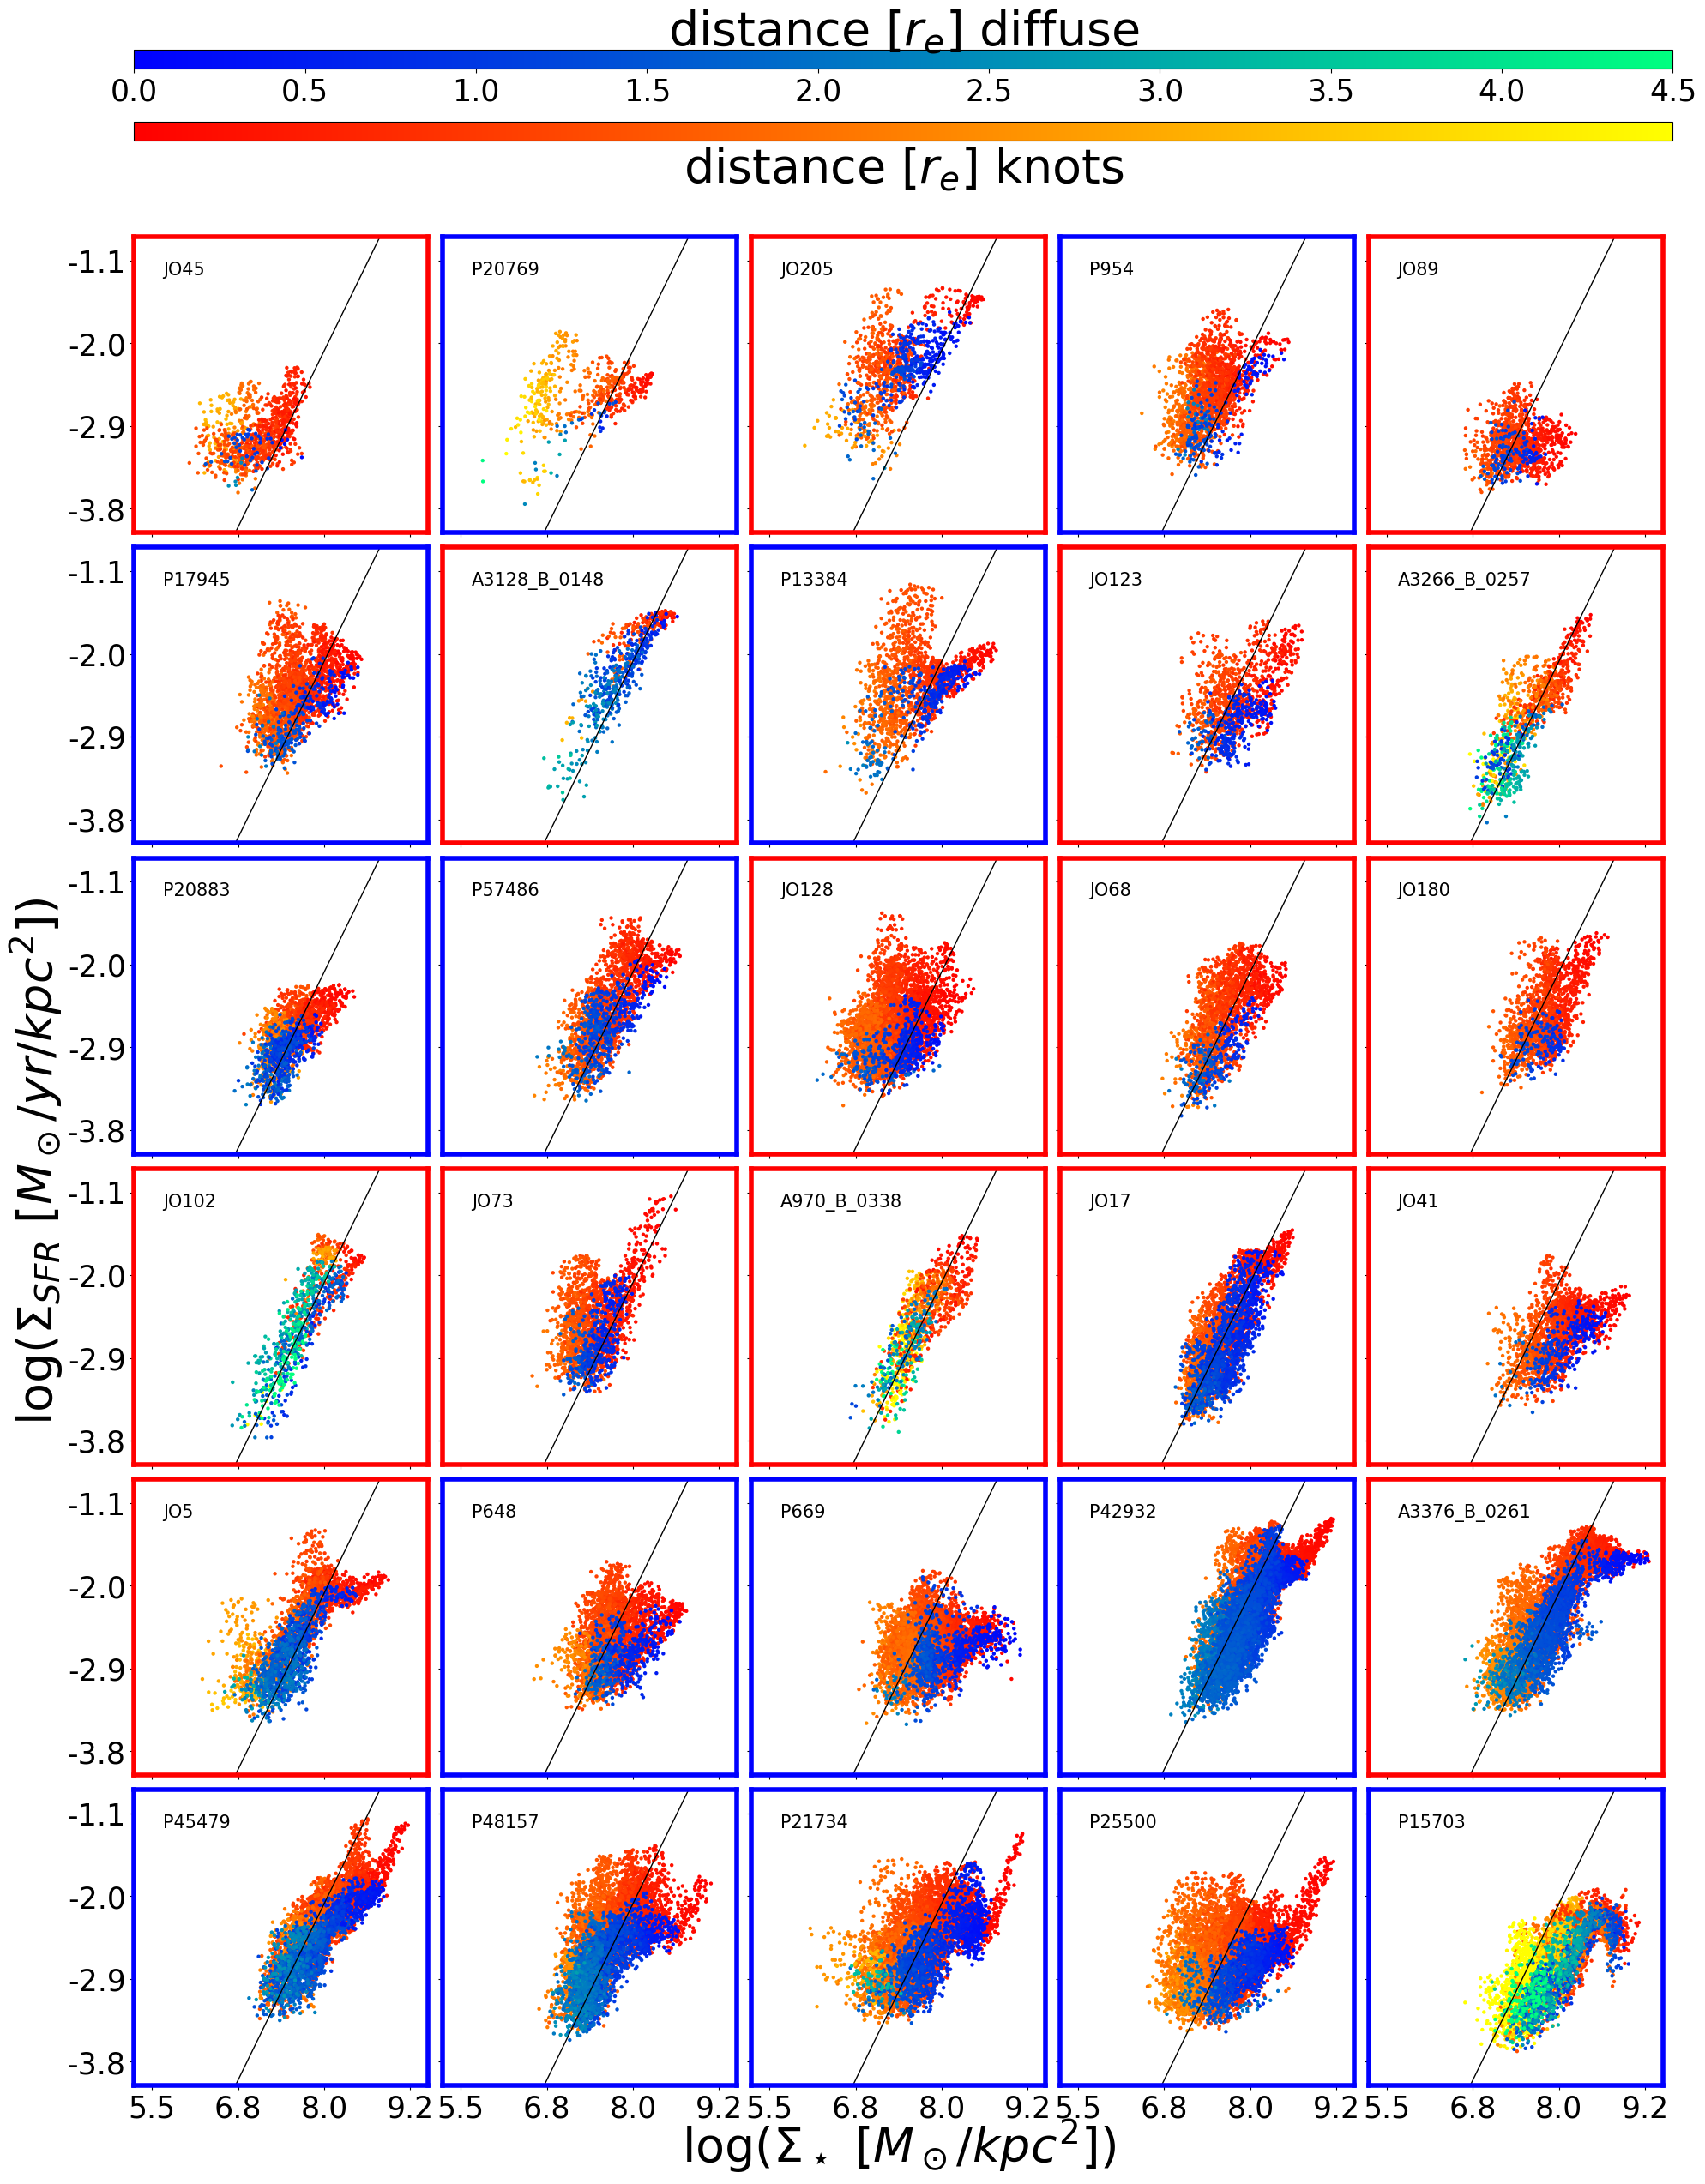
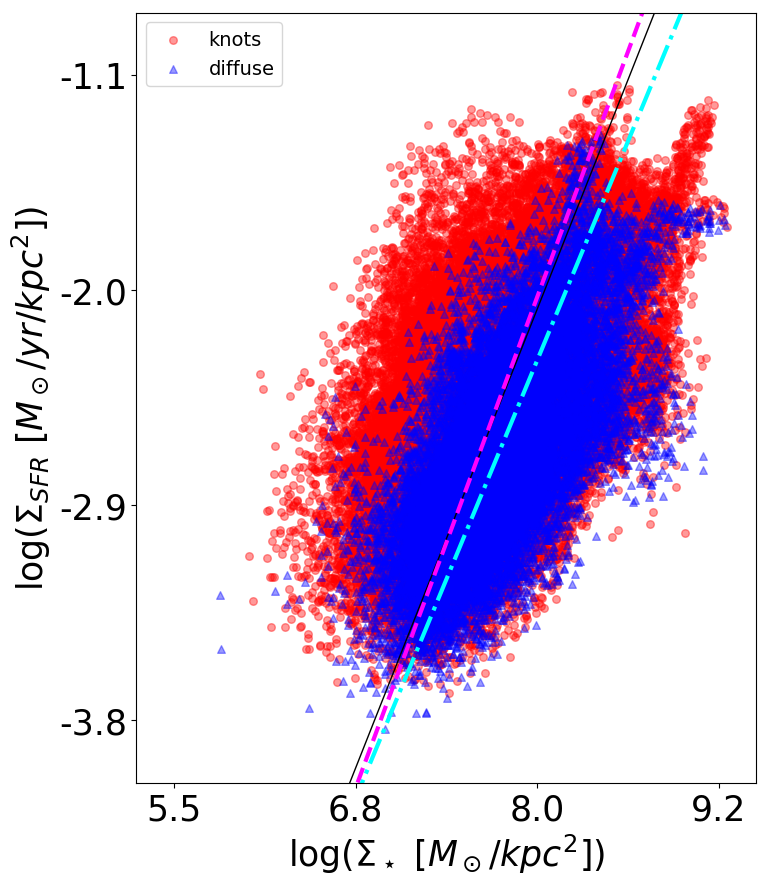
Figure 10 shows the same relation shown in Fig.4, but using different colour scales for spaxels in the knots and in the diffuse component: spaxels belonging to the bright knots are plotted using a red-yellow colour scale, spaxels belonging to the diffuse component are plotted using a blue-green colour scale. In total, 69861 of the spaxels belong to the knots, the remaining 22159 spaxels to the diffuse component. It is immediately clear that the - relations for spaxels within the knots are very broad: at any given a large range of values can exist. In addition, there is not always a tight correlation between galactocentric distance, and in the knots: highly star forming knots are not only present in the center of the galaxies and they not always take place in the highest surface mass density regions. The multi-sequences visible in the plots are due to highly star forming knots distributed at different galactocentric distances, even at low surface mass densities. Note that if we reduced the size of the knots by half, to overcome the issue of their external regions being influenced by the diffuse component due to the size of the PSF, we obtain the same result.
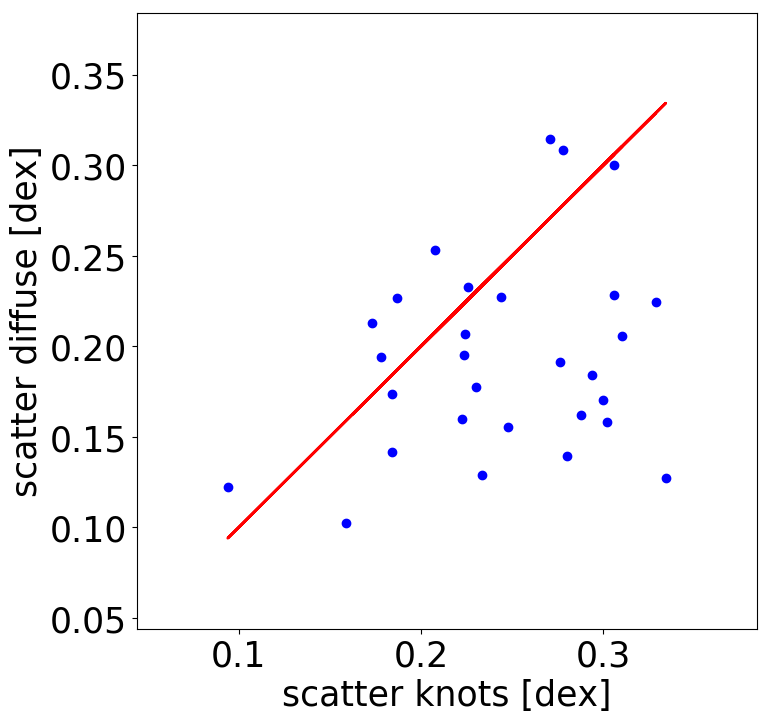
In contrast, relations for the diffuse component are much tighter, though still a broadening of the relations is visible for some cases. This is even clearer in Fig.11, where all galaxies are plotted together. It is interesting to note that, even though the scatter is much larger for spaxels in the knots than for the diffuse component, the slope and intercept of the relations are remarkably similar. We note that this result is not driven by the larger number of spaxels in the knots: we randomly extracted from the knots sample 10 subsamples with the same number of elements as the diffuse sample, finding the same result.
Figure 12 compares the median scatter of the - relation obtained using the spaxels in the knots and that obtained using those in the diffuse component, highlighting how the latter is systematically lower for more than 70% of the sample.
Our result suggests that bright star forming regions follow different - relations from the diffuse emission.
3.3 The - relation

The molecular gas surface density has been found to trace the stellar mass surface density on kiloparsec scales (Lin et al., 2017). This might lead to the correlation between and , at a fixed star formation efficiency (SFE). Here we therefore aim at understanding whether the correlates better to the total gas surface density () than to the , for both the diffuse component and the knots.
Bigiel et al. (2008) have investigated the - relationship, at sub-kpc resolution, in a sample of 18 nearby galaxies, using high-resolution Hi data from The Hi Nearby Galaxy Survey (THINGS, Walter et al., 2008), CO data from HERACLES (Leroy et al., 2008) and the BIMA Survey of Nearby Galaxies (SONG, Helfer et al., 2003). Their analysis was confined to the optical radius , i.e., where the B-band magnitude drops below 25 mag arcsec-2. Almost all star formation occurs within this radius, although they found that the Hi often extends much beyond . They found that overall the relationship has a scatter of 0.3 dex, but the distribution of points in the - parameter space varies from galaxy to galaxy, indicating that there is no universal behavior. In some cases, a single power law relates total gas and SFR over many orders of magnitudes in gas surface density. In other cases, they found a wide range of SFRs at almost the same gas column. The two quantities seem to become essentially uncorrelated where i . This transition typically occurs at . Their analysis therefore suggests that a universal total gas Schmidt law (Kennicutt, 1998b) does not exist at all galactocentric distances. According to their interpretation, galaxies with well-defined total gas Schmidt laws (and low Hi surface densities) may have lost diffuse Hi not associated with star formation in interactions.
Figure 13 shows the - relationship for the GASP sample. We remind the reader that we obtained the from the ,using a calibration based on CO observations as we have at our disposal direct estimates of neither Hi nor H2. Note however that the traces the dust heated by star formation and not the the cold dust emission and Corbelli et al. (2012) have shown that the CO mass, proxy for the H2 mass, is tightly correlated to the latter and not to the former.
Similarly to what found by Bigiel et al. (2008), we observe a large spread between the two quantities and different behaviours among the different galaxies. Typically, relations are thinner at high values and they widen at low values. Multi sequences are observed at high values. These ones corresponds to different knots that are characterised by different (as shown by the colour of the points) and . Some galaxies lie on the Kennicutt-Schmidt law (even though with a large scatter - e.g. JO68), other lie well below it (e.g. P15703). The scatter ranges from 0.2 dex (JO89) to 0.5 dex (P42932). Considering separately the knots and the diffuse component, no significant differences are observed (plot not shown).
As Bigiel et al. (2008) found that the region at which the two quantities are essentially uncorrelated is at , we investigate if also in our sample selecting only the central regions thins the relation. In our sample (G. Fasano 2019, private communication). Considering only spaxels with (plot not shown), we obtain a scatter of .3 dex, compatible with what found by Bigiel et al. (2008). Our results therefore on one side validate the approach of using the dust extinction to compute total gas surface density, at least in the galaxy cores, and on the other side support the hypothesis that the Kennicutt-Schmidt law does not hold in the galaxy outskirts.
Finally, our results also suggest the the total gas surface density is not a primary driver of the - relation, as the - relation is not tighter than the former, when all spaxels are considered.
3.4 Spatially resolved vs Global SFR-Mass relation
In the previous sections we have observed that the spatially resolved SFR- relation seems not to depend on the total stellar mass. Plots were sorted by increasing stellar mass but no clear trends were visible.
It is now interesting to understand how the local relation is related to the global one. Fig. 14 resembles Fig. 4, where each panel shows the - relation for each galaxy separately. Single spaxels are represented with orange colours. Each panel also shows the mean and value for each galaxy of the sample, represented by coloured circles. The circles are colour coded by the number of spaxels for which the stellar mass has been computed, used as a proxy of the galaxy size, in the corresponding galaxy. The circle surrounded by an empty magenta one indicates the values of the galaxy shown in that panel. Each panel also shows the global SFR- relation of each galaxy, obtained by summing the values of all the spaxels of a given galaxy. The relation is shown with diamond symbols. As for the mean - relation, symbols are colour coded by the number of spaxels in that galaxy and the empty magenta diamond shows the galaxy discussed in that panel.
Figure 14 shows that overall, the mean and values occupy a well defined and quite restricted region in the plane. 90% of the points have values spanning the range and values spanning the range . They therefore span a range of both in surface mass density and in surface SFR density. Hence even though each galaxy is characterised by a different and overall quite spread - relation, average values are similar. No trends are seen for the mean and values with increasing number of spaxels within the galaxies, indicating that these quantities are independent on the galaxy size. In contrast, a clear trend with galaxy size is seen when global values are considered: bigger galaxies (indicated by lighter colours) are found in the upper left region of the global SFR- relation, while smaller galaxies (indicated by darker colours) are preferentially located in the bottom left region. In addition, the ranges spanned by global values are almost twice as broad as those spanned by local values: SFR values range from 0.12 to 5 , stellar mass values from 8 to 5 . The relation is therefore stretched and presents a flatter fit than the fit of the local relation. This finding indicates that the global SFR-Mass relation arises simply from the combination of two factors: a) the mean spatially resolved vs value does not vary much for most galaxies, and b) more massive galaxies are on average bigger (the mass-size relation), i.e. have more spaxels that contribute both to the total mass and total SFR. This stretches the relation between the two quantities into a linear and quite tight global SFR-mass relation. Thus, the global SFR-Mass relation is a consequence of the mass-size relation.

4 Discussion and summary
In this paper we have reported the analysis of the spatially resolved SFR- relation, based on 92020 star forming spaxels of 30 local undisturbed late-type galaxies in different environments drawn from the GAs Stripping Phenomena in galaxies with MUSE (GASP, Paper I, ).
The GASP survey exploits the exquisite performances of the integral-field spectrograph MUSE mounted at the VLT and one of its added values is that the observations cover the entire optical extension of the galaxy, so that we can characterise the star forming properties up to several effective radii. Specifically, we detected H out of more than 2.7 for 75% of the sample analysed in this work.
Given the MUSE capabilities and observational conditions, we could recover the spatially resolved SFR- relation on the kpc scale, so we are in the regime where SFR and estimates are reliable. Indeed, while reaching sufficiently small spatial scales is critical to shed light on the physical processes that regulate galaxy formation, it is important to stress that measurements for the SFMS may be appropriate only on scales larger than individual giant molecular clouds (GMCs), typically of the order of 100pc. On smaller scales, young clusters might drift from their parent GMC, thus disconnecting measurements of from their related , therefore yielding incorrect and SFR.
Star formation activity can also vary from cloud to cloud, and since most SFR transformations are generalized to be applied across all environments, sampling of statistically robust and extended star formation activity is therefore required. The smallest region size that will contain both a complete sampling of star forming environments, IMFs used, and is not affected by the possible drift of young stellar clusters from their parent GMC is 500 pc (Kruijssen & Longmore, 2014). This spatial scale must be used as the minimum scale over which to apply and SFR transformation, to produce physically meaningful measurements.
In this work, we have selected star forming regions according to the [OI] BPT diagram. This diagram is typically capable to highlight a contribution from other physical processes rather than star formation. Mechanisms such as thermal conduction from the surrounding hot ICM and turbulence are particularly relevant for the origin of the diffuse emission (see, e.g., Paper XIII, ). Ours is therefore a conservative choice. Nonetheless, Appendix A shows that all the results hold also when using the [NII] diagnostic diagram.
The first result of our analysis is that, considering all galaxies together, a correlation between the and exists, though it is quite broad, having a scatter of 0.3 dex. The correlation gets steeper and shifts to higher values when external spaxels are excluded from the analysis and at a given galactocentric distance moving from less to more massive galaxies. The broadness of the relation suggests galaxy-by-galaxy variations. We note that the sample includes only late-type star forming galaxies, therefore differences can not be driven by the morphology, as found for example by CALIFA studies (e.g. González Delgado et al., 2014). No conclusion about the role of morphology in driving the - relation can be obtained with this sample.
The second result is that inspecting individual galaxies, each object is characterized by a distinct - relation, indicating that no universal relation exists. Some galaxies show quite elongated sequences, some other much broader. In half of the cases the coefficient of correlation states there is no correlation between and , suggesting that fitting relations is meaningless. The steep slope of the global relation is therefore probably just a consequence of the different intercepts of the galaxies in the sample, which casts additional doubts on its physical meaning.
For some galaxies the scatter - if meaningful- depends on the , for some others multi sequences co-exists. The scatter of the relation does not depend on global parameters, such as total stellar mass, SFR, , galaxy inclination, number of knots, SFR in the knots, SFR in the knots divided by the total stellar mass, .
The third result is that the broadening of the relation and the multi-sequences are mainly due to the presence of off-center bright star forming knots, that do not always follow the relation traced by the diffuse component. This result might reflect the stochasticity of the knots distribution: GMCs, that are regions where the knots form, do not follow a uniform or gaussian distribution, but assemble and condense "randomly" throughout the disk. SFR is not directly connected to the mass in stars in the corresponding area: indeed the mass is the integral of the star formation occurred in that region during the entire galaxy life, while star formation is the result of the ongoing gas availability.
We note that our results differ from those presented by Maragkoudakis et al. (2017). They measured the SFR and of the bright off-nuclear regions and calculated the slope and dispersion of the produced - relations, finding that higher surface brightness regions are not the primary drivers of the correlation for all spaxels. The discrepancy might arise from the different techniques adopted to select bright knots. Maragkoudakis et al. (2017), indeed, only focused on the 10 brightest regions on the galaxy disk of each galaxy, without applying any cut in surface brightness, as we do.
Considering the star-forming knots and diffuse component separately, we have found that the SFR in the knots is 7 higher than in the diffuse component. The radial distribution of the knots is very scattered. As a consequence, the - relation for the knots is much broader than that of the diffuse component. The fraction of star formation happening within bound clusters (Cluster Formation Efficiency, CFE Bastian et al., 2012) has been investigated in a number of other single galaxies (Silva-Villa et al., 2013; Adamo et al., 2015) and it has been found that it instead varies positively with both the SFR density and SFR. Galaxies with higher SFR also have on average a larger CFE (see, e.g., Goddard et al., 2010; Adamo et al., 2011; Ryon et al., 2014). Differences might be due to the resolution scale reached by the different works.
Another important result of our analysis is that the - gas relation is as broad as the - relation, indicating that the surface gas density is not a primary driver of the relation.
Finally, we have tried to reconcile the local - relation to the global one, which we studied in Paper XIV. In that and in many other studies (e.g., Brinchmann et al., 2004; Salim et al., 2007; Noeske et al., 2007a, b, just to cite a few), it has been found that on global scales SFR and are tightly related, suggesting that the overall current gas content is related to the current stellar mass.
We have found that the global SFMS is a continuous relation extended from the local one (see also Hsieh et al., 2017; Cano-Díaz et al., 2016), but it spans a much wider area on the plane. While on local scales the mean and values for all galaxies are quite similar, with mean and values varying of at most 0.7 dex across galaxies, regardless of the galaxy size, on global scales more extended galaxies are also more massive and more star-forming, suggesting that the SFR- relation might be driven by the size-mass relation.
Acknowledgements
We thank the referee, Yago Ascasibar, for his constructive report that helped us to improve the manuscript. Based on observations collected at the European Organisation for Astronomical Research in the Southern Hemisphere under ESO programme 196.B-0578. This project has received funding from the European Reseach Council (ERC) under the Horizon 2020 research and innovation programme (grant agreement N. 833824). We acknowledge funding from the INAF PRIN-SKA 2017 program 1.05.01.88.04 (PI Hunt). We acknowledge financial contribution from the contract ASI-INAF n.2017-14-H.0. Y. J. acknowledges support from CONICYT PAI (Concurso Nacional de Inserción en la Academia 2017) No. 79170132.
References
- Abdurro’uf (2018) Abdurro’uf Masayuki A., 2018, MNRAS, 479, 5083
- Abdurro’uf & Akiyama (2017) Abdurro’uf Akiyama M., 2017, MNRAS, 469, 2806
- Abramson et al. (2014) Abramson L. E., Kelson D. D., Dressler A., Poggianti B., Gladders M. D., Oemler Jr. A., Vulcani B., 2014, ApJ, 785, L36
- Adamo et al. (2011) Adamo A., Östlin G., Zackrisson E., 2011, MNRAS, 417, 1904
- Adamo et al. (2015) Adamo A., Kruijssen J. M. D., Bastian N., Silva-Villa E., Ryon J., 2015, MNRAS, 452, 246
- Barrera-Ballesteros et al. (2018) Barrera-Ballesteros J. K., et al., 2018, ApJ, 852, 74
- Barro et al. (2017) Barro G., et al., 2017, ApJ, 840, 47
- Bastian et al. (2012) Bastian N., et al., 2012, MNRAS, 419, 2606
- Bigiel et al. (2008) Bigiel F., Leroy A., Walter F., Brinks E., de Blok W. J. G., Madore B., Thornley M. D., 2008, AJ, 136, 2846
- Bolatto et al. (2017) Bolatto A. D., et al., 2017, ApJ, 846, 159
- Brinchmann et al. (2004) Brinchmann J., Charlot S., White S. D. M., Tremonti C., Kauffmann G., Heckman T., Brinkmann J., 2004, MNRAS, 351, 1151
- Bryant et al. (2015) Bryant J. J., et al., 2015, MNRAS, 447, 2857
- Bundy et al. (2015) Bundy K., et al., 2015, ApJ, 798, 7
- Cano-Díaz et al. (2016) Cano-Díaz M., et al., 2016, ApJ, 821, L26
- Cappellari et al. (2011) Cappellari M., et al., 2011, MNRAS, 413, 813
- Cardelli et al. (1989) Cardelli J. A., Clayton G. C., Mathis J. S., 1989, ApJ, 345, 245
- Cattaneo et al. (2006) Cattaneo A., Dekel A., Devriendt J., Guiderdoni B., Blaizot J., 2006, MNRAS, 370, 1651
- Chabrier (2003) Chabrier G., 2003, PASP, 115, 763
- Cid Fernandes et al. (2011) Cid Fernandes R., Stasińska G., Mateus A., Vale Asari N., 2011, MNRAS, 413, 1687
- Corbelli et al. (2012) Corbelli E., et al., 2012, A&A, 542, A32
- Daddi et al. (2007) Daddi E., et al., 2007, ApJ, 670, 156
- Domgorgen & Mathis (1994) Domgorgen H., Mathis J. S., 1994, ApJ, 428, 647
- Elbaz et al. (2011) Elbaz D., et al., 2011, A&A, 533, A119
- Ellison et al. (2018) Ellison S. L., Sánchez S. F., Ibarra-Medel H., Antonio B., Mendel J. T., Barrera-Ballesteros J., 2018, MNRAS, 474, 2039
- Erroz-Ferrer et al. (2019) Erroz-Ferrer S., et al., 2019, MNRAS,
- Faber et al. (2007) Faber S. M., et al., 2007, ApJ, 665, 265
- Fossati et al. (2016) Fossati M., Fumagalli M., Boselli A., Gavazzi G., Sun M., Wilman D. J., 2016, MNRAS, 455, 2028
- Fritz et al. (2017) Fritz J., et al., 2017, ApJ, 848, 132
- García-Benito et al. (2015) García-Benito R., et al., 2015, A&A, 576, A135
- Goddard et al. (2010) Goddard Q. E., Bastian N., Kennicutt R. C., 2010, MNRAS, 405, 857
- González Delgado et al. (2014) González Delgado R. M., et al., 2014, ApJ, 791, L16
- González Delgado et al. (2016) González Delgado R. M., et al., 2016, A&A, 590, A44
- Haffner et al. (2009) Haffner L. M., et al., 2009, Reviews of Modern Physics, 81, 969
- Hall et al. (2018) Hall C., Courteau S., Jarrett T., Cluver M., Meurer G., Carignan C., Audcent-Ross F., 2018, ApJ, 865, 154
- Helfer et al. (2003) Helfer T. T., Thornley M. D., Regan M. W., Wong T., Sheth K., Vogel S. N., Blitz L., Bock D. C.-J., 2003, ApJS, 145, 259
- Hsieh et al. (2017) Hsieh B. C., et al., 2017, ApJ, 851, L24
- Husemann et al. (2013) Husemann B., et al., 2013, A&A, 549, A87
- Kauffmann et al. (2003a) Kauffmann G., et al., 2003a, MNRAS, 341, 54
- Kauffmann et al. (2003b) Kauffmann G., et al., 2003b, MNRAS, 346, 1055
- Kennicutt (1998a) Kennicutt Jr. R. C., 1998a, ARA&A, 36, 189
- Kennicutt (1998b) Kennicutt Jr. R. C., 1998b, ApJ, 498, 541
- Kewley et al. (2001) Kewley L. J., Heisler C. A., Dopita M. A., Lumsden S., 2001, ApJS, 132, 37
- Kruijssen & Longmore (2014) Kruijssen J. M. D., Longmore S. N., 2014, MNRAS, 439, 3239
- Kumari et al. (2019) Kumari N., Maiolino R., Belfiore F., Curti M., 2019, MNRAS, 485, 367
- Leroy et al. (2008) Leroy A. K., Walter F., Brinks E., Bigiel F., de Blok W. J. G., Madore B., Thornley M. D., 2008, AJ, 136, 2782
- Lilly et al. (2013) Lilly S. J., Carollo C. M., Pipino A., Renzini A., Peng Y., 2013, ApJ, 772, 119
- Lin et al. (2017) Lin L., et al., 2017, ApJ, 851, 18
- Liu et al. (2018) Liu Q., Wang E., Lin Z., Gao Y., Liu H., Berhane Teklu B., Kong X., 2018, ApJ, 857, 17
- Magdis et al. (2016) Magdis G. E., et al., 2016, MNRAS, 456, 4533
- Maragkoudakis et al. (2017) Maragkoudakis A., Zezas A., Ashby M. L. N., Willner S. P., 2017, MNRAS, 466, 1192
- Mathis (1986) Mathis J. S., 1986, PASP, 98, 995
- Mathis (2000) Mathis J. S., 2000, ApJ, 544, 347
- McDermid et al. (2015) McDermid R. M., et al., 2015, MNRAS, 448, 3484
- Medling et al. (2018) Medling A. M., et al., 2018, MNRAS, 475, 5194
- Morselli et al. (2018) Morselli L., Popesso P., Cibinel A., Oesch P. A., Montes M., Atek H., Illingworth G. D., Holden B., 2018, arXiv e-prints,
- Noeske et al. (2007a) Noeske K. G., et al., 2007a, ApJ, 660, L43
- Noeske et al. (2007b) Noeske K. G., et al., 2007b, ApJ, 660, L47
- Pan et al. (2018) Pan H.-A., et al., 2018, ApJ, 854, 159
- Poggianti et al. (2017) Poggianti B. M., et al., 2017, ApJ, 844, 48
- Poggianti et al. (2019) Poggianti B. M., et al., 2019, MNRAS, 482, 4466
- Roberts & Haynes (1994) Roberts M. S., Haynes M. P., 1994, ARA&A, 32, 115
- Rosales-Ortega et al. (2012) Rosales-Ortega F. F., Sánchez S. F., Iglesias-Páramo J., Díaz A. I., Vílchez J. M., Bland-Hawthorn J., Husemann B., Mast D., 2012, ApJ, 756, L31
- Ryon et al. (2014) Ryon J. E., et al., 2014, AJ, 148, 33
- Salim et al. (2007) Salim S., et al., 2007, ApJS, 173, 267
- Sánchez (2013) Sánchez S. F., 2013, Advances in Astronomy, 2013, 1
- Sánchez et al. (2012) Sánchez S. F., et al., 2012, A&A, 538, A8
- Sarzi et al. (2010) Sarzi M., et al., 2010, MNRAS, 402, 2187
- Schiminovich et al. (2007) Schiminovich D., et al., 2007, ApJS, 173, 315
- Schreiber et al. (2015) Schreiber C., et al., 2015, A&A, 575, A74
- Sembach et al. (2000) Sembach K. R., Howk J. C., Ryans R. S. I., Keenan F. P., 2000, ApJ, 528, 310
- Sharp & Bland-Hawthorn (2010) Sharp R. G., Bland-Hawthorn J., 2010, ApJ, 711, 818
- Silva-Villa et al. (2013) Silva-Villa E., Adamo A., Bastian N., 2013, MNRAS, 436, L69
- Speagle et al. (2014) Speagle J. S., Steinhardt C. L., Capak P. L., Silverman J. D., 2014, ApJS, 214, 15
- Tacconi et al. (2013) Tacconi L. J., et al., 2013, ApJ, 768, 74
- Viaene et al. (2014) Viaene S., et al., 2014, A&A, 567, A71
- Vulcani et al. (2010) Vulcani B., Poggianti B. M., Finn R. A., Rudnick G., Desai V., Bamford S., 2010, ApJ, 710, L1
- Vulcani et al. (2018) Vulcani B., et al., 2018, ApJ, 866, L25
- Walter et al. (2008) Walter F., Brinks E., de Blok W. J. G., Bigiel F., Kennicutt Jr. R. C., Thornley M. D., Leroy A., 2008, AJ, 136, 2563
- Whitaker et al. (2012) Whitaker K. E., van Dokkum P. G., Brammer G., Franx M., 2012, ApJ, 754, L29
- Willett et al. (2015) Willett K. W., et al., 2015, MNRAS, 449, 820
- Wood & Mathis (2004) Wood K., Mathis J. S., 2004, MNRAS, 353, 1126
- Wood et al. (2010) Wood K., Hill A. S., Joung M. R., Mac Low M.-M., Benjamin R. A., Haffner L. M., Reynolds R. J., Madsen G. J., 2010, ApJ, 721, 1397
- Wuyts et al. (2013) Wuyts S., et al., 2013, ApJ, 779, 135
- Yan (2018) Yan R., 2018, MNRAS, 481, 476
Appendix A The - relation obtained using the [NII]-based diagnostic diagram
In the main text we have employed the diagnostic diagram based on the [OI] line ([OIII]5007/ vs [OI]6300/) to distinguish between regions powered by star formation and regions powered by other mechanisms. In this Appendix we instead adopt the [NII]-based diagnostic diagram ([OIII]5007/ vs [NII]6583/) and show that results are robust again this choice.
To separate the regions powered by Star-formation, Composite (SF+LINER/AGN), AGN and LINER emission we adopt the division lines by Kauffmann et al. (2003b); Kewley et al. (2001); Sharp & Bland-Hawthorn (2010).
Using the [NII] diagram, 142354 spaxels are powered by star formation. The star-forming sample is therefore 1.5 larger than that discussed in the main paper. Nonetheless, also the [NII] diagram does not detect any AGN in the sample. 99391 spaxels belong to knots, 42963 belong to the diffuse component. This selection therefore slightly increases the incidence of the diffuse component. The vast majority of spaxels excluded according the [OI] diagram, but included when adopting the [NII] diagram are characterised by low values of both and .
Considering all galaxies together, the - relation has a scatter of 0.35 dex, but it is qualitatively very similar to what presented in Fig. 3 (plot not shown).
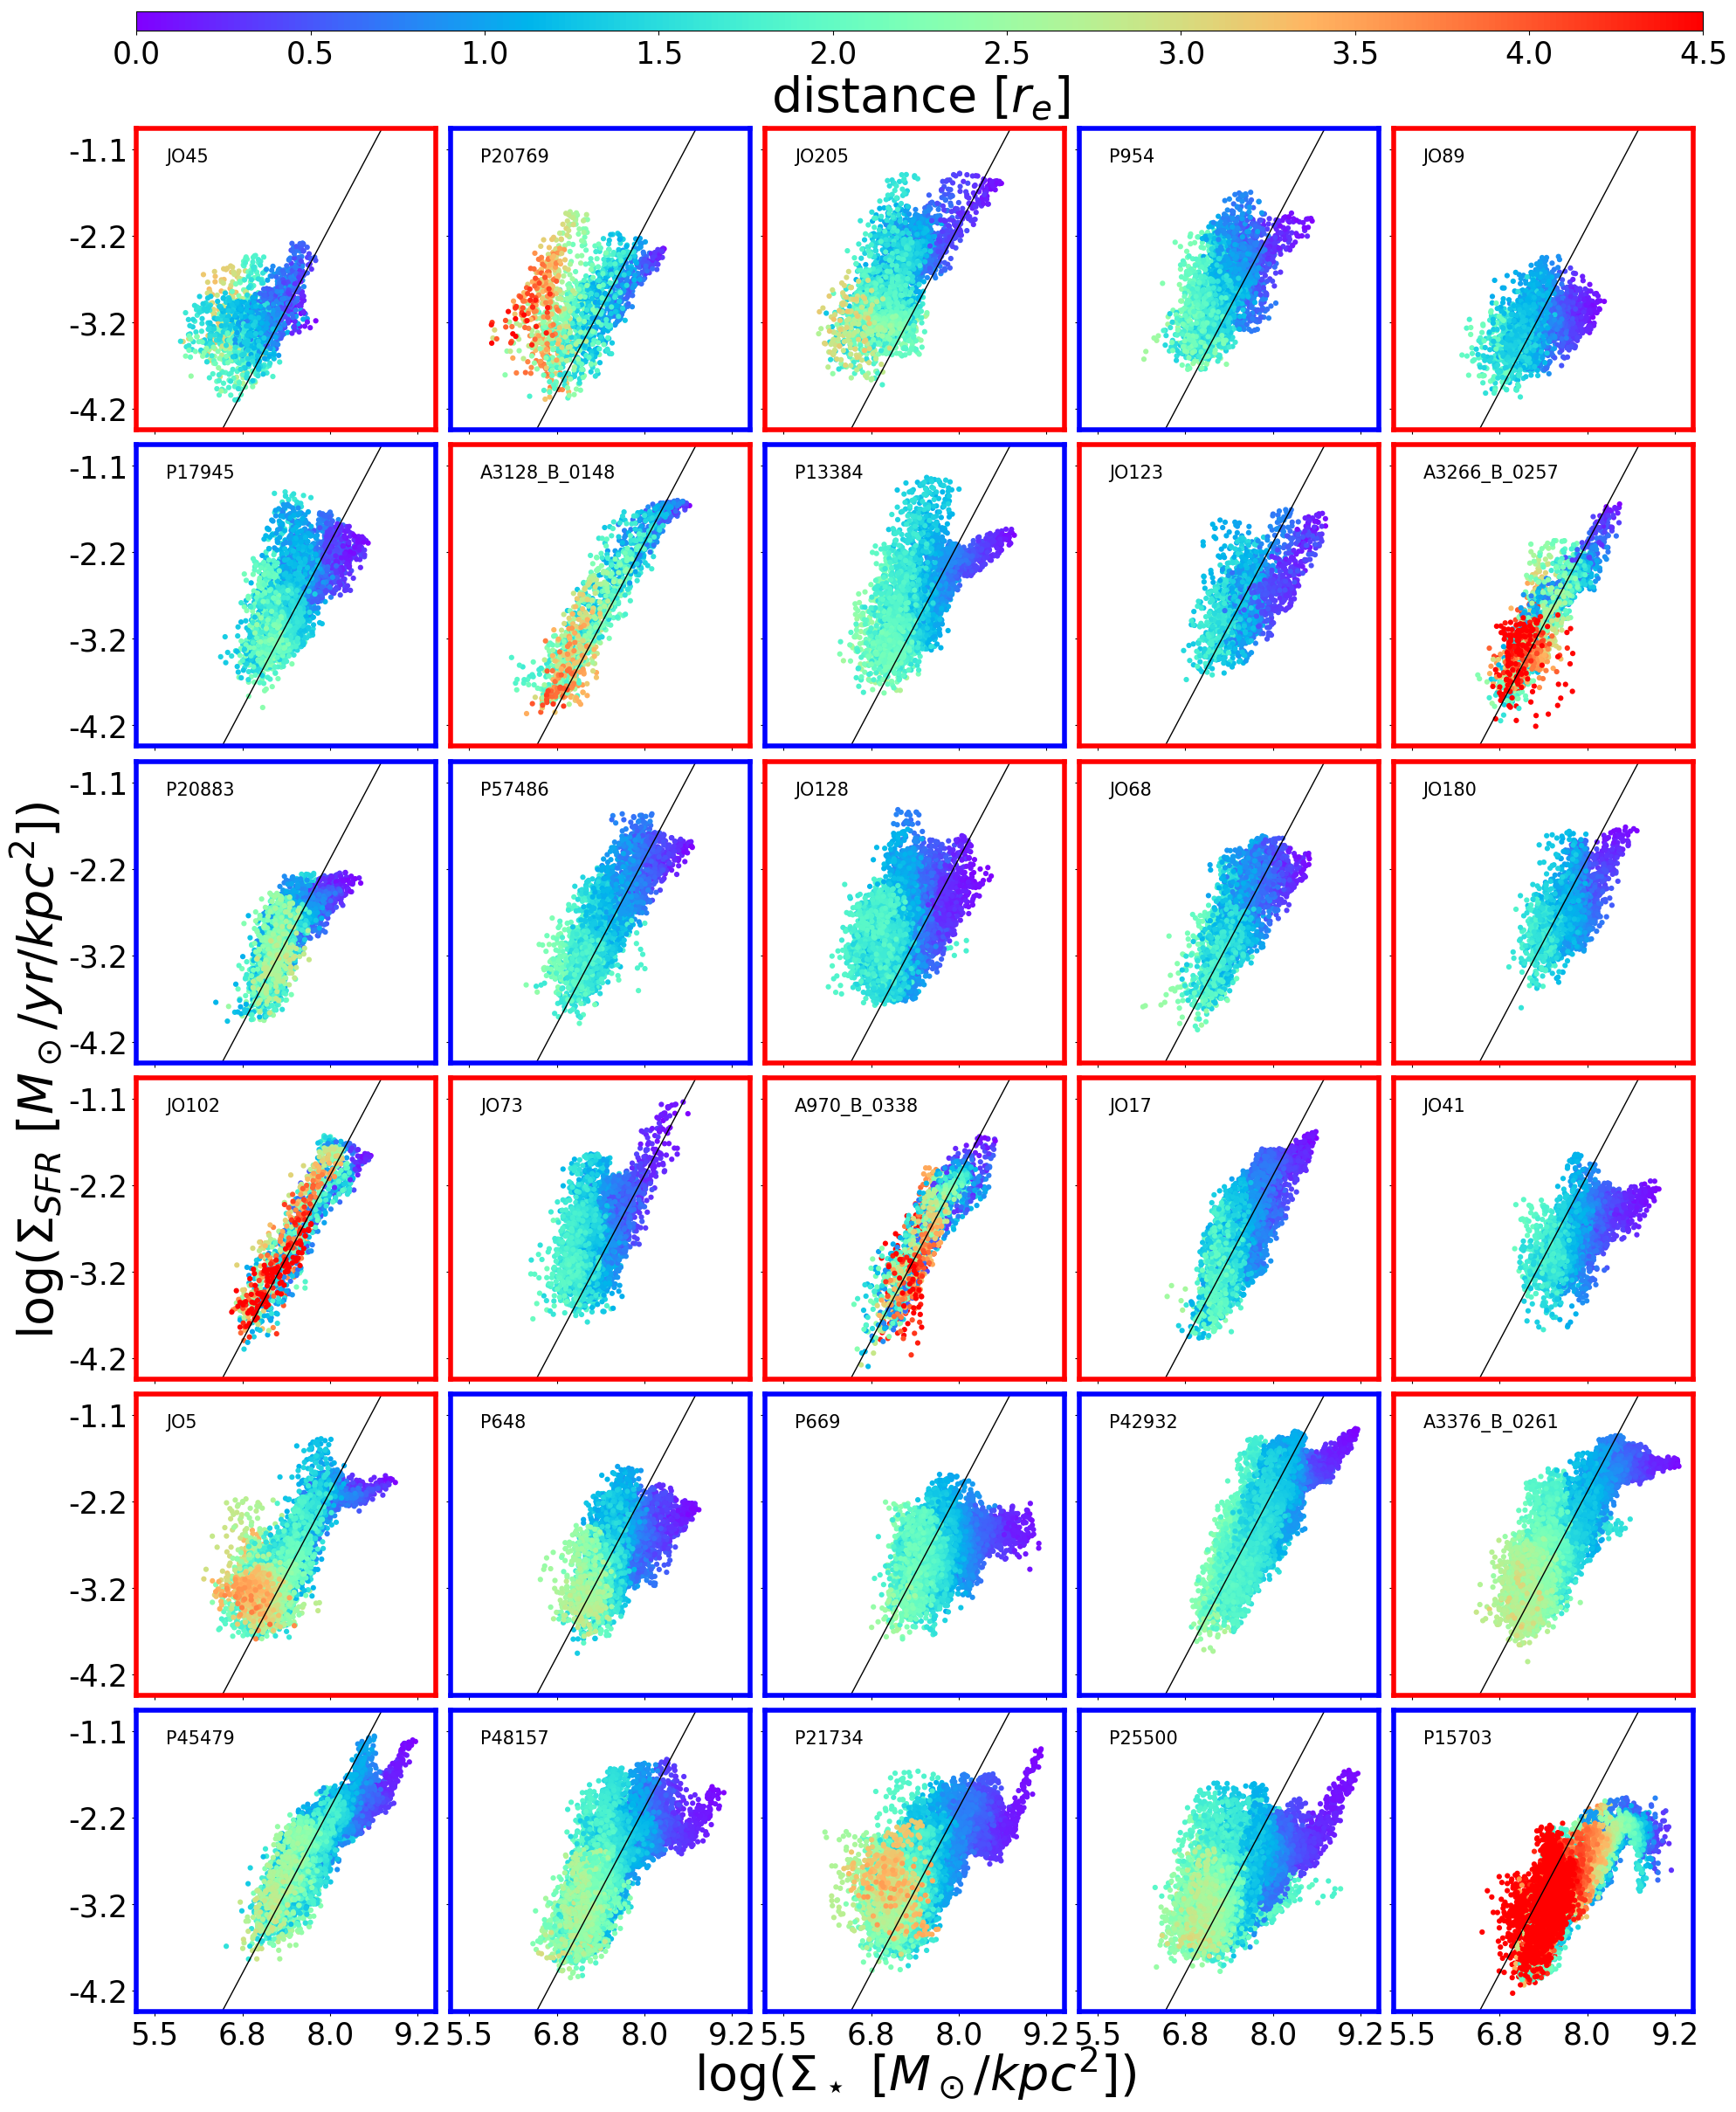
Figure 15 shows the - relation for each galaxy of the sample separately, similarly to what shown in Fig.4. Besides the larger number of spaxels plotted, the - relations are very similar to the ones presented in the main text. They extend more towards lower values of both and values, but these stay on the same relation traced by the other spaxels.
We have also checked that any of the results presented in the paper depends on the choice of the diagnostic diagram adopted, we can therefore conclude that the choice does not affect our findings.
Appendix B The galaxy-by galaxy variation of the relation
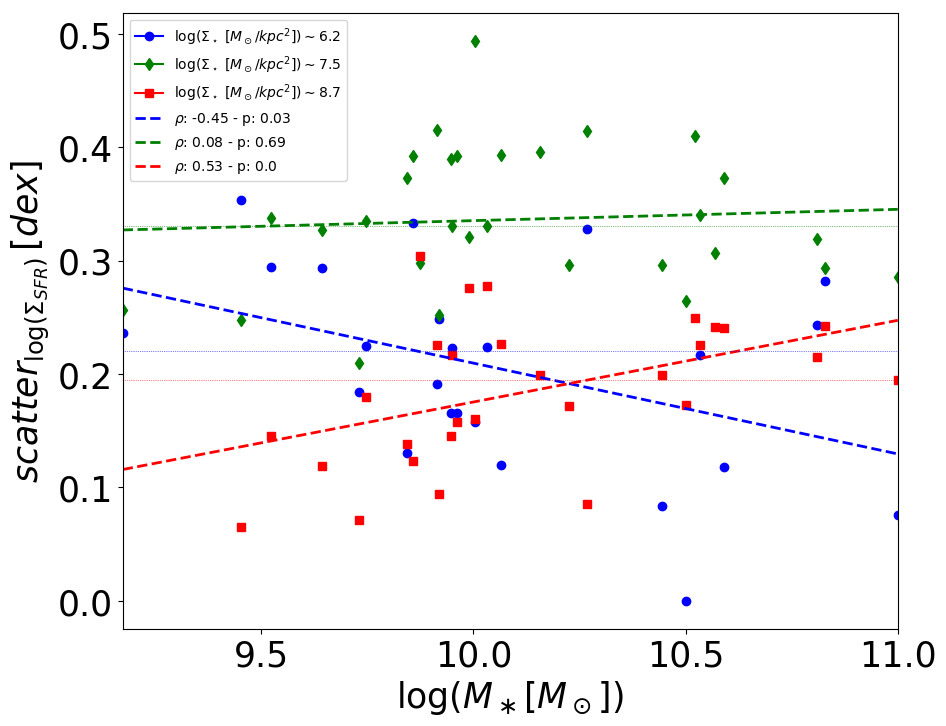
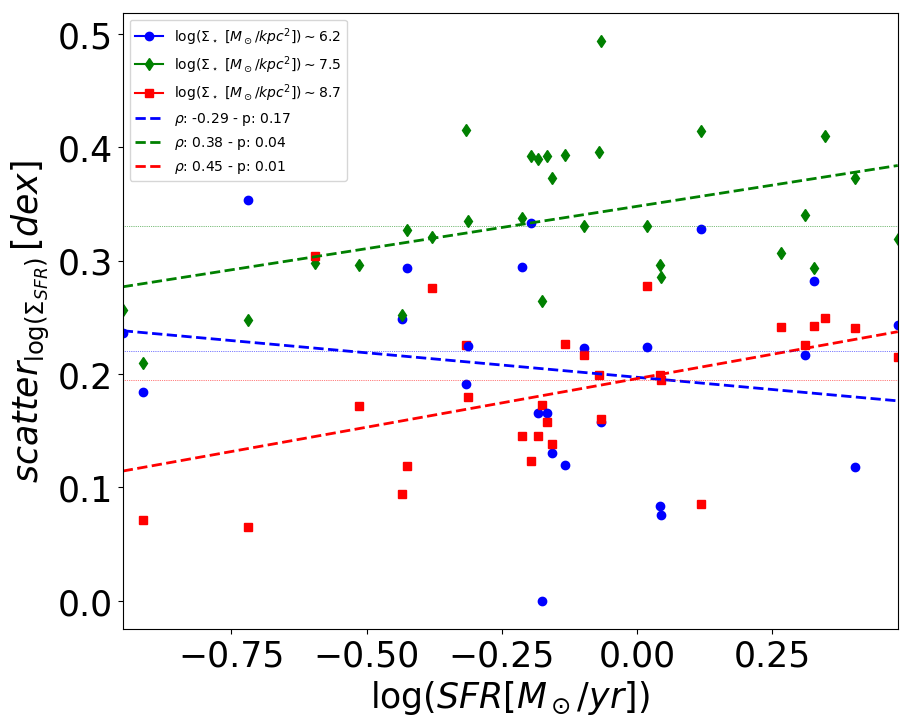
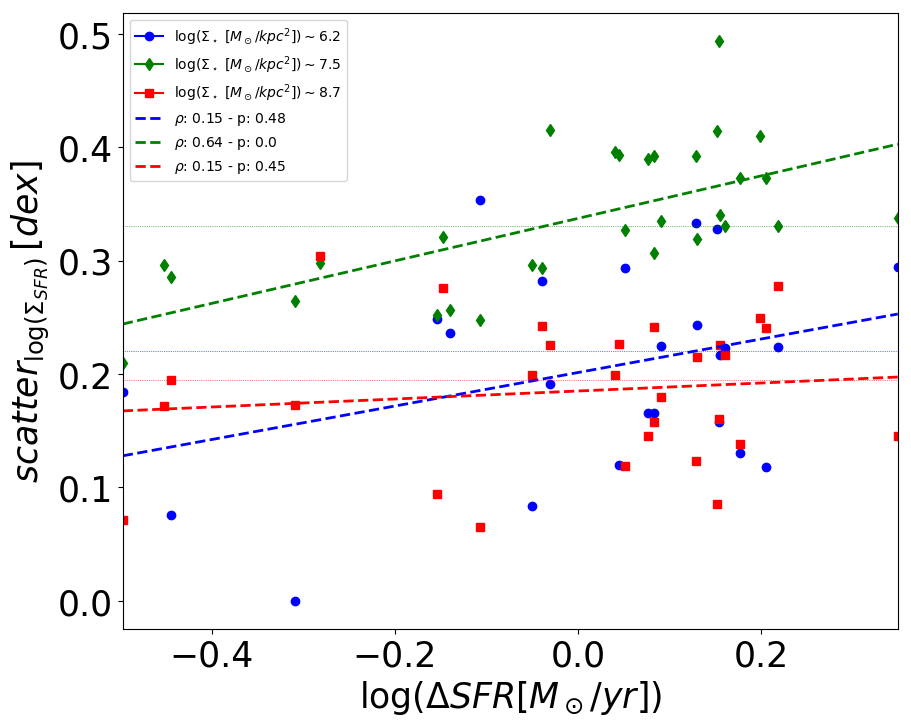
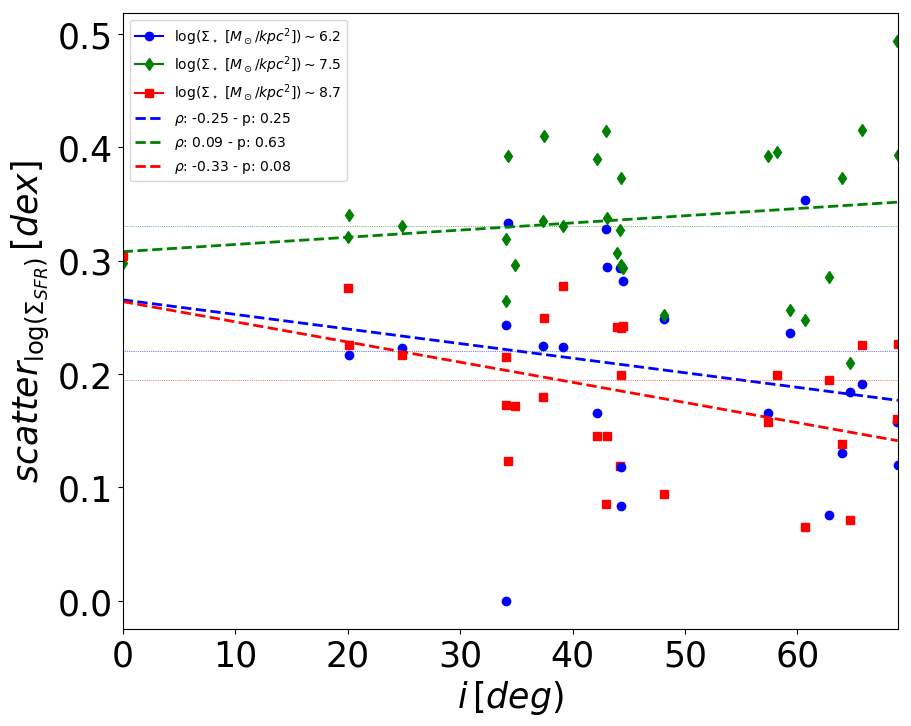
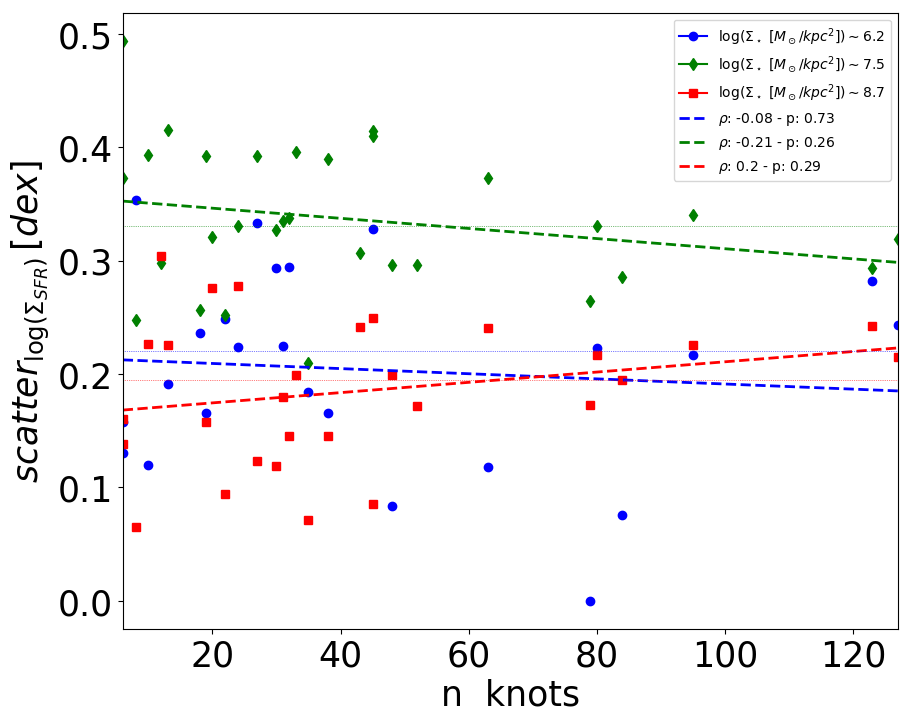
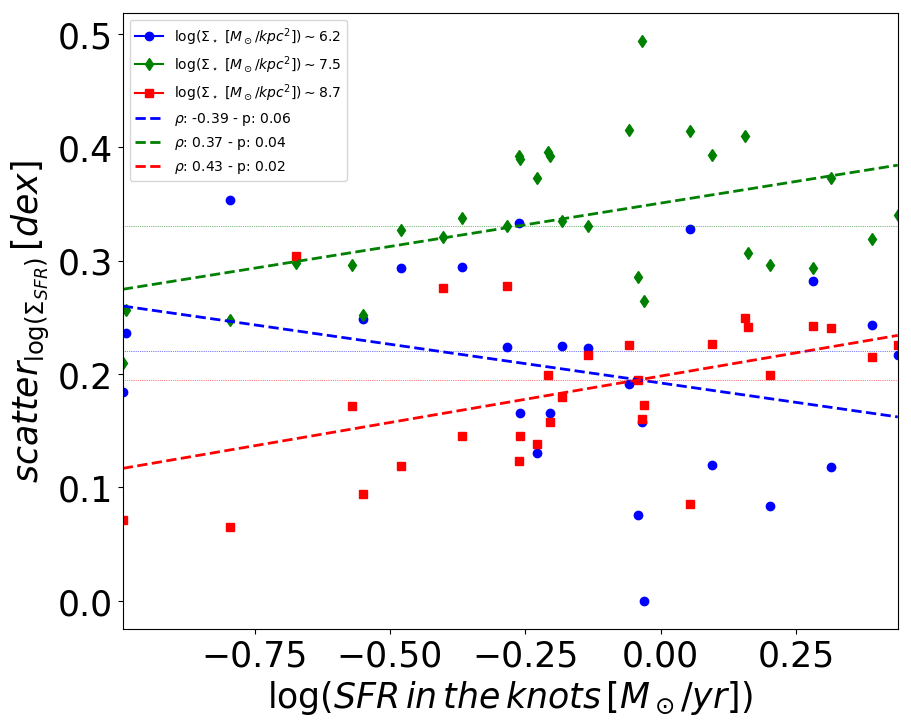
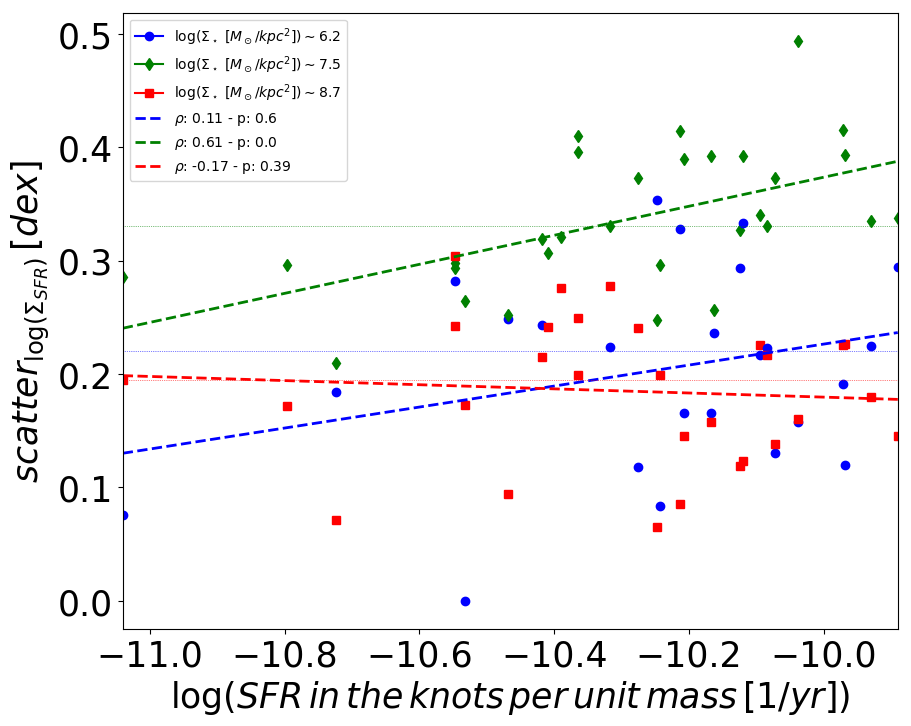
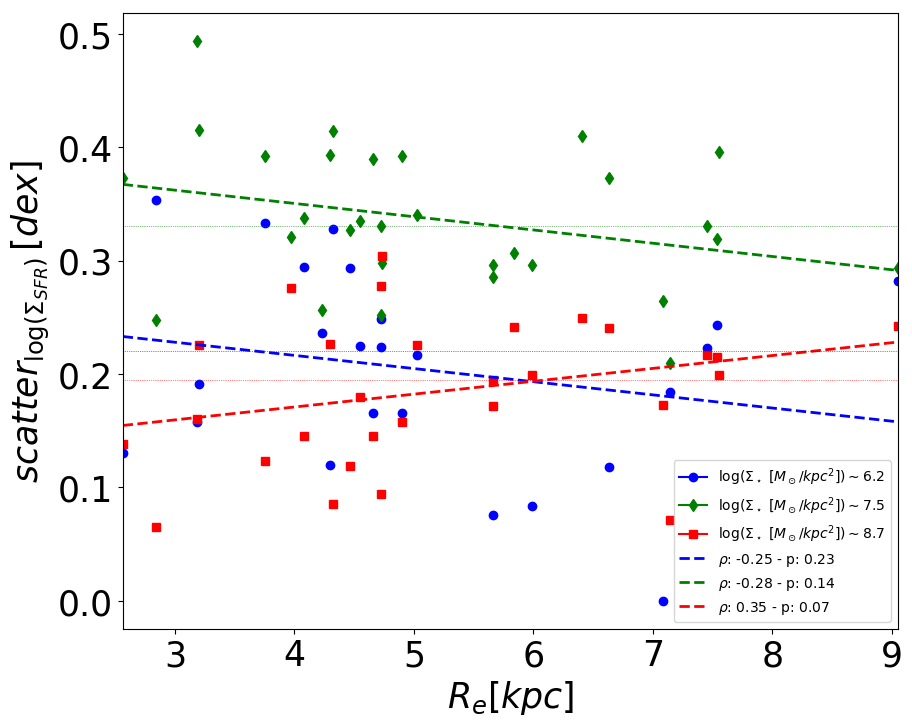
The magnitude of the scatter of the - relation might depend on a number of global parameters. Figure 16 shows this quantity measured in three surface mass density bins as a function of the galaxy total stellar mass, the SFR, the - i.e. the differences between the galaxy SFRs and their expected value according to the fit of the SFR- relation, given their mass (Paper XIV), the galaxy inclination, the number of knots, the SFR in the knots, the SFR in the knots divided by the total stellar mass, the effective radius, respectively. We run the nonparametric Spearman test to measure the monotonicity of the relationships. The correlation coefficient varies between -1 and +1, with 0 implying no correlation. No strong and statistically meaningful correlations are found for any of the parameters analysed, as either the correlation coefficient is close to zero or the p-value is . The only positive correlation supported by the statistical test is that with in the intermediate surface mass density bin.