DYNAMICAL CONFIRMATION OF A BLACK HOLE IN MAXI J1820+070
Abstract
We present time-resolved 10.4-m GTC and 4.2-m WHT intermediate resolution spectroscopy of the X-ray transient MAXI J1820+070 (=ASASSN-18ey) obtained during its decline to the quiescent state. Cross-correlation of the 21 individual spectra against late-type templates reveals a sinusoidal velocity modulation with a period of d and semi-amplitude of km s-1. We derive a mass function f(M)= M⊙, dynamically confirming the black hole nature of the compact object. Our analysis of the stellar absorption features supports a K spectral classification for the donor star, which contributes of the total flux at 5200-6800 Å. The photometric d periodicity observed during outburst is 2.6 % longer than the orbital period supporting the presence of a superhump modulation in the outburst light curves. In line with this interpretation, we constrain the binary mass ratio to be . In addition, we observe a sharp increase in the H emission line equivalent width during inferior conjunction of the donor star that we interpret as a grazing eclipse of the accretion disc and allows us to constrain the binary inclination to . On the other hand, the absence of X-ray eclipses during outburst imply . These inclination limits, together with our dynamical solution, lead to a black hole mass in the range 7–8 M⊙. We also measure a systemic velocity km s-1 which, combined with the Gaia DR2 proper motion and parallax, implies a large peculiar velocity 100 km s-1.
1 Introduction
Galactic black-hole (BH) X-ray binaries provide an observational way to study the formation of these compact stellar remnants. In this respect, dynamical studies serve to define the BH stellar-mass distribution (e. g. Bailyn et al. 1998; Özel et al. 2010; Farr et al. 2011; Kreidberg et al. 2012) that can be compared with those predicted from different supernova models (e.g. Fryer & Kalogera 2001; Belczynski et al. 2012). Further constraints on the BH formation mechanism can be achieved from X-ray binaries with known space velocities. Combined with dynamical studies, these permit to search for potential kicks suffered by BHs at formation, which provides input to both supernova and binary evolution models (Jonker & Nelemans 2004; Miller-Jones 2014; Repetto & Nelemans 2015). Currently, the number of BH X-ray binaries with a dynamical mass measurement is (Casares & Jonker 2014; Corral-Santana et al. 2016; Tetarenko et al. 2016) while sources with constrained space velocity are more limited (e.g. Casares et al. 2017; Atri et al. 2019, submitted).
The object of the dynamical study presented in this letter, MAXI J1820+070 (hereafter J1820), is a BH candidate with a proper motion and parallax distance determination from GAIA DR2 (e.g. Gandhi et al. 2019). J1820 was discovered on 6 March 2018 as an optical transient by the All-Sky Automated Survey for Supernovae (and named ASASSN-18ey; Tucker et al. 2018) and, as an X-ray transient, by the Monitor of All-sky X-ray Image (MAXI; Matsuoka et al. 2009). With both an optical magnitude of 11.2 and an X-ray flux of 4 Crab (Matsuoka et al., 2009) at outburst peak, J1820 is among the brightest X-ray transients ever observed. The optical spectra displayed broad emission lines, characteristic of low-mass X-ray binaries in outburst (Tucker et al. 2018), with strong and variable contribution from a disc outflow component (Muñoz-Darias et al. 2019). The system was classified as a BH candidate based on its multi-wavelength properties (Kawamuro et al., 2018; Kennea et al., 2018; Baglio et al., 2018; Shidatsu et al., 2019; Tucker et al., 2018). A tentative orbital period of h (Patterson et al. 2018) was identified from intense photometric monitoring of the outburst phase.
In this work we present the dynamical confirmation of the BH in J1820 employing time-resolved optical spectroscopy obtained while the source was approaching its quiescent state. The letter is structured as follows: Section 2 presents the observations and the data reduction steps. In Section 3 we establish the orbital ephemeris and analyze the spectrum of the donor star. Finally, in Section 4 we discuss our results.
2 Observations and data reduction
The observations of J1820 were carried out with the 10.4-m Gran Telescopio Canarias (GTC) and 4.2-m William Herschel Telescope (WHT), both at the Observatorio del Roque de los Muchachos on La Palma, Spain.
We observed the target near the quiescent state in June 2019 with the OSIRIS spectrograph (Cepa et al. 2000) mounted on GTC. We used grism R2500R combined with a 0″.6-wide slit and unbinned detector to cover the Å wavelength range with a 0.5 Å pix-1 dispersion and 2.5 Å FWHM spectral resolution (120 km s-1 at H). In total we obtained 8 spectra across 4 different nights with integration times of 900 s (see Table 1). Four 1200 s OSIRIS spectra of J1820 were also obtained during a low brightness state (Russell et al. 2019) on the nights of 26 and 27 Feb 2019 when the source brightness was 18.0 and 18.4-18.8, respectively, according to the g-band acquisition images. The data were taken with the R2500R grism, a 1″.0-wide slit and binned detector, which delivered a spectral resolution of 4.4 Å (160 km s-1) FWHM sampled with a 1.0 Å pix-1.
Nine spectra were acquired on the night of 24 June 2019 UT with the ISIS spectrograph mounted on the WHT. The red arm of ISIS was used with the R600R grating centered at 6150 Å and a 1″.0-wide slit to observe the spectral range Å with a 1.8 Å (80 km s-1) FWHM resolution and a 0.5 Å pix-1 dispersion. The blue arm of the instrument was employed with the R300B grating centered at 4500 Å, covering Å with a 4.1 Å FWHM resolution. The observations were split into four visits equally spaced through the night to sample close to half of the potential 17 h orbit. In each visit we obtained s spectra, except on the first visit when one extra 300 s spectrum was acquired. The radial velocity standard stars of spectral types K5 V (61 Cyg A) and K7 V (61 Cyg B) were taken during twilight using the same instrumental configuration as for J1820.
| Date | Instrument | # | Exp. | Res. | r |
| (2019) | (s) | (Å) | (mag) | ||
| 26 Feb | OSIRIS | 2 | 1200 | 3.4 | - |
| 27 Feb | OSIRIS | 2 | 1200 | 3.4 | - |
| 7 Jun | OSIRIS | 1 | 900 | 2.5 | 17.5 |
| 9 Jun | OSIRIS | 1 | 900 | 2.5 | 17.7-17.8 |
| 23 Jun | OSIRIS | 3 | 900 | 2.5 | 17.5-17.7 |
| 24 Jun | ISIS | 9 | 300,1800 | 1.8 | - |
| 25 Jun | OSIRIS | 3 | 900 | 2.5 | 17.8-17.9 |
The spectra were reduced, extracted and wavelength calibrated using standard techniques implemented in iraf. Exposures of comparison arc lamps were performed with OSIRIS after the end of each observing night while they were obtained bracketing the target observations with ISIS. The pixel-to-wavelength scale was established through third order spline fits to HgAr+Ne and CuNe+CuAr arc lines in the OSIRIS and ISIS lamp spectra, respectively. The rms scatter of the fit was always Å (OSIRIS) and Å (ISIS). The [Oi] 6300.3 Å sky line was used to correct for wavelength zeropoint deviations, which were km s-1 (OSIRIS) and km s-1 (ISIS). Each spectrum was normalized by dividing it by a third-order spline fit to the continuum after masking out emission lines and telluric bands. Finally, the spectra were rebinned onto a logarithmic wavelength scale. We used molly and custom software under python to perform the analysis described in the next sections.
2.1 Templates
3 Analysis and results
3.1 Radial velocity curve
Radial velocities were measured from the J1820 spectra by the method of cross-correlation with a spectral template star (Tonry & Davis 1979). On the basis of the results for the spectral classification presented below, we selected the spectrum of a K4 dwarf (HD 216803) for the cross-correlation. This was resampled onto the same logarithmic wavelength scale as for the OSIRIS and ISIS spectra, and broadened to match the spectral resolution of these instruments using the rotational profile of Gray (1992). For the analysis we selected the wavelength range , common to all data sets. This spectral interval covers several temperature and gravity sensitive photospheric lines present in F to M stars that are useful for radial velocity measurements as well as spectral-type and luminosity classification. The radial velocities were extracted from the 21 normalized individual J1820 spectra after masking interstellar features and atmospheric bands present in the selected spectral interval.
The cross-correlation analysis of all our spectra reveals clear radial velocity variations. Thus, to determine an accurate orbital period for J1820 we compute a periodogram of these velocities in the frequency range 0.1 - 10 cycles d-1 in 10-5 frequency steps (see Figure 1). The periodogram shows the lowest minimum at 1.4588 cycles d-1 (=0.6855 d). Other minima are rejected as the potential orbital frequencies give reduced . Least-squares sine fits to our radial velocity data using the favoured periodicity as initial guess result in the following best fit parameters:
-
-
km s-1
-
km s-1
-
Porb= 0.68549 0.00001 d
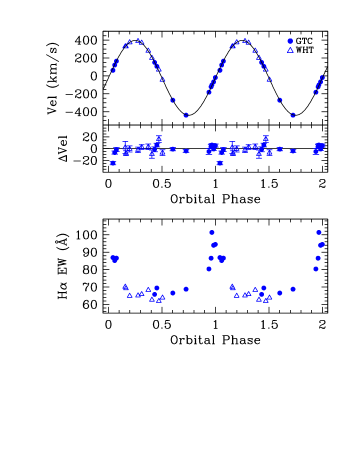
where is defined as the time of closest approach of the donor star to the observer, is the heliocentric systemic velocity (corrected from the radial velocity of the template used in the cross-correlation), the velocity semi-amplitude of the donor star, and Porb the spectroscopic orbital period. The four parameters were kept free during the fit. All quoted uncertainties are 1-. These were obtained by scaling the error in the radial velocities by a factor 1.7 to yield a reduced . The phase-folded radial velocity curve is shown in Figure 2.


3.2 Spectral Type of the Donor Star
To constrain the spectral type of the donor star, we employ the technique described in Marsh et al. (1994), which consists on searching for the lowest residual obtained after subtracting a set of normalized spectral templates from the average (Doppler-corrected) spectrum of the target. Prior to the subtraction, the template spectra are broadened to match the width of the absorption lines from the donor star. This method allows for the possibility of an extra light contribution to the total continuum when searching for the optimal parameters of the donor star. We restricted this analysis to the J1820 spectra obtained with OSIRIS since they have the highest signal-to-noise ratio. Note here that the spectral resolution of the selected data is insufficient to establish with the described method the rotational broadening of the lines, while a reliable measurement of this broadening from the ISIS data is not possible due to the different seeing-limited resolution of each spectrum imposed by variable (0″.5-0″.9) image quality during the observations. As templates we use the spectra of the two K-type dwarfs observed with ISIS and the set of high-resolution templates described in section 2. These stars have accurate stellar parameters (, Teff and metallicities) and, therefore, they provide a reference for a robust spectral-type classification.
We implemented the optimal subtraction of the templates as follows: first, the OSIRIS spectra were shifted to the rest frame of the donor star by subtracting the radial velocities obtained from the cross-correlation with the template. We averaged the individual spectra with weights according to their signal-to-noise ratio in order to maximize the signal-to-noise of their sum. On the other hand, the template spectra were downgraded to the instrumental resolution of the OSIRIS data through convolution with the rotational profile of Gray (1992). Each broadened version of the template was multiplied by a factor (representing the fractional contribution of light from the donor star to the continuum) and subtracted from the J1820 Doppler-corrected average. The spectral type and optimal value of were obtained by minimizing the between the residual of the subtraction and a smoothed version of itself. The results are listed in Table 2. The minimization of shows that the spectral type of the donor star in J1820 is most likely K3-5, while the low value indicates that the accretion disc contributes 80 % to the total flux. The spectral classification should thus be considered preliminary given the strong dilution of the donor’s absorption lines caused by the very large disc contribution. Figure 3 presents the Doppler corrected OSIRIS spectrum of J1820, together with the best spectral template.
In agreement with the large dilution factor, we note that the nightly r-band photometry measured from the OSIRIS acquisition images shows evidence for significant flickering, with 0.2 mag amplitude, and a mean level mag brighter than true quiescence (see Table 1). In addition, Figure 2 reveals that the equivalent width (EW) of the H line does not trace the classic orbital variation expected when the ellipsoidal modulation from the donor star is dominant (e.g. figure 6 in Marsh et al. 1994). Instead, we observe that the H EW increases by a factor 1.5 when the inner face of the donor star is hidden from view (orbital phase ). This behaviour may be the result of a grazing eclipse of the accretion disc by the donor star. Large EW jumps over a narrow orbital interval centered at phase 0 are commonly seen in eclipsing cataclysmic variables (see e.g. Bianchini et al. 2004) and are explained as due to the fact that the emission lines are formed in a chromosphere above the accretion disc. Alternatively, the sharp rise in EW at phase 0 could be explained by irradiation of the donor star if the orbital inclination of the system is moderately high. However, we find no evidence for spectral type variations induced by irradiation on the Doppler-corrected averages of the GTC spectra obtained at orbital phases 0.9-1.1 and 0.4-0.6. Neither we see evidence for irradiation effects in our radial velocity curve when examining the residuals from the fit to the data (see middle panel in Figure 2). Therefore, we give more credit to the disc eclipse interpretation for the EW behaviour at phase 0. In either case, the change in EW implies a drop in the r-band continuum of up to mag at orbital phase 0.0 that should be detected in optical light curves.
| Template | Spectral | ||
|---|---|---|---|
| Type | (d.o.f.=1087) | ||
| HD 39091 | G0 V | 1448.30 | 0.349 |
| HD 30495 | G1.5 V | 1373.90 | 0.336 |
| HD 43162 | G6.5 V | 1316.5 | 0.302 |
| HD 69830 | K0 V | 1260.2 | 0.291 |
| HD 17925 | K1.5 V | 1188.84 | 0.221 |
| HD 222237 | K3 V | 1132.96 | 0.214 |
| HD 216803 | K4 V | 1118.85 | 0.176 |
| 61 Cyg Aa | K5 V | 1145.56 | 0.185 |
| 61 Cyg Ba | K7 V | 1200.54 | 0.173 |
| HD 157881 | K7 V | 1171.48 | 0.151 |
| a Spectral templates obtained with ISIS. |
4 Discussion
Our values of and the orbital period yield a mass function:
where is the gravitational constant and M1 and M2 are the compact object and donor star mass, respectively. Given that the mass function provides a lower limit on the mass of the compact object and this exceeds in J1820 the maximum mass allowed for a neutron star ( M⊙), we conclude that J1820 is a BH. The donor star in J1820 is constrained to be K3-K5. A K3 V donor will fill its Roche lobe when the binary orbital period is Porb (hr) = 6.4 (Frank et al. 2002), where we have used a K3 dwarf mean density g cm-3 (Boyajian et al. 2012). Given the orbital period of J1820, the donor star must clearly be evolved in order to fill its Roche lobe. The presence of evolved donor stars in accreting binaries is not uncommon. For instance, this is the case for the BH X-ray transient Nova Ophiuchi 1977 (Harlaftis et al. 1997) that, with a 0.522 d orbital period, is a close match to J1820.
The d spectroscopic orbital period is 2.6% shorter than the photometric period measured during outburst and therefore consistent with the latter not being the true orbital period but a superhump periodicity () caused by a precessing disc (e.g. O’Donoghue & Charles 1996, Zurita et al. 2002). The superhump is the beat frequency between the orbital and disc precession frequencies: . This implies d during outburst. Moreover, the binary mass ratio can be estimated using the relation between the period excess and . For in the range 0.04–0.30, (Patterson 2001; Patterson et al. 2005). Thus we derive for J1820. The shape of the hardness-intensity diagram (Muñoz-Darias et al. 2019, 2013), the detection of X-ray dips during the hard state (Homan et al. 2018; Kajava et al. 2019) and the behaviour of the H EW at phase 0 indicate that the orbital inclination must be moderately high. Given that we likely detected a grazing eclipse in the H EW, the constraint on can be used to set a lower limit to the orbital inclination, using the disc eclipse condition through e.g. equation 5 in Casares (2018). Assuming a typical disc size , where stands for the equivalent radius of the compact object’s Roche lobe, we obtain . An upper limit to the inclination is provided by the non detection of X-ray eclipses during outburst through i.e. . These constraints to the binary inclination imply a BH mass M M⊙, although we caution that this calculation assumes , based on a scaling relation of the superhump period excess, and requires confirmation. For example, if the mass ratio were the inclination limits would be and the BH mass M M⊙.
Interestingly, our accurate ephemeris allows us also to compute the orbital phase of the dipping episode reported in Kajava et al. (2019). We obtain , thus confirming the X-ray dip was caused by absorption in the disc bulge. We therefore conclude that J1820 is another high-inclination BH dipper, analogous to GRO J1655-40, 4U 1630-47 and MAXI J1659-152 (Kuulkers et al., 1998, 2013).
Muñoz-Darias et al. (2019) presented the discovery of an accretion disc outflow during the hard state of the outburst of J1820. This result, together with previous findings on the long-orbital period ( d) BH transients V404 Cyg and V4641 Sgr (Muñoz-Darias et al. 2016,Muñoz-Darias et al. 2018), shows that winds are likely a common feature of BH transients in outburst. Our determination of a 0.68 d orbital period for J1820, however, seems to indicate that the presence of winds is not limited to the BH transients with the largest accretion discs.
With J1820, there are now 19 Galactic X-ray transients that have been dynamically confirmed to contain a BH. Further progress relies on a dynamical study during true quiescence, when the disc contribution to the total light will have decreased. In particular, higher resolution spectra will permit an accurate evaluation of the rotational broadening and hence the system mass ratio. The orbital inclination may also be further constrained by modelling the ellipsoidal modulation of the companion star at optical and infrared wavelengths. It is interesting to note that our measurement of a systemic velocity km s-1, together with the Gaia DR2 proper motion and distance determinations, implies a large peculiar velocity 100 km s-1 for J1820 (see Figure 8 in Gandhi et al. 2019). A future accurate BH mass determination in J1820 will be important to continue building a potential anti-correlation between BH masses and kick velocities and, thus, help constrain BH formation channels.
5 acknowledgements
We are greatful to the GTC and ING staff, in particular Antonio L. Cabera Lavers and Ian Skillen, for their help to implement the observations presented in this work. We thank the referee for useful comments. We acknowledge support by the Spanish MINECO under grant AYA2017-83216-P. TMD and MAPT acknowledge support via Ramón y Cajal Fellowships RYC-2015-18148 and RYC-2015-17854. PGJ acknowledges funding from the European Research Council under ERC Consolidator Grant agreement no 647208. molly software developed by Tom Marsh is gratefully acknowledged. iraf is distributed by the National Optical Astronomy Observatory, which is operated by the Association of Universities for Research in Astronomy (AURA) under a cooperative agreement with the National Science Foundation. We dedicate this letter to the memory of Jeff E. McClintock.
References
- Baglio et al. (2018) Baglio, M. C., Russell, D. M., & Lewis, F. 2018, The Astronomer’s Telegram, 11418, 1
- Bailyn et al. (1998) Bailyn, C. D., Jain, R. K., Coppi, P., et al. 1998, ApJ, 499, 367
- Belczynski et al. (2012) Belczynski, K., Wiktorowicz, G., Fryer, C. L., Holz, D. E., & Kalogera, V. 2012, ApJ, 757, 91
- Bianchini et al. (2004) Bianchini, A., Mastrantonio, E., Canterna, R., Stute, J. & Cantrell, K. 2004, A&A, 426, 669
- Boyajian et al. (2012) Boyajian, T. S., von Braun, K., van Belle, G., et al. 2012, ApJ, 757, 112
- Casares (2018) Casares, J., 2018, MNRAS, 473, 5195
- Casares & Jonker (2014) Casares, J., & Jonker, P. G. 2014, Space Sci. Rev., 183, 223
- Casares et al. (2017) Casares, J., Jonker, P. G., & Israelian, G. 2017, X-Ray Binaries, 1499
- Cepa et al. (2000) Cepa, J., Aguiar, M., Escalera, V. G., et al. 2000, in Society of Photo-Optical Instrumentation Engineers (SPIE) Conference Series, Vol. 4008, Optical and IR Telescope Instrumentation and Detectors, ed. M. Iye & A. F. Moorwood, 623–631
- Corral-Santana et al. (2016) Corral-Santana, J. M., Casares, J., Muñoz-Darias, T., et al. 2016, A&A, 587, A61
- Ecuvillon et al. (2004) Ecuvillon, A., Israelian, G., Santos, N. C., et al. 2004, A&A, 426, 619
- Ecuvillon et al. (2006) —. 2006, A&A, 445, 633
- Farr et al. (2011) Farr, W. M., Sravan, N., Cantrell, A., et al. 2011, ApJ, 741, 103
- Frank et al. (2002) Frank, J., King, A., & Raine, D. J. 2002, Accretion Power in Astrophysics: Third Edition, 398
- Fryer & Kalogera (2001) Fryer, C. L., & Kalogera, V. 2001, ApJ, 554, 548
- Gandhi et al. (2019) Gandhi, P., Rao, A., Johnson, M. A. C., Paice, J. A., & Maccarone, T. J. 2019, MNRAS, 485, 2642
- Gray (1992) Gray, D. F. 1992, The observation and analysis of stellar photospheres., Vol. 20
- Harlaftis et al. (1997) Harlaftis, E. T., Steeghs, D., Horne, K., & Filippenko, A. V. 1997, AJ, 114, 1170
- Homan et al. (2018) Homan, J., Altamirano, D., Arzoumanian, Z., et al. 2018, The Astronomer’s Telegram, 11576, 1
- Jonker & Nelemans (2004) Jonker, P. G., & Nelemans, G. 2004, MNRAS, 354, 355
- Kajava et al. (2019) Kajava, J. J. E., Motta, S. E., Sanna, A., et al. 2019, arXiv e-prints, arXiv:1906.06519
- Kawamuro et al. (2018) Kawamuro, T., Negoro, H., Yoneyama, T., et al. 2018, The Astronomer’s Telegram, 11399, 1
- Kennea et al. (2018) Kennea, J. A., Marshall, F. E., Page, K. L., et al. 2018, The Astronomer’s Telegram, 11403, 1
- Kolb et al. (2001) Kolb, U., King, A. R., & Baraffe, I. 2001, MNRAS, 321, 544
- Kreidberg et al. (2012) Kreidberg, L., Bailyn, C. D., Farr, W. M., et al. 2012, ApJ, 757, 36
- Kuulkers et al. (1998) Kuulkers, E., Wijnands, R., Belloni, T. Méndez, M., van der Klis, M. & van Paradijs, J. 1998, ApJ, 494, 753
- Kuulkers et al. (2013) Kuulkers, E., Kouveliotou, C., Belloni, T. et al. . 2013, A&A, 552, A32
- Marsh et al. (1994) Marsh, T. R., Robinson, E. L., & Wood, J. H. 1994, MNRAS, 266, 137
- Matsuoka et al. (2009) Matsuoka, M., Kawasaki, K., Ueno, S., et al. 2009, PASJ, 61, 999
- Miller-Jones (2014) Miller-Jones, J. C. A. 2014, PASA, 31, 16
- Montes & Martin (1998) Montes, D., & Martin, E. L. 1998, A&AS, 128, 485
- Muñoz-Darias et al. (2013) Muñoz-Darias, T., Coriat, M., Plant, D. S., et al. 2013, MNRAS, 432, 1330
- Muñoz-Darias et al. (2018) Muñoz-Darias, T., Torres, M. A. P., & Garcia, M. R. 2018, MNRAS, 479, 3987
- Muñoz-Darias et al. (2016) Muñoz-Darias, T., Casares, J., Mata Sánchez, D., et al. 2016, Nature, 534, 75
- Muñoz-Darias et al. (2019) Muñoz-Darias, T., Jiménez-Ibarra, F., Panizo-Espinar, G., et al. 2019, arXiv e-prints, arXiv:1906.04835
- O’Donoghue & Charles (1996) O’Donoghue, D., & Charles, P. A. 1996, MNRAS, 282, 191
- Özel et al. (2010) Özel, F., Psaltis, D., Narayan, R., et al. 2010, ApJ, 725, 1918
- Patterson (2001) Patterson, J. 2001, PASP, 113, 736
- Patterson et al. (2005) Patterson, J., Kemp, J., Harvey, D. A., et al. 2005, PASP, 117, 1204
- Patterson et al. (2018) Patterson, J., Brincat, S., Stone, G., et al. 2018, The Astronomer’s Telegram, 11756, 1
- Repetto & Nelemans (2015) Repetto, S., & Nelemans, G. 2015, MNRAS, 453, 3341
- Russell et al. (2019) Russell, D. M., Baglio, M. C., & Lewis, F. 2019, The Astronomer’s Telegram, 12534, 1
- Shidatsu et al. (2019) Shidatsu, M., Nakahira, S., Murata, K. L., et al. 2019, ApJ, 874, 183
- Tetarenko et al. (2016) Tetarenko, B. E., Sivakoff, G. R., Heinke, C. O., et al. 2016, ApJS, 222, 15
- Tonry & Davis (1979) Tonry, J., & Davis, M. 1979, AJ, 84, 1511
- Tucker et al. (2018) Tucker, M. A., Shappee, B. J., Holoien, T. W. S., et al. 2018, ApJ, 867, L9
- Zurita et al. (2002) Zurita, C., Casares, J., Shahbaz, T., et al. 2002, MNRAS, 333, 791