The GeV emission in the field of the star-forming region W30 revisited
Abstract
We present a detailed study of the -ray emission from the direction of the star-forming region W30 based on a decade of the Fermi Large Area Telescope data in the 0.3–300 GeV photon energy range. The morphological and spectral analyses allow us to resolve the -ray emission into two extended structures from different origins. One of them mostly overlaps with the supernova remnant (SNR) G8.70.1 and has a soft spectrum that resembles with the spectra of other middle-aged SNRs interacting with molecular clouds. The other shows remarkable spatial and spectral consistency with the TeV emission from HESS J1804216, and its spectrum could be naturally explained by inverse Compton scattering of electrons like a number of TeV -ray emitting pulsar wind nebulae. Thus we attribute this source to the nebula around the pulsar PSR J18032137.
1 Introduction
Supernova remnants (SNRs) and pulsar wind nebulae (PWNe) are the two largest classes of extended -ray sources. In recent years, dozens of SNRs and PWNe have been observed both in GeV (e.g., Abdo et al., 2010a; Acero et al., 2016, 2015) and TeV (e.g., H.E.S.S. Collaboration et al., 2018a, b) -ray bands. PWNe are characterized by similar spectral shapes over their lifetime, typically between and kyr; however, SNRs show different spectral features at different epochs of their evolution. The young SNRs, with an age of hundreds to thousands years, are observed with hard -ray spectra up to the TeV range; while the middle-aged SNRs, with an age of about kyr, interacting with nearby molecular clouds (MCs), are bright GeV -ray emitters with steep energy spectra (see, e.g., Li & Chen, 2012; Yuan et al., 2012; Tang, 2019; Zeng et al., 2019).
G8.70.1 is a middle-aged SNR associated with the massive star-forming region W30 (Ojeda-May et al., 2002), which also contains several H II regions along the southern boundary of the SNR (Blitz et al., 1982). At radio wavelengths, G8.70.1 has a large shell with a diameter of 45′ and a spectral index of (Kassim & Weiler, 1990). A ROSAT observation discovered a thermal X-ray plasma, K, filled in the northern region of the remnant (Finley & Oegelman, 1994). The distance and age of G8.70.1 were obtained by several methods. Based on kinematic distances to the H II regions associated with the SNR, the distance was estimated to be kpc (Kassim & Weiler, 1990; Brand & Blitz, 1993). By applying a Sedov solution (Sedov, 1959; Hamilton et al., 1983) from the observed X-ray temperature and the angular radius, Finley & Oegelman (1994) derived the distance to be 3.2–4.3 kpc and the age to be 15–28 kyr under the assumption of an initial explosion energy of erg. From the surface brightness–age relation in the radio band, Odegard (1986) estimated the age kyr. A bright OH (1720 MHz) maser detected at along the eastern edge of G8.70.1 (Hewitt & Yusef-Zadeh, 2009) indicates that the SNR is interacting with MCs at a kinematic distance of 4.5 kpc. In this paper, we adopt a distance of 4.5 kpc and an age of 15 kyr.
The W30 region also harbors PSR J18032137 (B180021), which is a young and energetic Vela-like pulsar, first discovered through a radio survey conducted by Clifton & Lyne (1986). Given the measured spin period ( ms) and spin period derivative (), its characteristic age , defined as , is kyr, and spin-down luminosity [), where is the moment of inertia in units of g cm2] is ergs s-1 (Brisken et al., 2006). Its dispersion measure distance is kpc. Thus, we adopt kpc for PSR J18032137 throughout this paper. According to Cordes & Lazio (2002), the corresponding spin-down flux is cm-2 erg s-1, where . X-ray emission from PSR J18032137 and its synchrotron nebula was reported from observations with Chandra by Cui & Konopelko (2006) and Kargaltsev et al. (2007). Besides, the PSR J18032137 seems to move toward SNR G8.70.1 (Brisken et al., 2006), which makes the association between the pulsar and the SNR very unlikely.
Extended GeV emission from W30 region has been detected by the Fermi Large Area Telescope (LAT; Ajello et al. 2012). An extended TeV source HESS J1804216 has also been detected by the High Energy Stereoscopic System (H.E.S.S) toward the W30 complex (Aharonian et al., 2006), whose origin and connection to the GeV source is not yet established. Furthermore, Ackermann et al. (2017) found that the morphology of the GeV emission show significant energy dependence. Such an energy dependence can be an intrinsic feature of the sources but can also be caused by the confusion of two or more sources along the line of sight. Such a confusion can be resolved by the improvement of the instrument angular resolution, as well as from the analysis of the energy distribution. In this paper, we report the detailed analysis of yr Fermi-LAT data from the vicinity of the W30 complex. We confirm the energy-dependent morphology of the GeV -ray emission and find huge divergence of spectral properties in different parts of the extended emission. Thus, we argue that the extended emission consists of two different components, most likely related to different sources—the SNR G8.70.1 and the nebula surrounding the pulsar PSR J18032137.
2 Fermi-LAT Data Analysis
The LAT on board Fermi is a -ray imaging instrument that detects photons in a broad energy range from 20 GeV to more than 300 GeV. Its angular resolution, i.e., point-spread function (PSF), improves with photon energy, from at 100 MeV, to at 1 GeV (Atwood et al., 2009). In this study, we analyze more than 10 yr (from 2008 August 04 15:43:36 (UTC) to 2019 April 03 06:01:37 (UTC)) of Fermi-LAT Pass 8 data in the energy range 0.3-300 GeV using the software Fermitools111https://fermi.gsfc.nasa.gov/ssc/data/analysis/software/. The region of interest (ROI) is a square in the equatorial coordinate system (J2000, which is adopted throughout the text) centered at the position of the W30 complex. We only select events within a maximum zenith angle of 90∘ to filter out the background -rays from the Earth’s limb and apply the recommended filter string “()” in gtmktime to choose the good time intervals. The instrument response functions (IRFs) are “P8R3_SOURCE_V2_v1” for SOURCE events (evclass=128, evtype=3) and “P8R3_CLEAN_V2_PSF3_v1” for PSF3 events (evclass=256, evtype=32). The source list is based on the newly released the fourth Fermi-LAT source catalog (4FGL; The Fermi-LAT collaboration 2019) and generated by make4FGLxml.py222https://fermi.gsfc.nasa.gov/ssc/data/analysis/user/make4FGLxml.py. It consists of all spectral and spatial parameters of the 4FGL sources whose positions are within a radius of 25∘ centered at W30 as well as the Galactic diffuse background emission (gll_iem_v07.fits) and isotropic emission (iso_P8R3_SOURCE_V2_v1.txt for SOURCE events or iso_P8R3_CLEAN_V2_PSF3_v1.txt for PSF3 events). We use gtlike to perform the binned likelihood analysis and record the best-fit results until the optimizer NEWMINUIT successfully converged. We only free the spectral parameters of the sources within from ROI center with the significance and the normalization parameters of the two diffuse background components while fitting the source models. Additional adjustment to the model files in the following analyses will be noted in the text.
2.1 Spatial Analysis
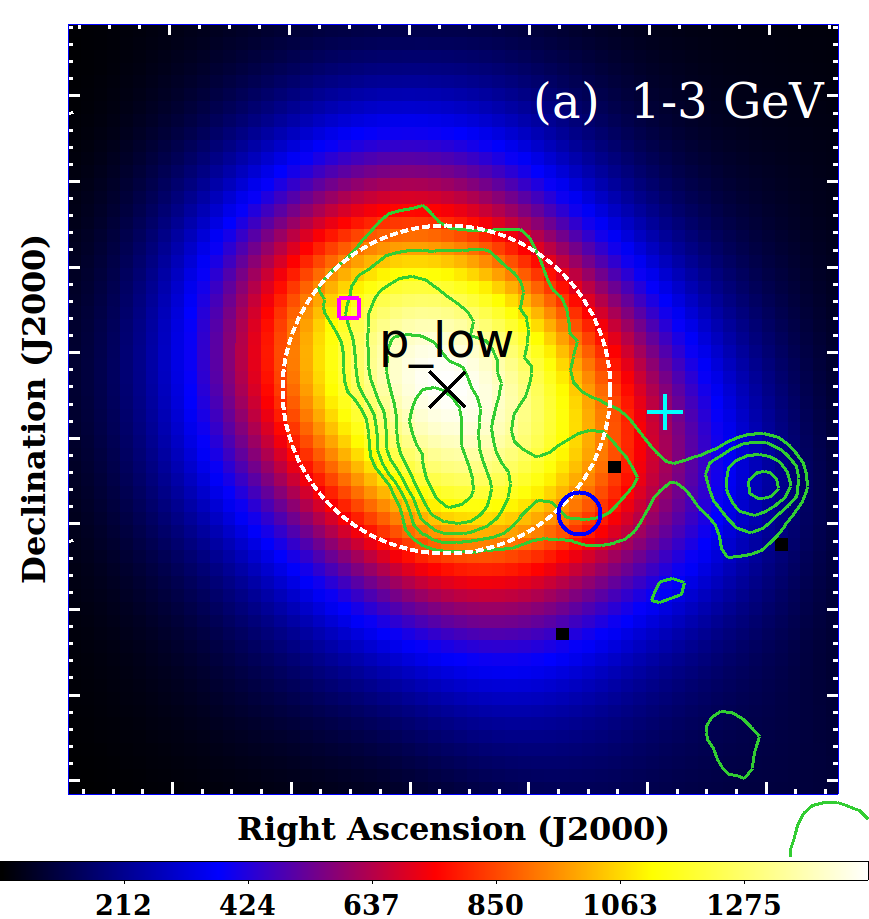
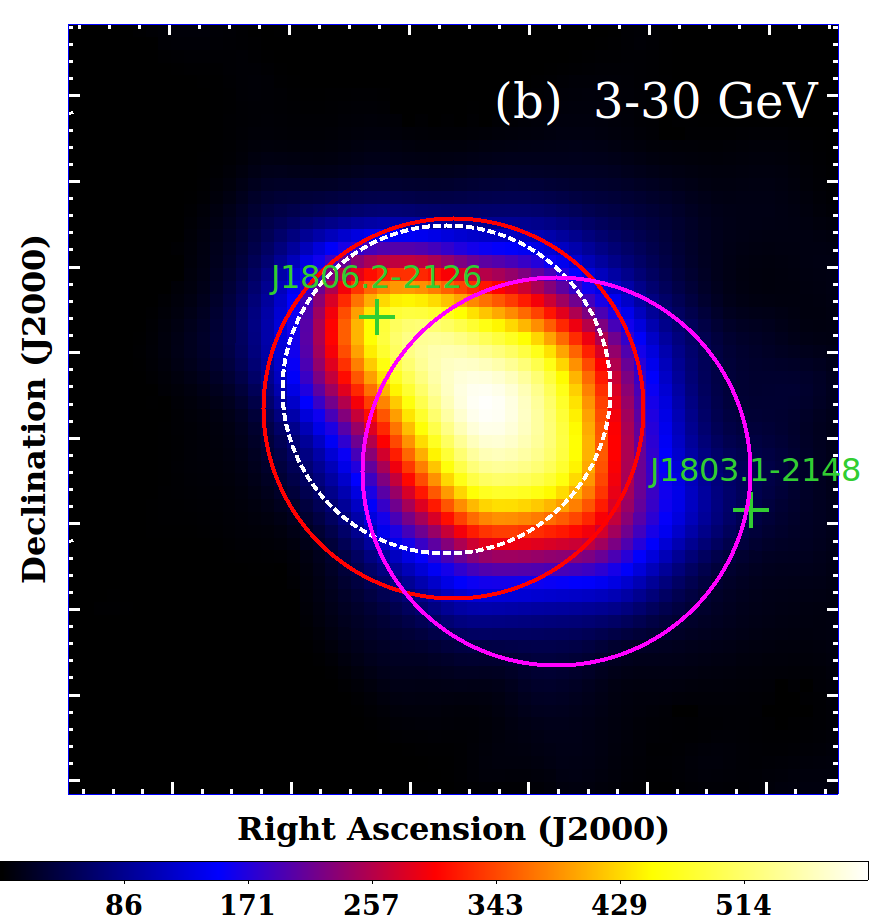
First, we perform binned likelihood analysis in three energy ranges—1–3 GeV, 3–30 GeV, and 30–300 GeV (hereafter referred to as the low, medium, and high energy range respectively)—for further research into the energy-dependent behavior of the -ray emission around W30 (Ackermann et al., 2017). In the low energy range, only the PSF3 events, of which the quality of the reconstructed direction is the best, are selected to reduce uncertainties caused by large PSF. In the medium or high energy range, the SOURCE events are collected in order to have sufficient counts for the statistic analysis. After the binned likelihood analyses, we subtract the 4FGL sources that are located within radius 1∘ of the ROI center and not clearly associated with other objects. We notice that 4FGL indicates that 4FGL J1806.22126 is possibly associated with pulsar PSR J18062125 or W30 but does not firmly identify it. However, PSR J18062125 whose erg s-1 and distance is kpc (Manchester et al., 2005), seems incapable of powering such a bright -ray source that has a flux of erg cm-2 s-1. Thus we subtract W30 (4FGL J1805.62136e), HESS J1804216 (4FGL J1808.22028e), and 4FGL J1806.22126 from the best-fit background models. Furthermore, all the parameters except for the normalization parameter of the Galactic diffuse background component are fixed to their best-fit values. Finally, we generate the residual test-statistic (TS) maps in the three energy ranges using these adjusted background models.
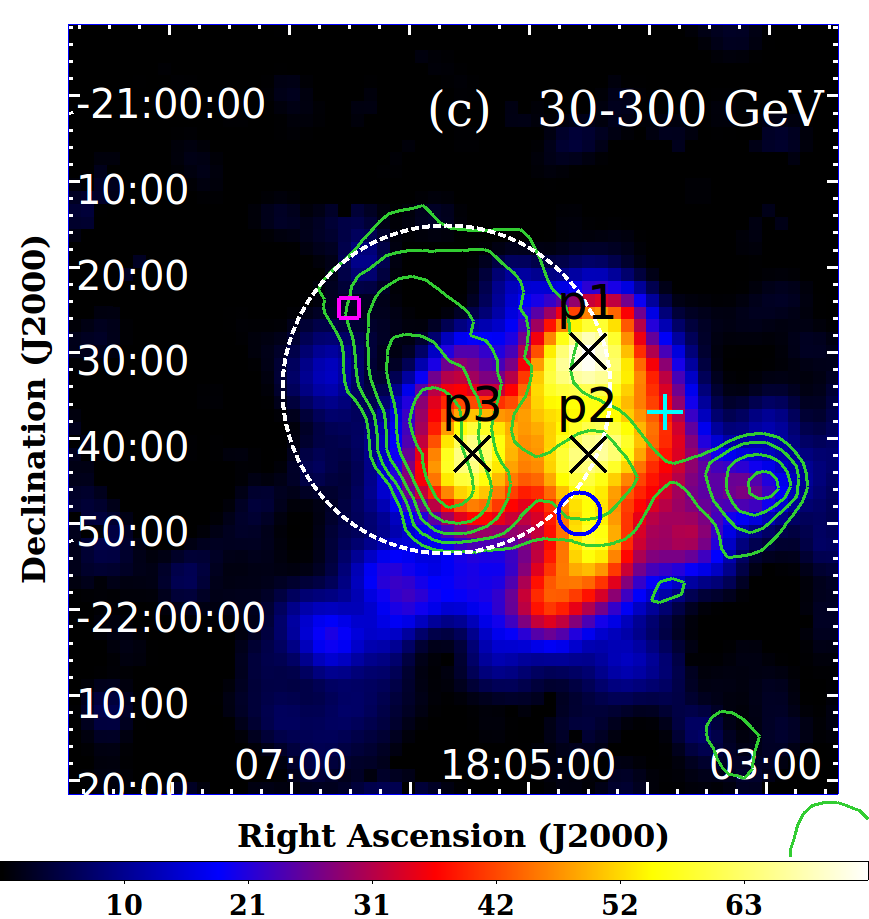
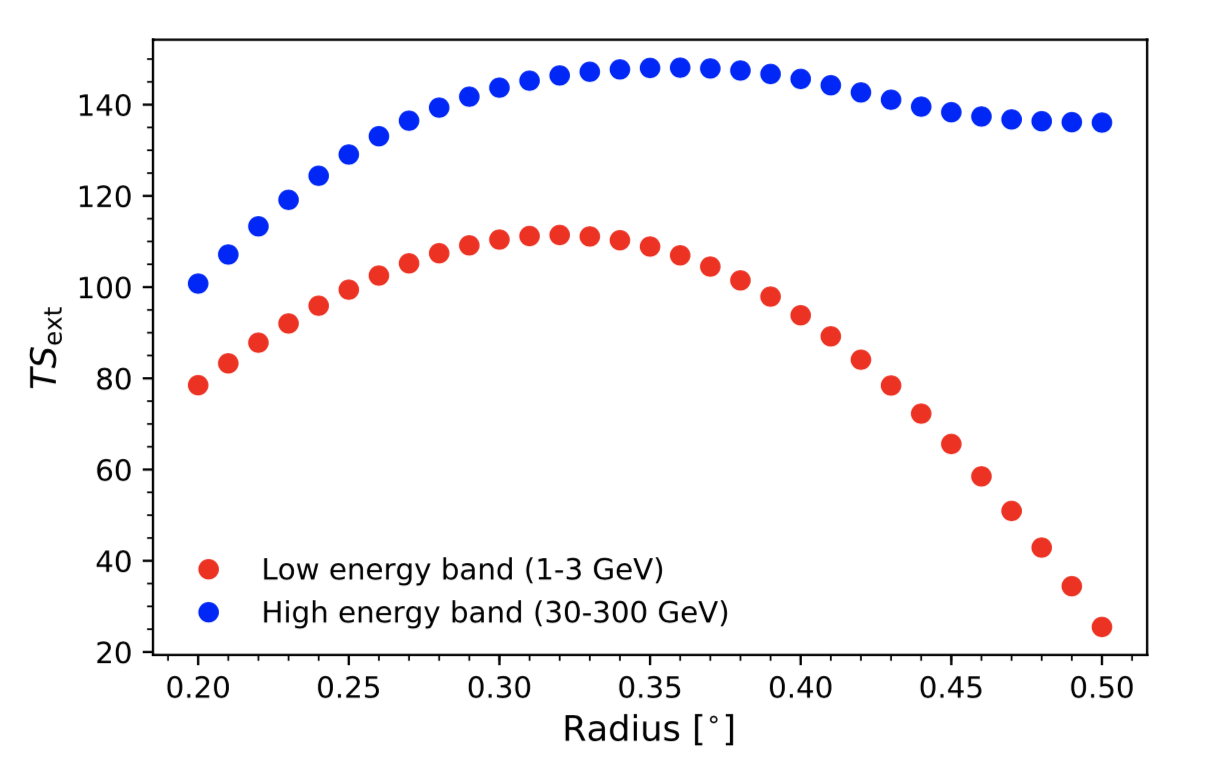
The TS maps in Figure 1 show that the spatial distribution of -rays in the W30 region does vary with photon energy. As the photon energies go higher, the emission centroid shifts from northeast to southwest, and the -ray morphology changes from smooth diffusion to irregular distribution. Aiming to disentangle the confusion around W30, we apply specific likelihood-ratio tests on different -ray distribution hypotheses in both low and high energy ranges. The significance of each hypothesis is evaluated by the test statistic TS, in which is the likelihood of the null hypothesis and is the likelihood of the hypothesis being tested. The statistical significance can be approximated by Wilks’ theorem (Wilks, 1938), which equals . Following the definition and method in Lande et al. (2012), we test the extension significance of -ray emission by comparing the likelihood of a uniform disk hypothesis () with that of a point-like source hypothesis (). The -ray source is considered to be significantly extended only if its ) is . The tested radius () of the uniform disk template varies from to with a step of . In the above tests, we only free the normalization parameters of the 4FGL sources within of the ROI center with significance and the normalization parameters of the two diffuse background components. Besides, the spectra of any newly added sources are modeled with a power law (PL) with the index and normalization parameters left free.
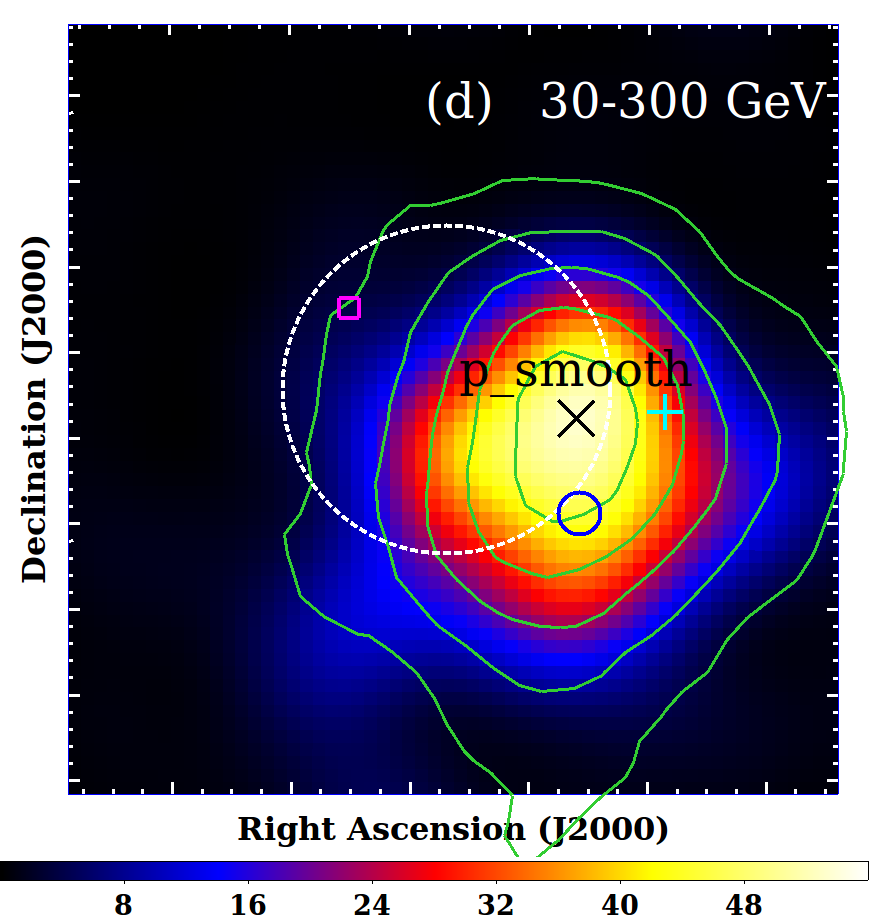
As can be seen in Figure 1, the residual -rays with energy below 3 GeV mostly overlap with G8.70.1 and only show one peak TS pixel (), however, the -rays in high energy range have three close peak TS pixels, , and , which may be caused by statistical fluctuation or the exits of several point-like sources. On the one hand, we place the point-like source and the disk center at to perform the extension test of the low energy range and set the position of the point-like source and disk center at the peak TS pixel in the smoothed TS map for the extension test of the high energy range. On the other hand, the combinations of two or three point-like sources located at , and are checked for the possible existence of several sources in the high energy range. Moreover, we test the spatial templates derived from the HESS J1804216 significance map measured by H.E.S.S. (Aharonian et al., 2006) to evaluate the correlation between the GeV -ray emission and the TeV -ray emission. Finally, we compare the likelihoods of the above templates with the spatial model of W30 and HESS J1804216 from 4FGL to see whether or not there are notable improvements . We list the coordinates and TS values of these peak pixels in Table 2 and depict the extension test results in the low and high energy ranges in Figure 2. The TS values of the best-fit uniform disk templates and other hypotheses are listed in Table 1. In short, in the low energy range, the best-fit spatial model is the uniform disk template with 333The uncertainties are determined at where the is lower than the maximum by 1 according to the distribution. centered at , of which the corresponding to a significance of ; meanwhile, in the high energy range, none of the tested hypotheses show a considerable improvement compared to the HESS J1804216 template from 4FGL.444A uniform disk with a radius of located at , However, it is worth mentioning that the likelihood ratio for HESS significance image of HESS J1804216 is comparable with the HESS J1804216 template from 4FGL and better than the best-fit uniform disk template, which implies a morphological correlation between the high energy GeV -rays and TeV -rays around HESS J1804216. Last but not least, the likelihood of the source model does not increase notably when 4FGL source HESS J1804216 is added in the low energy range or W30 added in the high energy range, which means the contribution from HESS J1804216 is negligible in the low energy range and W30 is dim in the high energy range. Due to the spatial correlation, we argue that the GeV emission of HESS J1804216 has the same origin of the TeV emission. However, we cannot rule out that they are produced by different sources, especially given that the multiwavelength studies of the region are incomplete.
2.2 Spectral Analysis
We choose the SOURCE events (evclass=128) with energy between 0.3 GeV and 300 GeV to perform spectral analysis for a comprehensive understanding of the -ray emission toward the W30 complex. Next, we modify the source model according to the results from the spatial analysis, which includes the deletion of source 4FGL J1806.22126 and the replacement of the spatial template of W30 from 4FGL by the uniform disk template (radius) centered at . As for HESS J1804216, we keep the spatial model from 4FGL. Next, we fit the whole data in the 0.3–300 GeV energy range, setting the spectral type of W30 and HESS J1804216 to be PL as the null hypothesis. Then, we change the spectral type of W30 to LogParabola (LogP), BrokenPowerLaw (BPL), and PLSuperExpCutoff (PLEC), respectively, to find which formula fits the data best; meanwhile, the spectrum type of HESS J1804216 remains to be PL. After this, we keep the best choice for W30 and change the spectral type of HESS J1804216 to LogP, BPL, and PLEC, respectively, to find the best spectral formula for HESS J1804216. The formulae of these spectra are presented in Table 3. The spectral type is favored if it has the largest defined as . As shown in Table 4, the spectrum of W30 prefers a BPL distribution and the spectrum of HESS J1804216 is better presented by LogP. The best-fit spectral parameters of W30 and HESS J1804216 are listed in Table 5. At last, by applying the best-fit spatial and spectral models in the 0.3–300 GeV energy range, we obtain a detection significance of and a luminosity of erg s-1 for W30, where the kpc is the distance to G8.70.1 in units of a reference value 4.5 kpc; and for HESS J1804216, we get a detection significance of and a luminosity of erg s-1.
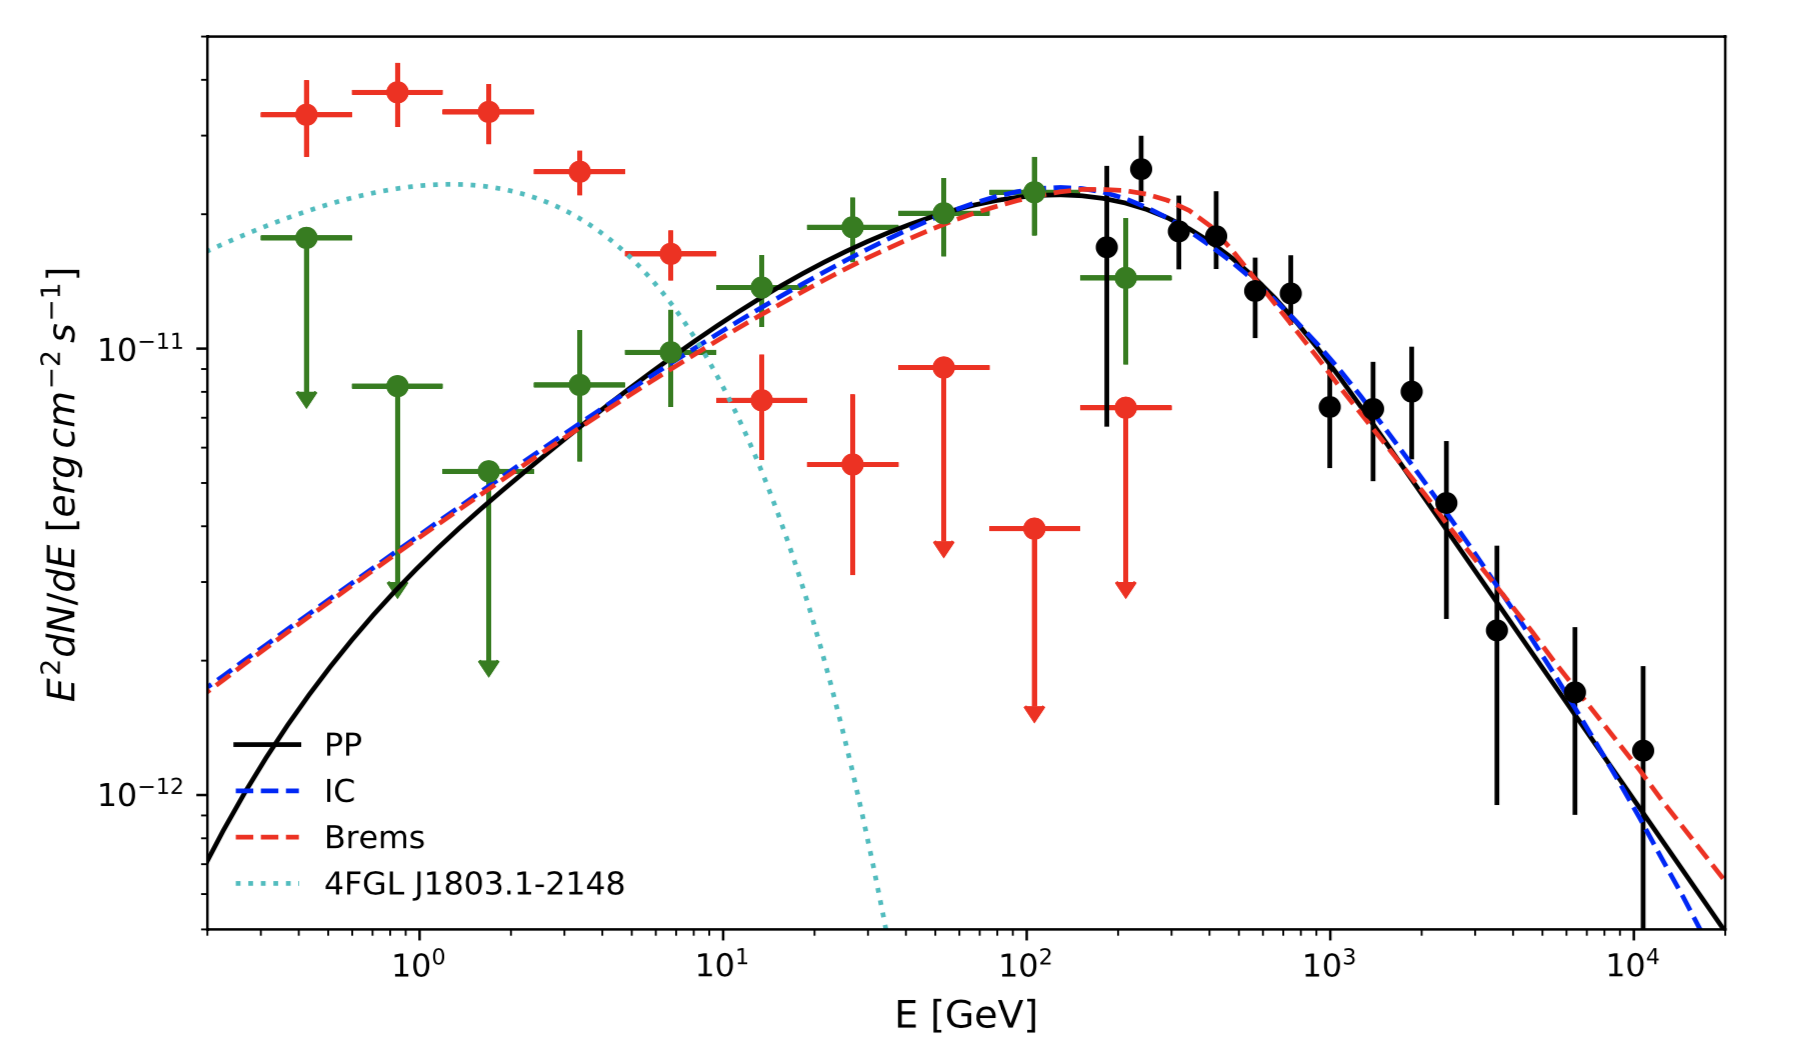
The spectral energy distributions (SEDs) of W30 and HESS J1804216 were extracted from the maximum likelihood analysis of the SOURCE events in 10 logarithmically spaced energy bins within 0.3–300 GeV. During the fitting process, the free parameters only include the normalization parameters of the sources with the significance within from ROI center as well as the Galactic and isotropic diffuse background components, while all the other parameters are fixed to their best-fit values from the above analysis in the whole energy (0.3–300 GeV) range. In addition, following the method from Abdo et al. (2009), we estimate the uncertainty caused by the imperfection model of the Galactic diffuse background by artificially varying its normalization by from the best-fit value of each energy bin, and record the maximum flux deviation of the source due to above changes as the systematic error. In those energy bins where the TS value of W30 or HESS J1804216 is smaller than 16, we calculate the upper limit of its flux. Although the first data bin of HESS J1804216 has a flux with TS value 47.1, we calculate the upper limit for the SED modeling, concerning the potential influence from the -ray pulsar 4FGL J1803.12148, which is overlapped by HESS J1804216 along the line of sight and very bright from 0.3 to 10 GeV. The SEDs of W30 and HESS J1804216 in GeV together with the H.E.S.S. measurements of HESS J1804216 in TeV are shown in Figure 3.
As shown in Figure 3, the spectrum of W30 is softer and far below the H.E.S.S. measurements at higher energies and the LAT spectrum of HESS J1804216 is smoothly connected to the H.E.S.S measurements. Such spectral discrepancy between W30 and HESS J1804216 is consistent with their energy-dependent morphological behavior, both reveal the domination of W30 in the lower energy range ( GeV) and very likely correlation between GeV observation and TeV measurement on HESS J1804216 .
3 Discussion
The above studies on the spatial and spectral properties of the diffuse -rays around W30 complex reveal their strong energy-dependent behavior. As a result, we distinguish them into two separate extended components: one of them, namely W30, is mostly overlapped with the G8.70.1 and compatible with the size of the SNR; the second one, namely HESS J1804216, shows both spatial and spectral consistency with the TeV measurement. So we will involve the radio emission of the entire G8.70.1 region (Kassim, 1992) in the SED modeling of -ray emission from W30 and fit the LAT and H.E.S.S. data together to model the -rays from HESS J1804216.
3.1 Interpreting the SEDs of W30 and HESS J1804216
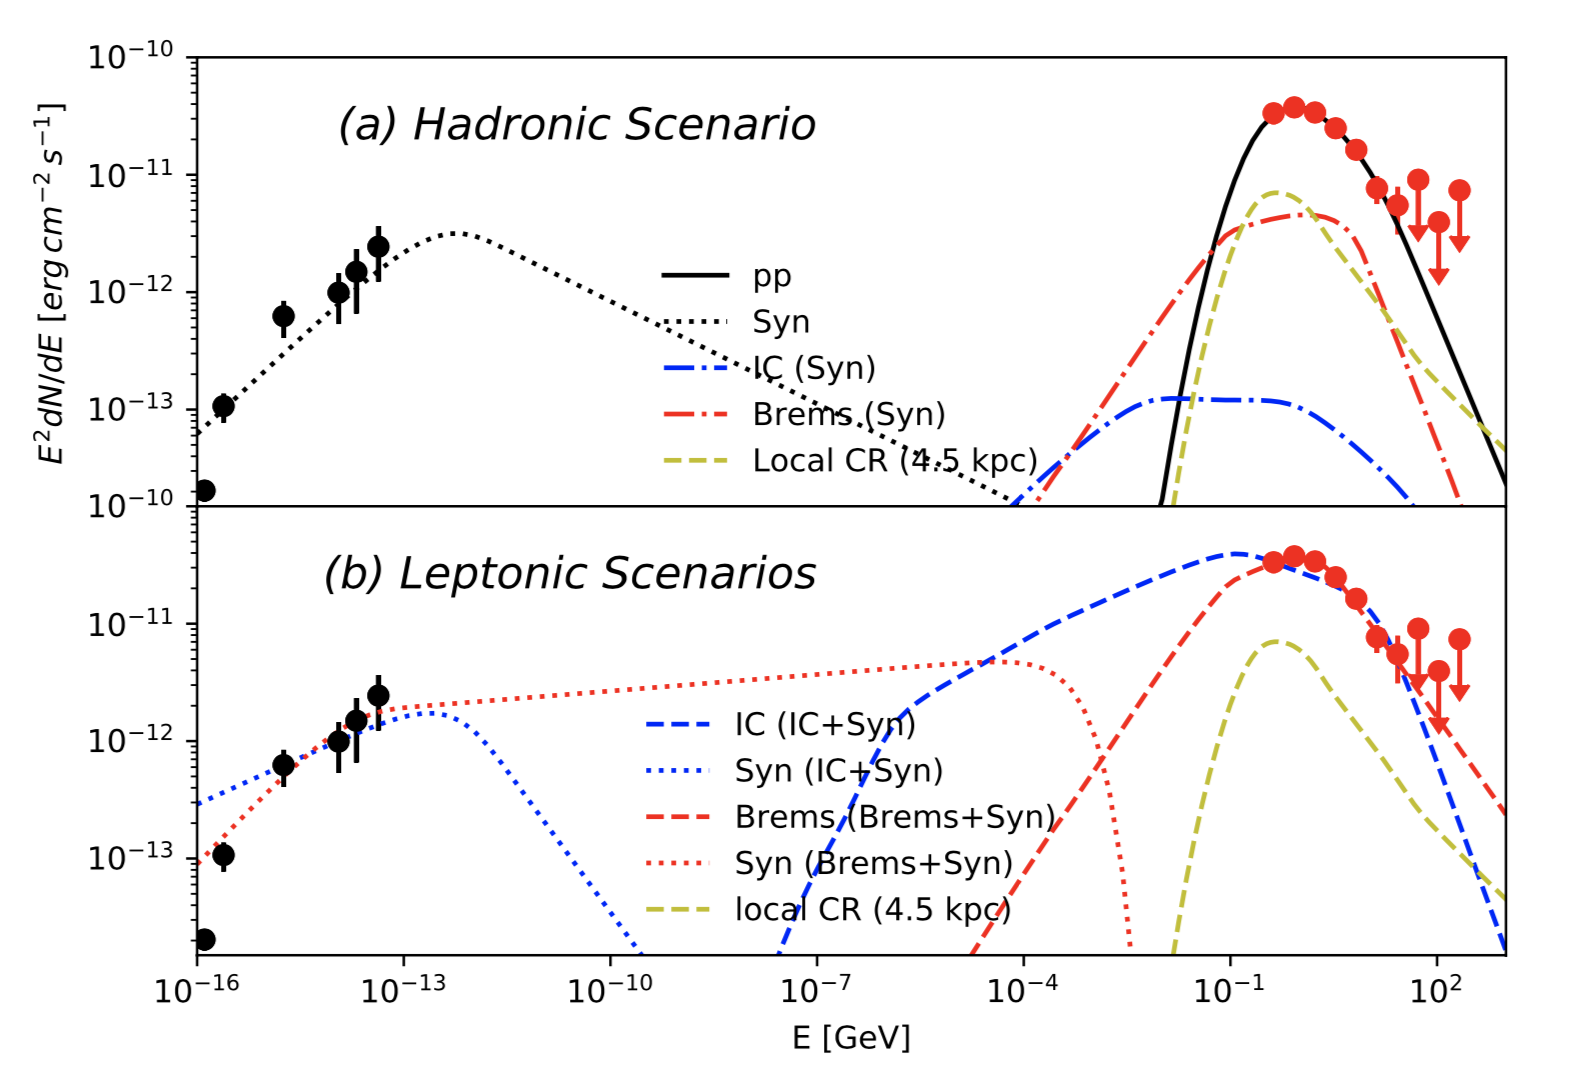
To understand the origin of -rays from W30 and HESS J1804216, we use the Naima package (Zabalza, 2015) for modeling the SEDs presented in Figure 4 and Figure 3. Naima allows Markov Chain Monte Carlo (MCMC) fitting using emcee (Foreman-Mackey et al., 2013) while computing nonthermal radiation from relativistic particle populations. The likelihood function () of a given model can be related to the parameter as , so the maximization of the log-likelihood is equivalent to a minimization of 555https://naima.readthedocs.io/en/latest/mcmc.html.
In the hadronic scenario, we assume that the -rays mainly originate from the decay of mesons produced by the interactions of relativistic protons with the ambient gas (pp model). Besides, we fit the radio data of G8.70.1 independently with synchrotron radiation (Syn model), then calculate the corresponding inverse Compton (IC) and nonthermal bremsstrahlung radiation from the same electron population to compare their possible contribution to that of the interactions. In principle the magnetic field cannot be derived from a hadronic model, but as in Ajello et al. (2012) we also assume , which can be caused by the compression of gas in the MCs near the SNR shocks. In the leptonic scenario, we assume the radio emission from the entire region of G8.70.1 (Kassim, 1992) and -rays from W30 are generated by the same electron population. Their interaction with the magnetic field, i.e., the synchrotron radiation, accounts for the radio emission; meanwhile, the IC scattering of low energy photons (IC+Syn model) or nonthermal bremsstrahlung radiation via interacting with thermal particles (Brems+Syn model). Note that we exclude the first two data points of the radio spectrum during the whole fitting process, in the consideration of the low-frequency turnover caused by the the absorption from the foreground H II regions (Kassim, 1992). As for GeV and TeV -ray emission from HESS J1804216, we try to reproduce the spectrum assuming these -rays are generated via relativistic electrons IC scattering of soft photons (IC model) or nonthermal bremsstrahlung radiation (Brem model). We also test the pp model to see whether a hadronic origin is possible or not.
For the interaction, we use the cross-sections from Kafexhiu et al. (2014) and set the value of , the average number density of the target proton, to be 100 , which is a reasonable value given the total molecular mass in the W30 region ( 105 , Takeuchi et al. (2010)). We use the parameterization in Aharonian et al. (2010) to calculate the synchrotron radiation. To model the bremsstrahlung radiation, we use the approximation from Baring et al. (1999) assuming the total ion number density is 100 . The formulae from Khangulyan et al. (2014) are applied for the calculation of IC radiation. The seed photon field for relativistic electrons to scatter includes the Cosmic Microwave Background, far infrared emission from dust, and starlight. The later two components are adopted from the local interstellar radiation field calculated by Popescu et al. (2017). The parent particle distribution functions in energy, which include PL, Exponential-Cutoff PowerLaw (ECPL), and BPL together with the corresponding free parameters in the fitting process are listed in Table 3. The required total energies in electrons and protons, and , are calculated for particles with energy above 1 GeV. The SED modeling results of W30 and HESS J1804216 are listed in Table 6 and Table 7, respectively. And the best-fit results of different models are illustrated in Figure 4 and Figure 3.
3.2 Origin of -ray Emission from W30 and HESS J1804216
Figure 4 demonstrates a suppression in low energy in the SED of W30, although it is not significant enough to claim a pion-bump feature. In the middle-aged SNRs interacting with MCs, interactions are indeed regarded as the main mechanism of -ray emission. They already have been seen in other SNRs interacting with MCs such as W44, IC 433, and Kes 41. All of them show soft GeV spectra with PL photon indices and the 1–100 GeV luminosities in the order of erg s-1 (e.g., Abdo et al., 2010a, b; Ackermann et al., 2013; Liu et al., 2015, Table 3 therein). We find that the BPL type proton distribution fits the -ray data best. In the BPL fitting, the break energy is GeV above which the proton index is softened from about to . The derived proton spectrum is very similar to that of W44 (Ackermann et al., 2013). To explain the similar energy break in W44, Malkov et al. (2011) argued that, in a dense environment near the interacting SNR, strong ion–neutral collisions in an adjacent MC lead to Alfvén wave evanescence, which introduces fractional particle losses and results in the steepening of the energy spectrum of accelerated particles by exactly one power. The bright OH (1720 MHz) maser detected along the eastern edge of W30 (Hewitt & Yusef-Zadeh, 2009) reveals that SNR G8.70.1 is interacting with nearby MCs. Thus the same mechanism may apply here and provide a satisfactory explanation of the energy break. The total energy required proton energy is estimated to be erg assuming for the target proton density of at a distance of 4.5 kpc.
On the other hand, we cannot rule out the IC or bremsstrahlung origin of the -ray emissions. In both cases the BPL distribution of relativistic electrons is favored. However, for the IC model the derived energy budget for the relativistic electrons is as high as erg, which is almost 10% of the typical kinetic energy of a supernova explosion ( erg). For bremsstrahlung origin a relatively large ratio of electrons to protons, , is required. This is much larger than the fiducial value predicted by the diffusive shock acceleration theory (Bell, 1978) and observed at Earth. Although this possibility cannot be excluded (see, e.g., Merten et al., 2017).
It should be noted that there is another possible particle accelerator located at the western boundary of W30, G8.300.0. It is a shell-like small size () SNR initially identified in 20 cm emission by Helfand et al. (2006). Recently, Kilpatrick et al. (2016) reported the detection of broad molecular line regions along the western boundary of this SNR, suggesting interactions between G8.300.0 and the MC at a systematic velocity near at a distance of kpc, which is consistent with the distance obtained from the brightness-to-diameter relation. Assuming that the -rays of W30 are emitted from a distance of 16 kpc and the target proton density is , the energy budget for the parent protons of interaction is erg, which is too high for an ordinary SNR. This makes the association between G8.300.0 and the -ray emission unlikely.
It has been proposed in the paper of H.E.S.S. Collaboration et al. (2018b), that HESS J1804216 is a PWN powered by the pulsar PSR J18032137. The Fermi-LAT data extend the spectrum to lower energy. From the fitted results we found a broken PL type spectrum of electrons under the assumption that the GeV–TeV -ray emission is due to the IC scattering. Taking into account the age of about 16 kyr and the break energy of about 1 TeV, the magnetic field should be close to . The Brems model and the pp model could also fit the spectral data, but both require a very dense environment () and extremely hard spectrum (with an index of about 1.5) for the parent particles, which makes them quite unlikely.
4 Summary
In this paper we present a detailed analysis based on about 10 yr data of Fermi-LAT observations of the W30 region. We resolve the emission in this region into two extended -ray sources. One source reveals a soft -ray spectrum with a pion-bump-like spectral feature. This is similar to the spectra of other middle-aged SNRs interacting with MCs. We attribute it to the SNR W30 (G8.70.1) itself. The parent proton spectrum is best fitted as a broken PL with a break at about 30 GeV, which can be explained by the fractional particle loss due to Alfvén wave evanescence in the dense molecular region (Malkov et al., 2011). The second source shows a significantly harder spectrum, and coincides with the H.E.S.S. source HESS J1804216 not only in the spatial distribution but also in the spectral distribution. The GeV–TeV emission of HESS J1804216 can be explained naturally by the one-zone model of cooling dominated PWN, which is most likely illuminated by PSR J18032137. We note that the W30 complex is also an active star-forming region. Such kind of systems are already identified as potential efficient CR accelerators (see, e.g,, Aharonian et al., 2019; Ackermann et al., 2011; Katsuta et al., 2017) and all reveal extended -ray emission with hard spectrum. The derived -ray emission from W30, however, has a much softer spectrum. Thus, we attribute the GeV emission to the SNR itself. However, we cannot rule out the high energy emission of HESS J1804216 may partly come from the CRs accelerated in the star-forming region.
The overlap of -ray sources could be common for the galactic disk, due to the extended nature of sources and the limited angular resolution of telescopes, especially in crowded regions as the star-forming regions. Thus additional care must be taken in explaining the origin of -ray emission in such regions. The forthcoming Cerenkov Telescope Array (CTA; Actis et al. 2011, with a larger field of view, better angular and energy resolutions, and better sensitivity compared to Fermi-LAT and current Cerenkov telescopes, should be able to effectively separate these accidentally overlapping diffuse structures. And, of course, a thorough multiwavelength study of such regions would be important to pin down their nature.
References
- Abdo et al. (2009) Abdo, A. A., Ackermann, M., Ajello, M., et al. 2009, ApJ, 706, L1
- Abdo et al. (2010a) —. 2010a, Science, 327, 1103
- Abdo et al. (2010b) —. 2010b, ApJ, 712, 459
- Acero et al. (2015) Acero, F., Ackermann, M., Ajello, M., et al. 2015, ApJS, 218, 23
- Acero et al. (2016) —. 2016, ApJS, 224, 8
- Ackermann et al. (2011) Ackermann, M., Ajello, M., Allafort, A., et al. 2011, Science, 334, 1103
- Ackermann et al. (2013) Ackermann, M., Ajello, M., Allafort, A., et al. 2013, Science, 339, 807
- Ackermann et al. (2017) Ackermann, M., Ajello, M., Baldini, L., et al. 2017, ApJ, 843, 139
- Actis et al. (2011) Actis, M., Agnetta, G., Aharonian, F., et al. 2011, Experimental Astronomy, 32, 193
- Aharonian et al. (2019) Aharonian, F., Yang, R., & de Oña Wilhelmi, E. 2019, Nature Astronomy, arXiv:1804.02331
- Aharonian et al. (2006) Aharonian, F., Akhperjanian, A. G., Bazer-Bachi, A. R., et al. 2006, ApJ, 636, 777
- Aharonian et al. (2010) Aharonian, F. A., Kelner, S. R., & Prosekin, A. Y. 2010, Phys. Rev. D, 82, 043002
- Ajello et al. (2012) Ajello, M., Allafort, A., Baldini, L., et al. 2012, ApJ, 744, 80
- Atwood et al. (2009) Atwood, W. B., Abdo, A. A., Ackermann, M., et al. 2009, ApJ, 697, 1071
- Baring et al. (1999) Baring, M. G., Ellison, D. C., Reynolds, S. P., Grenier, I. A., & Goret, P. 1999, ApJ, 513, 311
- Bell (1978) Bell, A. R. 1978, MNRAS, 182, 147
- Blitz et al. (1982) Blitz, L., Fich, M., & Stark, A. A. 1982, ApJS, 49, 183
- Brand & Blitz (1993) Brand, J., & Blitz, L. 1993, A&A, 275, 67
- Brisken et al. (2006) Brisken, W. F., Carrillo-Barragán, M., Kurtz, S., & Finley, J. P. 2006, ApJ, 652, 554
- Clifton & Lyne (1986) Clifton, T. R., & Lyne, A. G. 1986, Nature, 320, 43
- Cordes & Lazio (2002) Cordes, J. M., & Lazio, T. J. W. 2002, arXiv e-prints, astro
- Cui & Konopelko (2006) Cui, W., & Konopelko, A. 2006, ApJ, 652, L109
- Finley & Oegelman (1994) Finley, J. P., & Oegelman, H. 1994, ApJ, 434, L25
- Foreman-Mackey et al. (2013) Foreman-Mackey, D., Hogg, D. W., Lang, D., & Goodman, J. 2013, PASP, 125, 306
- Hamilton et al. (1983) Hamilton, A. J. S., Sarazin, C. L., & Chevalier, R. A. 1983, ApJS, 51, 115
- Helfand et al. (2006) Helfand, D. J., Becker, R. H., White, R. L., Fallon, A., & Tuttle, S. 2006, AJ, 131, 2525
- H.E.S.S. Collaboration et al. (2018a) H.E.S.S. Collaboration, Abdalla, H., Abramowski, A., et al. 2018a, A&A, 612, A3
- H.E.S.S. Collaboration et al. (2018b) —. 2018b, A&A, 612, A2
- Hewitt & Yusef-Zadeh (2009) Hewitt, J. W., & Yusef-Zadeh, F. 2009, ApJ, 694, L16
- Kafexhiu et al. (2014) Kafexhiu, E., Aharonian, F., Taylor, A. M., & Vila, G. S. 2014, Phys. Rev. D, 90, 123014
- Kargaltsev et al. (2007) Kargaltsev, O., Pavlov, G. G., & Garmire, G. P. 2007, ApJ, 660, 1413
- Kassim (1992) Kassim, N. E. 1992, AJ, 103, 943
- Kassim & Weiler (1990) Kassim, N. E., & Weiler, K. W. 1990, ApJ, 360, 184
- Katsuta et al. (2017) Katsuta, J., Uchiyama, Y., & Funk, S. 2017, ApJ, 839, 129
- Khangulyan et al. (2014) Khangulyan, D., Aharonian, F. A., & Kelner, S. R. 2014, ApJ, 783, 100
- Kilpatrick et al. (2016) Kilpatrick, C. D., Bieging, J. H., & Rieke, G. H. 2016, ApJ, 816, 1
- Lande et al. (2012) Lande, J., Ackermann, M., Allafort, A., et al. 2012, ApJ, 756, 5
- Langston et al. (2000) Langston, G., Minter, A., D’Addario, L., et al. 2000, AJ, 119, 2801
- Li & Chen (2012) Li, H., & Chen, Y. 2012, MNRAS, 421, 935
- Liu et al. (2015) Liu, B., Chen, Y., Zhang, X., et al. 2015, ApJ, 809, 102
- Malkov et al. (2011) Malkov, M. A., Diamond, P. H., & Sagdeev, R. Z. 2011, Nature Communications, 2, 194
- Manchester et al. (2005) Manchester, R. N., Hobbs, G. B., Teoh, A., & Hobbs, M. 2005, AJ, 129, 1993
- Massaro et al. (2004) Massaro, E., Perri, M., Giommi, P., & Nesci, R. 2004, A&A, 413, 489
- Merten et al. (2017) Merten, L., Becker Tjus, J., Eichmann, B., & Dettmar, R.-J. 2017, Astroparticle Physics, 90, 75
- Odegard (1986) Odegard, N. 1986, AJ, 92, 1372
- Ojeda-May et al. (2002) Ojeda-May, P., Kurtz, S. E., Rodríguez, L. F., Arthur, S. J., & Velázquez, P. 2002, Rev. Mexicana Astron. Astrofis., 38, 111
- Popescu et al. (2017) Popescu, C. C., Yang, R., Tuffs, R. J., et al. 2017, MNRAS, 470, 2539
- Sedov (1959) Sedov, L. I. 1959, Similarity and Dimensional Methods in Mechanics, New York: Academic Press
- Takeuchi et al. (2010) Takeuchi, T., Yamamoto, H., Torii, K., et al. 2010, PASJ, 62, 557
- Tang (2019) Tang, X. 2019, MNRAS, 482, 3843
- The Fermi-LAT collaboration (2019) The Fermi-LAT collaboration. 2019, arXiv e-prints, arXiv:1902.10045
- Wilks (1938) Wilks, S. S. 1938, Ann. Math. Statist., 9, 60
- Yuan et al. (2012) Yuan, Q., Liu, S., & Bi, X. 2012, ApJ, 761, 133
- Zabalza (2015) Zabalza, V. 2015, in International Cosmic Ray Conference, Vol. 34, 34th International Cosmic Ray Conference (ICRC2015), 922
- Zeng et al. (2019) Zeng, H., Xin, Y., & Liu, S. 2019, The Astrophysical Journal, 874, 50
| Energy Range | Spatial Model | aa . One point-like source as null hypothesis. | +DoFbb Additional degrees of freedom |
|---|---|---|---|
| 1–3 GeV | 1 point-like sourcecc Null hypothesis. Located at . | 0 | 0 |
| Uniform diskdd Best-fit uniform disk template (radius). | 111.4 | 0 | |
| Uniform disk + HESS J1804216⋆⋆This mark indicates the spatial template is adopted from 4FGL. | 111.8 | -2 | |
| W30⋆⋆This mark indicates the spatial template is adopted from 4FGL. | 97.7 | 0 | |
| W30⋆⋆This mark indicates the spatial template is adopted from 4FGL. + HESS J1804216⋆⋆This mark indicates the spatial template is adopted from 4FGL. | 97.7 | -2 | |
| 30–300 GeV | 1 point-like sourceee Null hypothesis. Located at . | 0 | 0 |
| 1 point-like sources (, , ) | 18.5, 6.4, 7.0 | 0 | |
| 2 point-like sources (+, +, +) | 55.9, 67.9, 52.0 | -2 | |
| 3 point-like sources (++) | 98.8 | -4 | |
| Uniform diskff Best-fit uniform disk template (radius). | 148.1 | 0 | |
| H.E.S.S significance mapggThe templates are created from HESS J1804216 significance map from H.E.S.S. Galactic Plane Survey, one for and the other . | 176.3,174.4 | 0 | |
| HESS J1804216⋆⋆This mark indicates the spatial template is adopted from 4FGL. | 179.5 | 0 | |
| W30⋆⋆This mark indicates the spatial template is adopted from 4FGL.+HESS J1804216⋆⋆This mark indicates the spatial template is adopted from 4FGL. | 182.5 | -2 |
| Name | Position | TS |
|---|---|---|
| , | 1486.5 | |
| , | 72.9 | |
| , | 66.1 | |
| , | 65.8 | |
| , | 53.2 |
| Name | Formula | Free parameters | |
|---|---|---|---|
| -ray | PL | , | |
| PLEC | , , | ||
| LogP | , , | ||
| BPL | , , | ||
| Particle | PL | A, | |
| ECPL | A, , , | ||
| BPL | A, , , |
| Spectral Type | PL | LogP | BPL | PLEC |
|---|---|---|---|---|
| W30aaThe spectrum type of HESS J1804216 is PL | 0 | 25.8 | 26.8 | 23.1 |
| HESS J1804216 bbThe spectrum type of W30 is BPL | 0 | 14.0 | -8.1 | 10.6 |
| Name (Type) | Spectral Parameters | Flux | TS | ||
| or | or | (GeV) | ( photons ) | ||
| W30 (BPL) | 2.200.04 | 2.800.09 | 3.000.10 | 7.942.75 | 3135.3 |
| HESS J1804216 (LogP) | 0.610.21 | 0.170.03 | 1.00aa is a scale parameter, which should be set near the lower energy range of the spectrum being fit and is usually fixed, see Massaro et al. (2004). | 0.370.08 | 375.9 |
| Model | Parent | Parameters | or | MLL aaMaximum log-likelihood. | |||
| Particle | or | or | or | B | |||
| Distribution | (GeV) | (G) | ( erg)bb | ||||
| pp | PL | - | - | - | -4.12 | ||
| BPL | - | -0.31 | |||||
| ECPL | 1 | - | -0.50 | ||||
| ECPL | - | -0.45 | |||||
| Syn | PL | - | - | 100 | -1.70 | ||
| BPL | 100 | -0.12 | |||||
| ECPL | 1 | 100 | -1.71 | ||||
| ECPL | 100 | -1.71 | |||||
| PL | - | - | -8.69 | ||||
| IC | BPL | -1.52 | |||||
| +Syn | ECPL | 1 | -2.15 | ||||
| ECPL | -2.11 | ||||||
| PL | - | - | -7.60 | ||||
| Brems | BPL | -0.77 | |||||
| +Syn | ECPL | 1 | -1.45 | ||||
| ECPL | -1.02 | ||||||
| Model | Parent | Parameters | or | MLLaaMaximum log-likelihood. | ||
| Particle | or | or | or | |||
| Distribution | (GeV) | ( erg)bb | ||||
| pp | PL | - | - | -68.34 | ||
| BPL | -3.54 | |||||
| ECPL | 1 | -6.07 | ||||
| ECPL | -4.63 | |||||
| IC | PL | - | - | -47.88 | ||
| BPL | -3.87 | |||||
| ECPL | 1 | -7.54 | ||||
| ECPL | -5.30 | |||||
| Brems | PL | - | - | -73.08 | ||
| BPL | -4.37 | |||||
| ECPL | 1 | -9.31 | ||||
| ECPL | -4.67 | |||||