Accretion and Outflow in V404 Cyg
Abstract
We study the optical evolution of the 2015 outburst in V404 Cyg, with emphasis on the peculiar nebular phase and subsequent decay to quiescence. From the decay timescale of the Balmer emission associated with the nebula we measure an outflow mass M⊙. Remarkably, this is 100 times larger than the accreted mass and 10% of the total mass stored in the disc. The wind efficiency must therefore be significantly larger than previous estimates for black hole transients, suggesting that radiation pressure (in addition to other mechanisms such as Compton-heating) plays a key role in V404 Cyg. In addition, we compare the evolution of the 2015 and 1989 outbursts and find clear similarities (namely a large luminosity drop 10 d after the X-ray trigger, followed by a brief nebular phase) but also remarkable differences in decay timescales and long-term evolution of the H profile. In particular, we see evidence for a rapid disc contraction in 2015, consistent with a burst of mass transfer. This could be driven by the response of the companion to hard X-ray illumination, most notably during the last gigantic (super-Eddington) flare on 25 June 2015. We argue that irradiation and consequential disc wind are key factors to understand the different outburst histories in 1989 and 2015. In the latter case, radiation pressure may be responsible for the abrupt end of the outburst through depleting inner parts of the disc, thus quenching accretion and X-ray irradiation. We also present a refined orbital period and updated ephemeris.
keywords:
accretion, accretion discs – X-rays: binaries – stars: black holes – stars: winds, outflows – (stars:) individual, V404 Cyg1 Introduction
Black holes (BH) are key to understand extreme processes in the Universe, such as accretion and outflows. In particular, stellar-mass BHs within X-ray binaries present us with the opportunity to study these processes on human timescales (McClintock & Remillard, 2006; Charles & Coe, 2006; Fender, 2006) and, therefore, often in greater detail than supermassive BHs (although see e.g. EHT Collaboration et al. 2019). The large majority of Galactic stellar-mass BHs are found in X-ray transients (XRTs), a subclass of X-ray binaries that exhibit violent outbursts, with 18 (dynamically) confirmed cases and more than 60 candidates (Casares & Jonker, 2014; Corral-Santana et al., 2016).
Among BH XRTs, V404 Cyg, the optical counterpart of the Ginga source GS 2023+338, stands out as a benchmark source for a number of reasons. It was the first BH with a dynamical mass comfortably exceeding that of standard neutron stars (Casares et al., 1992). Its companion star showed an anomalously large 7Li abundance (Martín et al., 1992), later proved to be a common feature of XRTs (Martín et al., 1996). It exhibited unprecedented X-ray variability during the 1989 outburst, with evidence for heavy line-of-sight absorption (Oosterbroek et al., 1997; Zycki et al., 1999). It is also the first BH XRT with a precise parallax distance (Miller-Jones et al., 2009) and the most luminous in quiescence at X-ray and radio energies (Kong et al., 2002; Gallo et al., 2005). Finally, it was the first BH XRT to show large flickering variability during quiescence in optical (Wagner et al., 1992; Zurita et al., 2003), near-IR (Sanwal et al., 1996; Zurita et al., 2004), X-rays (Wagner et al., 1994; Hynes et al., 2004; Bernardini & Cackett, 2014; Rana et al., 2016) and radio frequencies (Miller-Jones et al., 2008; Rana et al., 2016; Plotkin et al., 2019).
The renewed 2015 activity thus offered the opportunity to study another V404 Cyg outburst with modern instrumentation and a number of remarkable results were promptly produced. A non-exhaustive list includes:
After 12 days of frantic activity, and following a gigantic 8-hr flare that peaked above 50 Crab in hard X-rays, the outburst suddenly ended (Sánchez-Fernández et al., 2017; Jourdain et al., 2017). The rapid luminosity drop that followed revealed a brief nebular phase never seen before in any other BH XRT (Muñoz-Darias et al. 2016; see also Rahoui et al. 2017). In Mata Sánchez et al. (2018) we have presented a detailed spectroscopic study of the main 2015 outburst and its sequel a few months later (hereafter referred to as mini-outburst; Muñoz-Darias et al. 2017), including emission line diagnostics specifically designed to detect outflow signatures. Here in this paper we focus on the properties of the unique nebular episode and the subsequent decay to quiescence. In particular, we exploit the evolution of the strongest emission line, H, to gain insights into the physics of the outflow and trace the response of the accretion disc to the outburst. In addition, we compare the evolution of the 2015 and 1989 outbursts and revisit the fundamental binary parameters, presenting a new updated ephemeris.
2 Observations and data reduction
We use optical spectra of V404 Cyg collected between 15 June 2015 and 4 Jul 2016, thus covering the main outburst, the mini-outburst and early quiescence. The database consists of 639 H spectra already reported in Muñoz-Darias et al. (2016, 2017) and Mata Sánchez et al. (2018). These were collected with various instruments and resolutions, spanning between 60-300 km s-1. Most spectra have been flux calibrated through observations of a spectrophotometric standard star, with slit-loss corrections provided by a comparison star in the slit (see Mata Sánchez et al. 2018). Full details on the different instrument layouts can be found in Tables A1-A3 of Mata Sánchez et al. (2018).
In addition, we include eight more quiescent spectra gathered between 21 Sept 2016 and 7 Nov 2018. These spectra were obtained with the Andalucia Faint Object Spectrograph and Camera (ALFOSC) attached to the 2.5m Nordic Optical Telescope (NOT). We employed grism #17 which covers the H region at high-resolution (R). A log of the new quiescent observations is presented in Table 1.
| Date | Instrument | Coverage | Resolution | Texp |
|---|---|---|---|---|
| (Å) | km s-1 | |||
| 21/09/2016 | ALFOSC+GR17 | 6300-6900 | 40 | 2x2600s |
| 20/09/2017 | ,, | ,, | 55 | 2x1800s |
| 08/08/2018 | ,, | ,, | 55 | 2x1800s |
| 07/11/2018 | ,, | ,, | 55 | 2x1800s |
The recent spectroscopy was processed with standard debiasing, flat-field correction and optimal extraction using STARLINK/PAMELA routines (Marsh, 1989). Observations of Ne arc lamps were employed to derive pixel-to-wavelength calibrations through 4th order polynomial fits to more than 9 lines across the entire wavelength range. These yield a mean spectral dispersion of 0.29 Å pix-1 and 0.047 Å rms. The accuracy of the wavelength calibration was checked against the H sky line and was always found to be within 1 km s-1.
3 Long-term view of the 2015 outburst
Figure 1 presents the evolution of the H EW and FWHM between June 2015 and Dec 2018, compared to the AAVSO111American Association of Variable Star Observers; https://www.aavso.org V-band light curve. Data points represent 1 day averages, with uncertainties indicating one standard deviation in the distribution of individual values. Therefore, except for a few cases with poor statistics and/or signal-to-noise, the error bars reflect intrinsic variability within 1 day bins. Following Mata Sánchez et al. (2018) we tentatively define the limits of the nebular phase by the times when EW(H)100 Å and these are represented by red vertical lines on the figure. The time of the Swift X-ray trigger (Barthelmy et al., 2015) and the limits of the subsequent mini-outburst are also indicated by blue vertical lines. To guide the eye, horizontal dotted lines mark the V-mag and EW/FWHM values measured in quiescence, as reported in Casares et al. (1993) and Casares (2015) respectively.
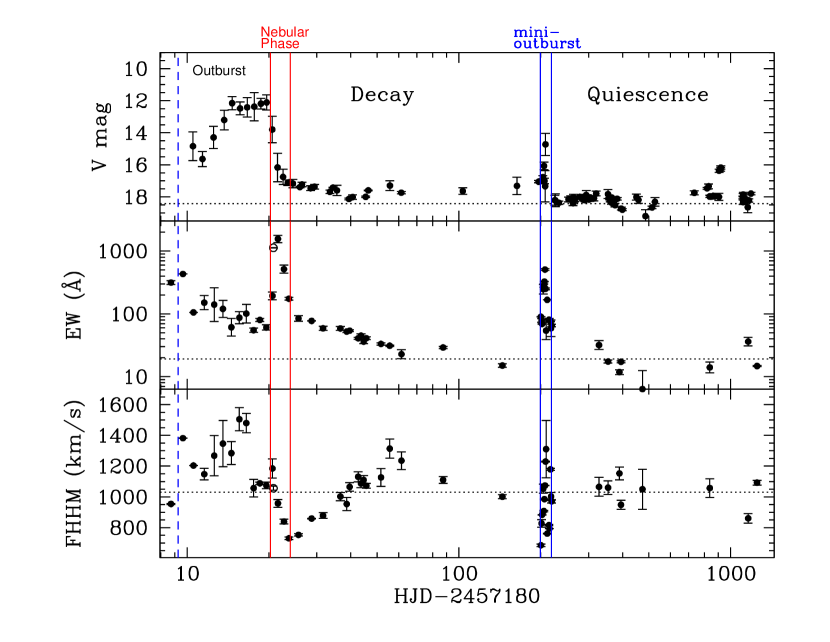
Figure 1 clearly shows how the nebular phase is triggered by a dramatic luminosity fall (5 optical mags in 2 days) that takes place on 26 June 2015 (MJD=57200). We observe that, at variance with the more erratic behaviour seen in outburst, both the EW and FWHM follow smooth trends throughout the nebular phase: the EW rises rapidly (peaking at 2000 Å) followed by a somewhat slower decay, while the FWHM shows a steady decrease from 1200 km s-1 to 700 km s-1. The EW evolution is explained because the irradiated continuum drops faster than the H flux (Mata Sánchez et al., 2018). On the other hand, the decrease in FWHM is caused by the dimming of the nebular contribution to the H profile (see Sect. 4).
After the nebular phase, the V-band flux falls off gradually222An exponential fit yields an e-folding timescale of 30 d. until reaching a standstill level 0.5-1 mag above quiescence. Meanwhile, the EW continues its decline towards quiescence but at a flatter rate than during the nebular decay. On the other hand, the FWHM reverses its downward drift and starts tracing a lengthy oscillation around the quiescent value. After the mini-outburst episode, the V-mag and the two H line parameters settle down at quiescent levels, although with significant residual variability that is characteristic of quiescent XRTs (see e.g. Hynes et al. 2002). Note that this is in contrast with X-ray results which, based on spectral softening, indicate the inner disc entered quiescence sometime between 23 July and 5 Aug (MJD 57227-57240), with (Plotkin et al., 2017). The optical evolution, therefore, suggests the outer disc is still responding to the outburst long after accretion onto the BH has stopped. Henceforth we decide to refer to the time between the nebular phase and the mini-outburst episode as decay while we call the period following the mini-outburst as quiescence.
4 The Nebular phase and decay
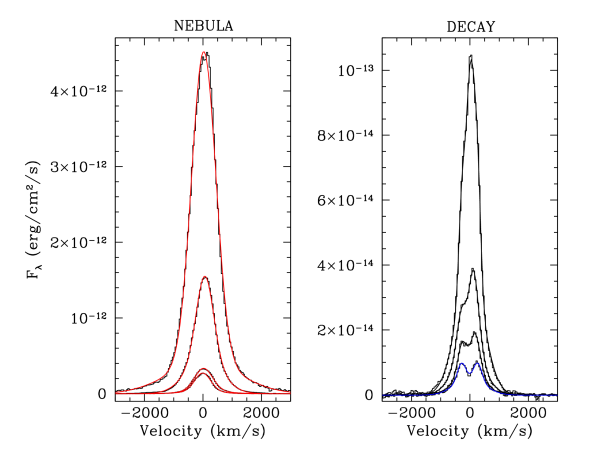
To study the evolution of V404 Cyg through the nebular phase and beyond we focus on the H recombination line. We have produced nightly averages of flux calibrated spectra obtained from MJD 57200 onwards. The spectra have been corrected for reddening using (Casares et al., 1993; Hynes et al., 2004; Miller-Jones et al., 2009), together with a mean Galactic extinction law and (Howarth, 1983). A close inspection of the H profiles reveals the fading of the strong broad single-peaked component from the nebula, while an underlying double peak profile, associated with the accretion disc, gradually emerges (see Fig 2). In order to isolate these two contributions we decided to perform multi-Gaussian fits to the line profiles. We restrict ourselves to data obtained with velocity resolution 150 km s-1 so as to better deconvolve the two components. Prior to the fit, the multi-Gaussian models were degraded to the resolution of the data through convolution with the appropriate instrumental profile.
The broad nebular component is overwhelmingly dominant on days MJD 57200-57203 and can be described by a two-Gaussian model, consisting of a broad base and a narrow core (left panel in Fig 2). On the other hand, H lines from MJD 57216 onwards are characterized by a pure accretion disc profile. These have been modelled using three Gaussians: a symmetric double peak plus a broad base, fixed at the position of the double peak centroid. Finally, profiles obtained between MJD 57205 and 57211 show the incremental appearance of the accretion disc under the nebula contribution. In this case we have added an extra Gaussian to the accretion disc model, so as to account for the residual nebula emission. Figure 2 shows a sample of H fits while Fig 3 plots the time evolution of the H flux for the nebular and disc components, as derived from the multi-Gaussian fits333Note that, although the nebula component is loosly constrained on MJD 57205-57211 by the four Gaussian model, this has no impact on the outflow mass (see Sect. 4.1) since the decay timescale of the nebula flux is already determined from observations on the early days of the nebular phase.. The resulting fluxes are listed in Table 2. For comparison, the table also provides fluxes for H and the HeII 4686+Bowen blend, obtained by direct integration of the line profiles after continuum subtraction. The latter blend probes the irradiating continuum and demonstrates that the X-ray ionization flux virtually vanishes after MJD 57200 (Muñoz-Darias et al., 2016; Mata Sánchez et al., 2018).
| MJD | Flux Hα | Flux Hβ | Flux Bowen | |
|---|---|---|---|---|
| nebula | disc | +HeII 4686 | ||
| 57200.60 | 1140 3 | - | 363.1 0.3 | 479.2 0.4 |
| 57200.77∗ | 997 5 | - | 206 4 | - |
| 57201.59 | 307.0 0.4 | - | 50.4 0.1 | 3.10 0.12 |
| 57202.71 | 61.0 0.1 | - | 8.66 0.03 | 3.32 0.06 |
| 57203.69 | 44.1 0.4 | - | 7.55 0.15 | 2.14 0.22 |
| 57205.69 | 5.3 1.4 | 11.8 0.9 | 4.62 0.07 | 1.92 0.12 |
| 57208.70 | 0.8 1.4 | 6.1 1.3 | - | - |
| 57211.65 | 0.3 0.7 | 3.3 0.8 | 0.98 0.06 | |
| 57216.65 | - | 2.83 0.04 | 0.82 0.02 | |
| 57222.60 | - | 1.97 0.07 | 0.52 0.05 | |
| 57223.64 | - | 2.75 0.02 | 0.77 0.02 | |
| 57224.62 | - | 2.66 0.09 | 0.91 0.10 | |
| 57225.64 | - | 2.16 0.04 | - | - |
| 57235.65 | - | 1.37 0.01 | - | - |
| 57267.46 | - | 1.27 0.13 | 0.23 0.03 | |
† Fluxes are given in units of 10-13 erg cm-2 s-1.
∗ From Rahoui et al. (2017), dereddened by .
4.1 Outflow Mass
The nebular phase in V404 Cyg has been rendered visible by a dramatic 3 orders of magnitude drop in X-ray luminosity in just a few hours (e.g. Maitra et al. 2017). The sudden switch-off of the central irradiation engine thus opens a rare opportunity to observe and study the glowing nebula. For example, we note the appearance of faint forbidden emission lines between MJD 57201 and 57205, such as 4959, 5007 or 6717, 6731 (see Fig 4). These lines are all very narrow and unresolved, with values that are consistent with the instrumental resolution. This implies that they arise from a localized region, possibly an external shell, analogous to the narrow-line region in quasars. The intensity ratio of the doublet indicates very low electron densities cm-3 (Osterbrock, 1989) although this diagnostic may not be reliable here because the nebula is not in ionization equilibrium. Furthermore, the formation site of the forbidden lines is most likely not representative of the bulk of the nebula.

In order to constrain the physics of the outflow we propose instead to exploit the lifetime of the nebular phase as traced by the decay of the Balmer recombination flux. Figure 3 shows that the H nebular emission dissipates completely 10 days after the onset of the nebular phase. This is followed by the decay of the H disc emission at a much slower rate. The evolution of the two components can be modelled by exponential decay functions with e-folding timescales d and d, respectively. The rapid loss in H luminosity is determined by the recombination timescale of the H atoms, , as this is longer than other relevant processes such as photoionization and scattering/collisions. Therefore, we can use , where is the recombination coefficient for hydrogen which, for a typical temperature K (as indicated by the Boltzmann plots of the nebular phase, see Mata Sánchez et al. 2018) is cm3s-1 (Osterbrock, 1989). By adopting we obtain cm-3.
We can now apply the relation between the intensity of the H emission line and the mass of hydrogen in the nebula (Osterbrock, 1989)
| (1) |
where kpc (Miller-Jones et al., 2009) and cm-3 is the effective H recombination coefficient for K. From the first spectrum of the nebular phase on MJD 57200 we measure a de-reddened H flux ergs cm-2s-1 (see Table 2). Bringing this into equation 1 yields M⊙. Here we have taken advantage of the accurate distance based on the radio parallax. In the case of a nebula with homogeneous density this calculation is deemed to be reliable within 50%. On the other hand, the uncertainty associated with the H flux is dominated by the reddening correction. For instance, if we adopt a lower limit (Hynes et al., 2004) then drops by factor of 2. All in all, we consider that our mass calculation could be approximate to a factor 4.
An independent estimate can be obtained if we assume that the nebula has uniform density, following
| (2) |
where is the radius of the nebula, the mass of a hydrogen atom and a term that accounts for both its filling factor and covering factor. A rough estimate of can be inferred from the mean outflow velocity, km s-1 , as measured from the several P Cyg profiles detected during the outburst (Muñoz-Darias et al., 2016; Mata Sánchez et al., 2018). Bernardini et al. (2016) report a very intense ( Å), broad ( km s-1) and red-skewed H profile on MJD 57188, indicating that significant mass outflow was already taking place 13 h before the X-ray trigger. Since the outburst ended abruptly on MJD 571200 (Ferrigno et al., 2015) we then adopt a total outburst duration 12 d. Assuming a sustained outflow with throughout the entire outburst we estimate the size of the nebula to be km. Now bringing this into equation 2 and assuming leads to M⊙, which compares well with the previous calculation based on the H decay. This, in turn, suggests that the nebula has large filling and covering factors. The latter is supported by the symmetric Gaussian profile of the nebula component, an indication of a spherical outflow geometry. The observation of simultaneous red-shifted emission and P-Cyg absorptions during the main outburst also provides independent support for a large covering factor (Muñoz-Darias et al., 2016).
It should also be mentioned that our outflow mass is consistent with that estimated from the diffusion timescale of the nebula, based on the transition from the optically thick P-Cyg absorption profiles into optically thin emission-line wings. In particular, Muñoz-Darias et al. (2016) obtain M⊙ for diffusion timescales constrained by observations to the range 0.002 - 0.1 days. Given that the recombination timescale of the nebula is significantly larger than the diffusion timescale, the former appears as a more useful tool to estimate the mass ejected in V404 Cyg and in other systems.
4.2 Updated ephemeris
The presence of an outflow will naturally produce a change in the binary period that might be detected in our data (e.g. Di Salvo et al. 2008). Ziólkowski & Zdziarski (2018) studied the effect of non-conservative mass-transfer in V404 Cyg, modelling the response of the companion’s Roche lobe for the case of stripped-giant evolution and an outflow produced at different disc radii. They show that the impact on the orbital period () depends critically on where the outflow takes place. For an outflow located at the circularization radius is expected to increase at a rate yr. If the outflow is instead produced at (with being the binary separation i.e. close to the outer disc radius) it will carry away a larger fraction of specific angular momentum, resulting in yr.
To search for possible changes in the orbital period we have revisited the orbital parameters of V404 Cyg. On the one hand, we have measured radial velocities from 203 quiescent spectra obtained between 1990 and 2009, and reported in Casares & Charles (1994) and Casares (2015). The velocities were computed through cross-correlation with the K0 IV star template HR 8857 as in Casares & Charles (1994). On the other, we obtained new velocities from 80 spectra collected between 2015 and 2018 (Mata Sánchez et al. 2018 and this paper). The velocities were also extracted by cross-correlation with the same template, broadened to km s-1 and degraded to the resolution of every instrumental set-up. We have only considered the subset of high resolution (150 km s-1) spectra where the companion star is clearly detected. A sine wave fit to the two groups of radial velocities results in the orbital parameters listed in the first two columns of Table 3. The systemic velocity has been corrected from the radial velocity of the template, that we take as -39.110.02 km s-1 (Soubiran et al., 2013). The error bars on each dataset were scaled by factors 2.4 and 1.8, respectively, to make the final reduced equal to one. All the quoted uncertainties in the table correspond to 1-. Figure 5 presents the two radial velocity curves folded on the best ephemeris.
| Parameter† | 1990-2009 | 2015-2018 | All |
|---|---|---|---|
| P (d) | 6.471177(13) | 6.47103(16) | 6.471170(2) |
| T0 (HJD-2400000) | 48089.105(5) | 57200.518(9) | 57200.514(2) |
| K2 (km s-1) | 208.50.7 | 207.81.5 | 208.40.5 |
| (km s-1) | -1.01.0 | -3.31.2 | -2.00.4 |
† Numbers within parenthesis indicate error in the last digits.
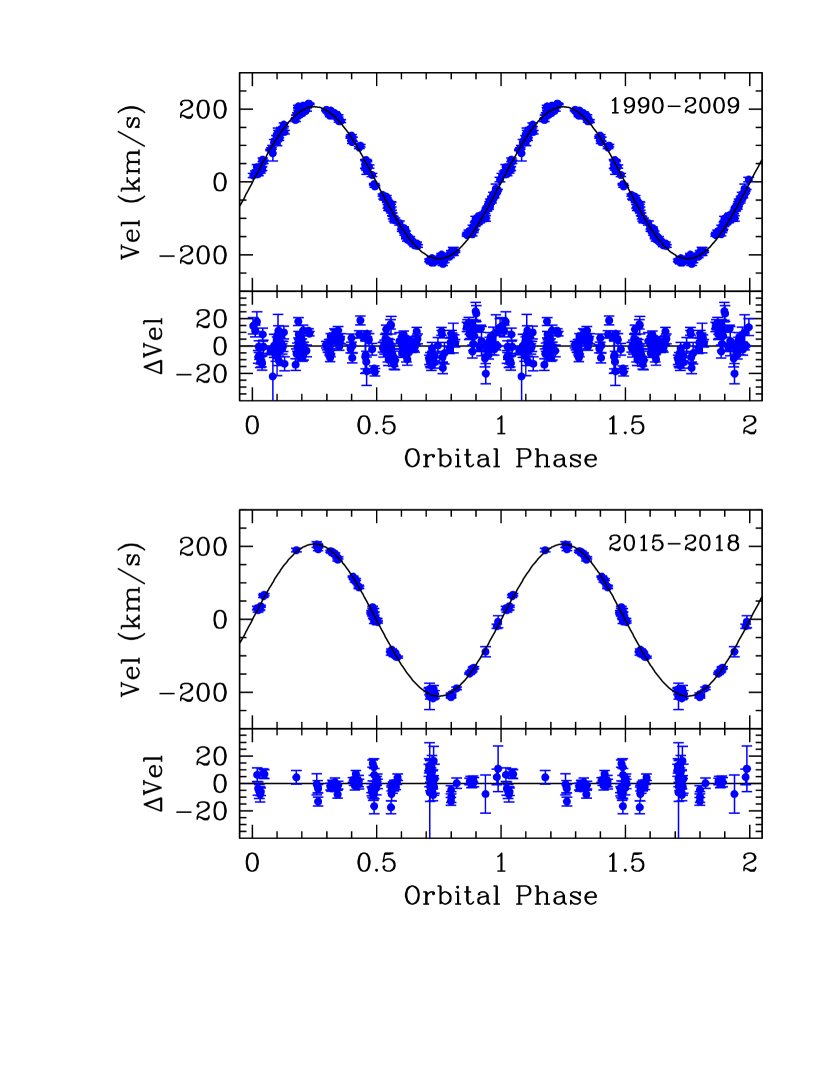
After comparing the two orbital solutions we conclude that it is not possible to detect a period variation with the present data. Despite the long baseline of the first data set, the error in is (in the most favorable case) a factor 3 larger than the expected change. Therefore, even in the event of a much improved determination on the second epoch (through future high resolution data) it will still not be possible to measure a period variation caused by the 2015 outflow. As pointed out by Ziólkowski & Zdziarski (2018), we are limited here by the long orbital period of V404 Cyg. The third column in Table 3 provides the most accurate orbital parameters possible, after combining all the velocities available over 30 yr.
4.3 The Accretion Disc Evolution
In what follows, we will focus on the evolution of the accretion disc during the outburst decay. As shown by Fig. 2, the disappearance of the nebular emission gives us a glimpse at the accretion disc structure. In Casares (2015) we argue that the FWHM of the H line in quiescent XRTs can be taken as a proxy of the accretion disc radius. In particular, inter-outburst observations of V404 Cyg obtained over 20 years prove the FWHM to be stable at 102994 km s-1. This velocity corresponds to the Keplerian radius at 42% RL1, a value that we take as the characterisitic equilibrium radius in quiescence. In this context, the post-nebular evolution of the FWHM (bottom panel in Fig. 1) can be interpreted as a rapid shrinkage of the accretion disc. During this process, the disc is seen to overshoot the quiescent equilibrium radius before expanding back to it. By contrast, the disc instability theory predicts that, following the outburst expansion, the accretion disc should shrink slowly and steadily to the equilibrium radius because of the addition of low angular momentum material (Smak, 1984b). There is ample supporting evidence for slow disc contraction towards equilibrium in cataclysmic variables (e.g. Smak 1984a; O’Donoghue 1986; Wood et al. 1989; Wolf et al. 1993; Baptista & Catalán 2001; Ramsay et al. 2012), and this was exactly the behaviour observed in the 1989 outburst of V404 Cyg as well (see Fig. 2 in Casares 2015).
To further investigate the puzzling evolution of the FWHM in 2015 we have looked at the double peak separation, as delivered by our previous model fits. The double peak traces the outer disc velocity and, therefore, provides us with a direct geometrical measurement of the outer disc radius. Fig. 6 presents a sample of accretion disc profiles through the outburst decay together with their fits, while Fig. 7 plots the variation of the peak’s half-separation () with time. For reference, we have marked the disc velocities at the circularization and tidal truncation radii which, for the case of the V404 Cyg parameters, correspond to and respectively, with R☉ (Frank et al., 2002). Here we have adopted =6.4712 d, a binary mass ratio (Casares & Charles, 1994; Casares, 1996), a BH mass =9 M⊙ and a binary inclination (Khargharia et al., 2010). Following Casares (2016) we also assume that the velocity at the tidal radius is 77% sub-Keplerian. In addition, we indicate the outer disc velocity in quiescence, as measured from the spectral average in 2016-2018 (incidentally, this is identical to the 20 year quiescent average obtained between the 1989 and 2015 outbursts).
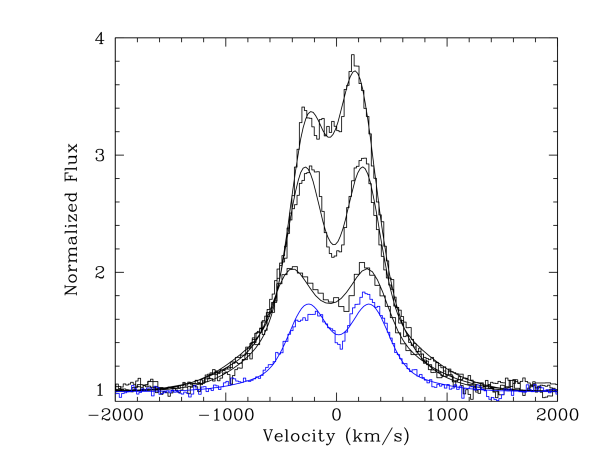
Figure 7 confirms that the outer disc radius shrinks from about the tidal radius to the circularization radius in 30 days. This behaviour qualitatively agrees with predictions from the mass transfer instability model. For example, simulations by Livio & Verbunt (1988) (see also Ichikawa & Osaki 1992) show that a burst of enhanced mass transfer triggers a swift disc contraction, followed by subsequent expansion and relaxation to the quiescent equilibrium radius. The contraction timescale reflects the inertia of the accretion disc to the addition of (low angular momentum) material and is largely determined by the outer disc mass and the mass transfer rate from the donor star as (Anderson, 1988). This property has been used to estimate the disc mass in some cataclysmic variables where, for typical values M⊙ yr-1 results in M⊙ (Wood et al., 1989; Wolf et al., 1993). V404 Cyg has a much larger disc, with an estimated mass M⊙ (Zycki et al., 1999), but the timescale of disc contraction is rather similar. This implies an instantaneous mass supply of M⊙ yr-1, that is, 4 orders of magnitude larger than the steady mass transfer rate expected from evolutionary considerations (King, 1993; Ziólkowski & Zdziarski, 2018).
Interestingly, it has been shown that steep jumps of similar amplitude can be produced by instabilities in X-ray illuminated atmospheres (Hameury et al., 1986, 1988, 1990). Hard X-rays penetrate to large Thompson optical depths and trigger the expansion of the sub-photospheric layers, leading to a large increase in mass flow through the point. The model presented in Hameury et al. (1988, 1990) for the A0620-00 parameters shows an increase of 3-4 orders of magnitude from a quiescent value M⊙ yr-1. As a matter of fact, the amplitude of mass transfer enhancement is rather sensitive to the illuminating flux seen by the companion (Viallet & Hameury, 2008). A detailed modelling for the specific system parameters and Eddington/super-Eddington hard X-ray luminosities of V404 Cyg would be required before assessing whether this is a viable explanation for our observations. If this were the case, we could compare our data with simulations performed by Livio & Verbunt (1988) and Ichikawa & Osaki (1992). These show that the disc contraction phase lasts until the end of the mass transfer burst. Direct scaling from our observations, albeit model simplifications, would imply a 30 d burst which, for the above mass transfer rate, yields a total of M⊙ injected by the burst. This is comparable to the mass ejected by the outflow, although we warn that many simplifications are involved in this very rough estimate.

5 Discussion
V404 Cyg displays very uncommon properties among BH XRTs, with violent flaring activity across the entire outburst period. The outburst is further characterized by the presence of a sustained outflow that manifests itself through P-Cyg profiles in X-ray (King et al., 2015) and optical lines (Muñoz-Darias et al., 2016; Mata Sánchez et al., 2018), as well as broad emission lines (with extended wings) during a short-lived nebular phase 444Only V4641 Sgr has shown similar phenomenology during its brief frequent outbursts, with dramatic X-ray flares, optical P-Cyg absorptions and broad nebular lines (see Muñoz-Darias et al. 2018; Chaty et al. 2003).. Many papers have dealt with the timing and spectral properties of the exceptional flares in different energy bands (e.g. Rodriguez et al. 2015; Natalucci et al. 2015; Roques et al. 2015; Kimura et al. 2015; Jenke et al. 2016; Martí et al. 2016; Gandhi et al. 2016; Loh et al. 2016; Jourdain et al. 2017; Rodi et al. 2017; Walton et al. 2017; Motta et al. 2017a; Sánchez-Fernández et al. 2017; Maitra et al. 2017; Tachibana et al. 2017; Tetarenko et al. 2017, 2019). Here in this paper we have focused instead on the optical study of the nebular phase and subsequent decay, with the aim of constraining the physics of the outflow.
5.1 A Massive Outflow
From the decay of the H flux associated with the nebula we derive an outflow mass M⊙. This represents 10% of the total disc mass and a factor larger than that accreted during the outburst, (see Zycki et al. 1999, also Muñoz-Darias et al. 2016). The ratio implies a much larger wind efficiency than predicted by Compton-heated simulations (Done et al., 2018; Higginbottom et al., 2019). It also exceeds estimates for the soft-state wind in a sample of BH X-ray binaries, although the latter may be subject to large uncertainties in the ionization parameter (Ponti et al., 2012). The kinetic energy carried by the wind is erg s-1, where we have adopted km s-1 and assumed the outflow mass is ejected at a constant rate during the 12-d outburst duration. This corresponds to , still a minor contribution to the energy balance but an order of magnitude larger than previous calculations (Fender & Muñoz-Darias, 2016).
Our large wind efficiency and kinetic luminosity may be explained by the action of an extra-wind launching mechanism other than thermal heating. Done et al. (2018) and Higginbottom et al. (2019) have discussed the importance of radiation pressure at very high luminosities. When approaching the Eddington limit the inner disc becomes puffed up and the Compton radius drops substantially, allowing the wind to be launched from everywhere on the disc (Proga & Kallman, 2002). This has a dramatic impact on the wind mass-loss rate and kinetic power and may actually represent a major contribution to the outflow during the frequent (super-)Eddington flares observed in V404 Cyg (Motta et al., 2017a, b). Incidentally, an increase in the equivalent hydrogen absorption column from cm-2 to a few times 1023 cm-2 was reported during outburst (Walton et al., 2015; Motta et al., 2017b). This would be consistent with an outflow mass M⊙, ejected in spherical geometry at constant km s-1 over 3 days, or km s-1 over 10 days (Muñoz-Darias et al., 2016).
It should also be noted that our wind efficiency is beyond the critical limit for Compton-heated winds to perturb a steady accretion flow and trigger oscillations (Shields et al., 1986). In this context it is interesting to speculate whether the violent flaring activity exhibited by V404 Cyg is a manifestation of an accretion instability driven by the outflow. In any case, our large nebular mass strongly reinforces previous results on the key role played by the wind in the accretion/ejection balance and, even perhaps, in the occurrence of state transitions (Begelman et al., 1983; Neilsen & Lee, 2009; Neilsen et al., 2011; Ponti et al., 2012).
5.2 A possible mass-overflow instability
Such a massive wind also poses an interesting challenge for the mass balance in the disc. Evolutionary considerations indicate that the donor star transfers matter at a rate M⊙ yr-1 (King, 1993; Ziólkowski & Zdziarski, 2018) and, therefore, the disc is replenished with M⊙ during the 2-3 decades between outbursts. If M⊙ are lost by the wind and a further M⊙ through accretion (Zycki et al., 1999; Muñoz-Darias et al., 2016) then it seems difficult to build and maintain a M⊙ accretion disc over decades unless the mass transfer rate from the companion is largely underestimated. Interestingly, the evolution of the H profile shows evidence for rapid disc shrinkage, in support of a burst of mass transfer (Sect. 4.3). The timescale of disc contraction suggests an extra M⊙ were supplied to the disc which would be enough to counter wind mass losses, albeit we stress the latter figure is a crude estimation. In this regard, it should be noted that both the V and H line fluxes (Figures 1 and 3) decay on a 20-30 d timescale after the X-ray flux has faded, which is much longer than the cooling (thermal) timescale 1.2 d (where =11.4 R☉ is the circularization radius and the hot-state viscosity). This clearly suggests that there is ongoing activity in the outer disc well after the X-ray outburst has ended. Further indication is given by the fact that V stays 0.5-1 mag above quiescence throughout the entire decay phase (Figure 1).
As discussed in section 4.3, a burst of enhanced mass transfer can be triggered by irradiation. This scenario was initially proposed by Osaki (1985) to explain superoutbursts in SU UMa systems and, although it has been questioned for cataclysmic variables (CVs) on the basis of weak hard X-ray luminosities, it did inspire mass transfer instability models for BH XRTs (e.g. Chen et al. 1993; Augusteijn et al. 1993). Given the profusion of hard X-ray luminous flares detected through the 2015 outburst it certainly appears as a viable possibility for V404 Cyg.
5.3 Comparison with the 1989 outburst
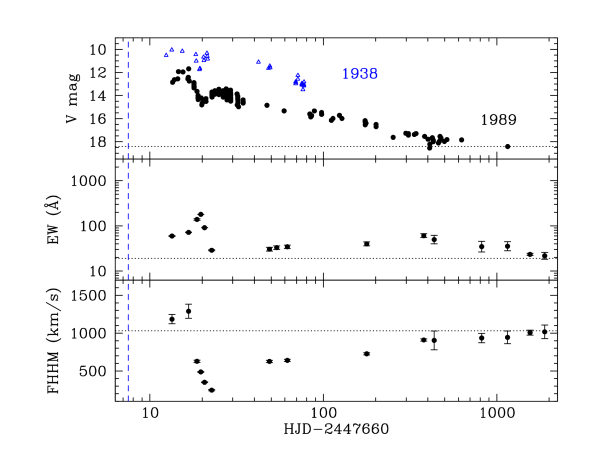
The 2015 outburst of V404 Cyg displays striking differences with respect to previous episodes of activity. This is exemplified by Figure 8, where we present the long-term evolution of the V mag, EW and FWHM of the H line for the 1989 outburst. The figure also plots the photographic (B-band) light curve of the 1938 outburst (Wachmann, 1948), when V404 Cyg was misclassified as a classical nova. Unfortunately, there is no supporting spectroscopic data for Nova Cygni 1938.
A direct comparison with Figure 1 shows that, while the 2015 outburst terminates 10 days after the X-ray trigger, the 1989 (and 1938) outburst exhibit a much longer luminosity fall (also seen in radio and X-rays, e.g. Han & Hjellming 1992; Tetarenko et al. 2019). The latter follows a classic exponential tail with an e-folding timescale of 110 d that takes 2 yr to bring the system into quiescence. The protracted decays of the 1989 and 1938 outbursts strongly indicate that X-ray irradiation was key to maintain the disc in the hot state (King & Ritter, 1998). What therefore causes the abrupt interruption of the 2015 outburst?
In this regard, it is interesting to note that both, the 1989 and 2015 outbursts undergo a large optical drop 10 days after the X-ray trigger. The downfall in 2015 is dramatic (5 mag), driving the outburst to an end. Meanwhile, in 1989 the optical flux drops 2.5 mag and bounces back. A comparable short-lived dip and rebound is observed in the 1938 light curve as well. In the context of the disc instability model (DIM, see Lasota 2001 for a review and Dubus et al. 2001 for detailed simulations), a large luminosity drop is explained by the inward propagation of a cooling wave. For this to happen, the disc surface density and/or the stabilizing effect of irradiation must drop, allowing hydrogen to re-combine and return to the cold state. Alternatively, the rebound observed in 1989 requires the density behind the cooling front to be large enough (for a given X-ray illumination) to revive the thermal instability (Dubus et al., 1999; Menou et al., 2000).
Two competing processes, external to the standard DIM although driven by consequential irradiation, are important actors here. A disc wind depletes the surface density, favouring the propagation of the cooling wave, while a burst of mass transfer temporarily enhances the outer disc mass, thus prolonging the outburst. The interplay between these two mechanisms, together with the irradiated flux, determines whether the local density lies above or below the critical limit and will eventually seal the fate of the outburst. Muñoz-Darias et al. (2016) have proposed that the wind observed in June 2015 depletes the outer disc very efficiently, leading the outburst to a premature end. It should be noted, however, that conspicuous wind signatures in the form of P-Cyg absorptions were also detected in 1989 (Casares et al., 1991), followed by a clear nebular phase, with EW(H) peaking at 200 Å (see middle panel in Figure 8). On the other hand, Mata Sánchez et al. (2018) noted that the P-Cyg velocities in 1989 are systematically lower than in 2015, with typical values at 700 km s-1. Lower velocities imply the wind is launched at larger disc radii, thus involving a lower outflow mass. In addition, the lower number of flares in 1989 (with only one briefly approaching Eddington on May 30, just preceding the luminosity dip; Zycki et al. 1999) suggest that radiation pressure was much less important. We here propose that the remarkable difference between the 1989 and 2015 outburst decays reflects different wind efficiencies and, especially, the major role played by radiation pressure in the latter episode. The abrupt end of the 2015 outburst could then be understood in terms of an effective depletion of the inner parts of the disc through a radiation-driven wind. The effect would be to quench accretion onto the BH and, consequently, irradiation of the outer disc, thus favouring the propagation of a cooling front.
Another intriguing feature of the light curve is the presence of a short mini-outburst in Dec. 2015 (Muñoz-Darias et al., 2017). None is seen during or immediately after the 1989 decay, although it should be noted that it might have been missed by sparse data coverage. In the aforementioned framework, it is tempting to speculate whether the Dec. 2015 mini-outburst could have been caused by a mass-transfer episode through irradiation from the final gigantic flare on MJD 57200. As we have discussed before, a burst of enhanced mass-loss would produce a disc contraction, while an accretion wave will be formed. After some time, the disc relaxes back to the equilibrium radius but the accretion wave continues travelling inwards until it is accreted by the central object. This scenario would be similar to the model proposed by Augusteijn et al. (1993), where X-ray glitches are interpreted as echoes of the main outburst. The Dec 2015 mini-outburst occurs 150 days after the peak of the main outburst, a timescale that must reflect the diffusion time of the new material through the disc, plus the viscous time needed to replenish the truncated inner disc (Hameury et al., 1997). The propagation of the density wave should leave a signature in the form of changing H line profiles that, unfortunately, our poor spectroscopic coverage of the time preceding the mini-outburst prevent us from testing. Future intensive high-resolution spectroscopic monitoring of new V404 Cyg outbursts (and of other BH XRTs) can investigate this hypothesis.
6 Conclusions
We have studied the decay of the nebular phase in the 2015 outburst of V404 Cyg and inferred an outflow mass of M⊙. This is two orders of magnitude larger than the mass accreted during outburst, implying a much higher wind efficiency and kinetic energy than previous estimates for BH XRTs. Such a massive outflow might be explained by the contribution of a radiation-driven wind during the luminous flares (most importantly during the final flare on MJD 57199), in addition to other mechanisms such as classic thermal heating. This brings new support to the view that the 2015 outburst (as opposed to that in 1989) was prematurely ended by the outflow sweeping up inner parts of the disc, thus quenching accretion onto the black hole and turning off disc irradiation.
The evolution of the H line profile, on the other hand, shows evidence for a rapid disc contraction following the nebular phase. We argue that this may be caused by an episode of increased mass transfer, driven by the response of the secondary star to intense X-ray illumination. A crude estimate, based on scaling the timescale of disc contraction with CVs, suggest M⊙ have been added to the disc at this stage. This, together with the evidence for a massive wind, strengthens the importance of irradiation effects in modelling the outburst evolution of BH XRTs.
Acknowledgements
JC would like to acknowledge the hospitality of the Department of Physics of the University of Oxford, where this work started during a sabbatical visit. We are grateful to J.P. Lasota for interesting discussions on the DIM. We also thank Rosa Clavero and other members of the IAC team of support astronomers for undertaking the quiescent phase observations during Service time. JC acknowledges support by the Leverhulme Trust through the Visiting Professorship Grant VP2-2015-046. Also by the Spanish Ministry of Economy, Industry and Competitiveness (MINECO) under grant AYA2017-83216-P. TMD and MPT acknowledge support via the Ramón y Cajal program through fellowships RYC-2015-18148 and RYC-2015-17854, respectively. JGR acknowledges support from an Advanced Fellowship from the Severo Ochoa excellence program (SEV-2015-0548) and support from the State Research Agency (AEI) of the Spanish Ministry of Science, Innovation and Universities (MCIU) and the European Regional Development Fund (FEDER) under grant AYA2017-83383-P. PAC acknowledges financial support from the Leverhulme Trust through an Emeritus Fellowship. DMS also acknowledges support from the ERC under the European Union’s Horizon 2020 research and innovation programme (grant agreement No. 715051; Spiders). Partly based on observations made with the GTC and WHT telescopes under Service Time of Spain’s Instituto de Astrofísica de Canarias. We acknowledge with thanks the variable star observations from the AAVSO International Database contributed by observers worldwide and used in this research. MOLLY software developed by T. R. Marsh is gratefully acknowledged.
References
- Alfonso-Garzón et al. (2018) Alfonso-Garzón J. et al., 2018, A&A, 620, A110
- Anderson (1988) Anderson N., 1988, ApJ, 325, 266
- Augusteijn et al. (1993) Augusteijn T., Kuulkers E., Shaham J., 1993, A&A, 279, L13
- Baptista & Catalán (2001) Baptista R., Catalán M.S., 2001, MNRAS, 324, 599
- Barthelmy et al. (2015) Barthelmy S.D., D’Ai A., D’Avanzo P., Krimm H.A., Lien A.Y.,Marshall F.E., Maselli A., Siegel M.H., 2015, GRB Coordinates Network, 17929
- Begelman et al. (1983) Begelman M.C., McKee C.F., Shields G.A., 1983, ApJ, 271, 70
- Bernardini & Cackett (2014) Bernardini F., Cackett E.M., 2014, MNRAS, 439, 2771
- Bernardini et al. (2016) Bernardini F., Russell D.M., Shaw A.W., Lewis F., Charles P.A., Koljonen K.I.I.., Lasota J.P., Casares J., 2016, ApJ, 818, L5
- Casares et al. (1991) Casares J., Charles P.A., Jones D.H.P., Rutten R.G.M., Callanan P.J., 1991, MNRAS, 250, 712
- Casares et al. (1992) Casares J., Charles P.A., Naylor T., 1992, Nature, 355, 614
- Casares et al. (1993) Casares J., Charles P.A., Naylor T., Pavlenko E.P., 1993, MNRAS, 265, 834
- Casares & Charles (1994) Casares J., Charles P.A., 1994, MNRAS, 271, L5
- Casares (1996) Casares J., 1996, in Proc. 158th Coll. of IAU 208, Astrophysics and Space Science Library, ed. A. Evans & H. Janet Wood (Dordrecht: Kluwer), 395
- Casares & Jonker (2014) Casares J., Jonker P.G., 2014, Space Sci. Rev., 183, 223
- Casares (2015) Casares J., 2015, ApJ, 808, 80
- Casares (2016) Casares J., 2016, ApJ, 822, 99
- Charles & Coe (2006) Charles P.A., Coe M., 2006, Optical, ultraviolet and infrared observations of X-ray binaries in Compact stellar X-ray sources, ed. W. Lewin & M. van der Klis, Cambridge Astrophysics Series, No. 39, Cambridge University Press, p.215
- Chaty et al. (2003) Chaty S., Charles P.A., Martí J., Mirabel I.F., Rodríguez L.F., Shahbaz T., 2003, MNRAS, 343, 169
- Chen et al. (1993) Chen W., Livio M., Gehrels N., 1993, ApJ, 408, L5
- Corral-Santana et al. (2016) Corral-Santana J.M., Casares J., Muñoz-Darias T., Bauer F.E., Martínez-Pais I.G., Russell D.M., 2016, A&A, 587, A61
- Dallilar et al. (2018) Dallilar Y. et al., 2018, Science, 358, 1299
- Di Salvo et al. (2008) di Salvo T., Burderi L., Riggio A., Papitto A., Menna M.T., 2008, MNRAS, 389, 1851
- Done et al. (2018) Done C., Tomaru R., Takahashi T., 2018, MNRAS, 473, 838
- Dubus et al. (1999) Dubus G., Lasota J.-P., Hameury J.-M., Charles P.A., 1999, MNRAS, 303, 139
- Dubus et al. (2001) Dubus G., Hameury J.-M., Lasota J.-P., 2001, A&A, 373, 251
- EHT Collaboration et al. (2019) EHT Collaboration et al., 2019, ApJ, 875, L1
- Fender (2006) Fender R.P., 2006, Jets in X-ray binaries in Compact stellar X-ray sources, ed. W. Lewin & M. van der Klis, Cambridge Astrophysics Series, No. 39, Cambridge University Press, p.381
- Fender & Muñoz-Darias (2016) Fender R.P., Muñoz-Darias T., 2016, LNP, 905, 65
- Frank et al. (2002) Frank J., King A.R., Raine D.J., 2002, Accretion Power in Astrophysics (3rd ed.; Cambridge: Cambridge Univ. Press)
- Ferrigno et al. (2015) Ferrigno C., Bozzo E., Boissay R., Kuulkers E., Kretschmar P., 2015, ATel #7731
- Gallo et al. (2005) Gallo E., Fender R.P., Hynes R. I., 2005, MNRAS, 356, 1017
- Gandhi et al. (2016) Gandhi P. et al., 2016, MNRAS, 459, 554
- Gandhi et al. (2017) Gandhi P. et al., 2017, NatAs, 1, 859
- Gotthelf et al. (1992) Gotthelf E., Halpern J.P., Patterson J., Rich R.M., 1992, AJ, 103 219
- Hameury et al. (1986) Hameury J.M., King A.R., Lasota J.P., 1986, A&A, 162, 71
- Hameury et al. (1988) Hameury J.M., King A.R., Lasota J.P., 1988, A&A, 192, 187
- Hameury et al. (1990) Hameury J.M., King A.R., Lasota J.P., 1990, ApJ, 353, 585
- Hameury et al. (1997) Hameury J.M., Lasota J.P., McClintock J.E., Narayan R., 1997, ApJ, 489, 234
- Han & Hjellming (1992) Han X., Hjellming R.M., 1992, ApJ, 400, 304
- Higginbottom et al. (2019) Higginbottom N., Knigge C., Long K.S., Matthews J.H., Parkinson E.J., 2019, MNRAS, 484, 4635
- Howarth (1983) Howarth I.D., 1983, MNRAS, 203, 301
- Hynes et al. (2002) Hynes R.I., Zurita C., Haswell C.A., Casares J.,. Charles P.A., Pavlenko E.P., Shugarov S.Y., Lott D.A., 2002, MNRAS, 330, 1009
- Hynes et al. (2004) Hynes R.I. et al., 2004, ApJ, 611, L125
- Ichikawa & Osaki (1992) Ichikawa S., Osaki Y., 1992, PASJ, 44, 15
- Jourdain et al. (2017) Jourdain E., Roques J.-P., Rodi J., 2017, ApJ, 834, 130
- Jenke et al. (2016) Jenke P.A. et al., 2016, ApJ, 826, 37
- Khargharia et al. (2010) Khargharia J., Froning C.S., Robinson E.L., 2010, ApJ, 716, 1105
- Kimura et al. (2015) Kimura M.. et al., 2015, Nature, 529, 54
- King (1993) King A.R.,1993, MNRAS, 260, L5
- King & Ritter (1998) King A.R. Ritter H.,1998, MNRAS, 293, L42
- King et al. (2015) King A.L., Miller J.M., Raymond J., Reynolds M.T., Morningstar W., 2015, ApJ, 813, L37
- Kitamoto et al. (1989) Kitamoto S., Tsunemi H., Miyamoto S., Yamashita K., Mizobuchi S., Nakagawa M., Dotani T., Makino F., 1989, Nature, 342, 518
- Kong et al. (2002) Kong A.K.H., McClintock J.E., Garcia M.R., Murray S.S., Barret D., 2002, ApJ, 570, 227
- Lasota (2001) Lasota J.-P., 2001, NewARev, 45, 449
- Livio & Verbunt (1988) Livio M., Verbunt F., 1988, MNRAS, 232, 1p
- Loh et al. (2016) Loh A. et al., 2016, MNRAS, 462, L111
- Maitra et al. (2017) Maitra D., Scarpaci J.F., Grinberg V., Reynolds M.T., Markoff S., Maccarone T.J., Hynes R.I., 2017, ApJ, 851 148
- Marsh (1989) Marsh T.R., 1989, PASP, 101, 1032
- Martí et al. (2016) Martí J., Luque-Escamilla P.L., García-Hernández, M.T., 2016, A&A, 586, A58
- Martín et al. (1992) Martín E.L., Rebolo R., Casares J., Charles P.A., 1992, Nature , 358, 129
- Martín et al. (1996) Martín E.L., Casares J., Molaro P., Rebolo R., Charles P.A., 1996, NewA , 1, 197
- Mata Sánchez et al. (2018) Mata Sánchez D, Muñoz-Darias T., Casares J., Corral-Santana J.M., Shahbaz T., 2015, MNRAS, 454, 2199
- McClintock & Remillard (2006) McClintock J.E., Remillard R., 2006, Black Hole Binaries in Compact stellar X-ray sources, ed. W. Lewin & M. van der Klis, Cambridge Astrophysics Series, No. 39, Cambridge University Press, p.157
- Menou et al. (2000) Menou K., Hameury J.-M., Lasota J.-P., Narayan R., 2000, MNRAS, 314, 498
- Miller-Jones et al. (2008) Miller-Jones J.C.A., Gallo E., Rupen M.P., Mioduszewski A.J., Brisken W., Fender R.P., Jonker P.G., Maccarone T.J., 2008, MNRAS, 388, 1751
- Miller-Jones et al. (2009) Miller-Jones J.C.A. et al., 2009, ApJ, 706, L230
- Miller-Jones et al. (2019) Miller-Jones J.C.A. et al., 2019, Nature, 569, 374
- Motta et al. (2017a) Motta S.E., Kajava J.J.E., Sánchez-Fernández C., Giustini M., Kuulkers E., 2017a, MNRAS, 468, 891
- Motta et al. (2017b) Motta S.E. et al., 2017b, MNRAS, 471, 1797
- Muñoz-Darias et al. (2016) Muñoz-Darias T. et al., 2016, Nature, 534, 75
- Muñoz-Darias et al. (2017) Muñoz-Darias T. et al., 2017, MNRAS, 465, L124
- Muñoz-Darias et al. (2018) Muñoz-Darias T., Torres M.A.P., Garcia M., 2018, MNRAS, 479, 3987
- Natalucci et al. (2015) Natalucci L., Fiocchi M., Bazzano A., Ubertini P., Roques J.-P., Jourdain E., 2015, ApJ, 813, L21
- Neilsen & Lee (2009) Neilsen J., Lee J.C., 2009, Nature, 458, 481
- Neilsen et al. (2011) Neilsen J., Remillard R.A., Lee J.C., 2011, ApJ, 737, 69
- O’Donoghue (1986) O’Donoghue D., 1986, MNRAS, 220, 23p
- Oosterbroek et al. (1997) Oosterbroek T. et al., 1997, A&A, 321, 776
- Osterbrock (1989) Osterbrock, D.E., 1989, Astrophysics of Gaseous Nebulae and Active Galactic Nuclei (Mill Valley: University Science Books)
- Osaki (1985) Osaki Y., 1985, A&A, 144, 369
- Piano et al. (2017) Piano G., Munar-Adrover P., Verrecchia F., Tavani M.,Trushkin S.A, 2017, ApJ, 839, 84
- Plotkin et al. (2017) Plotkin R.M. et al., 2017, ApJ, 834, 104
- Plotkin et al. (2019) Plotkin R.M., Miller-Jones J.C.A., Chomiuk L., Strader J., Bruzewski S., Bundas A., Smith K.R., Ruan J.J., 2019, ApJ, 874, 13
- Ponti et al. (2012) Ponti G., Fender R.P., Begelman M.C., Dunn R.J.H., Neilsen J., Coriat M., 2012, MNRAS, 422, L11
- Proga & Kallman (2002) Proga D., Kallman T.R., 2002, ApJ, 565, 455
- Rahoui et al. (2017) Rahoui F. et al., 2017, MNRAS, 465, 4468
- Ramsay et al. (2012) Ramsay G., Cannizzo J.K., Howell S.B., Wood M.A., Still M., Barclay T., Smale A., 2012, MNRAS, 425, 1479
- Rana et al. (2016) Rana V. et al., 2016, ApJ, 821, 103
- Rodriguez et al. (2015) Rodriguez J. et al., 2015, A&A, 581, L9
- Rodi et al. (2017) Rodi J., Jourdain E., Roques J.-P., 2017, ApJ, 843, 3
- Roques et al. (2015) Roques J.-P., Jourdain E., Bazzano A., Fiocchi M., Natalucci L., Ubertini P., 2015, ApJ, 813, L22
- Sánchez-Fernández et al. (2017) Sánchez-Fernández C., Kajava J.J.E., Motta S.E., Kuulkers E., 2017, A&A, 602, 40
- Sanwal et al. (1996) Sanwal D., Robinson E.L., Zhang E., Colome C., Harvey P.M., Ramseyer T.F., Hellier C., Wood J.H., 1996, ApJ, 460, 437
- Shields et al. (1986) Shields G.A., McKee C., Lin D.N.C., Begelman M.C., 1986, ApJ, 306, 90
- Siegert et al. (2016) Siegert T. et al., 2016, Nature, 531, 341
- Smak (1984a) Smak J., 1984, Acta Astron., 34, 93
- Smak (1984b) Smak J., 1984b, Acta Astron., 34, 161
- Soubiran et al. (2013) Soubiran C., Jasniewicz G., Chemin L., Crifo F., Udry S., Hestroffer D., Katz D, 2013, A&A, 552, 64
- Tachibana et al. (2017) Tachibana Y., Yoshii T., Hanayama H., Kawai N., 2017, PASJ, 69, 63
- Tetarenko et al. (2017) Tetarenko A.J. et al., 2017, MNRAS, 469, 3141
- Tetarenko et al. (2019) Tetarenko A.J. et al., 2019, MNRAS, 482, 3
- Viallet & Hameury (2008) Viallet M., Hamuery J.-M., 2008, A&A, 489, 699
- Wachmann (1948) Wachmann A.A., 1948, Erg. Astr. Nach., 11(5), E42
- Wagner et al. (1991) Wagner R.M., Starrfield S.G., Howell S.B., Kreidl T.J., Bus, S. J., Cassatella A., Bertram R., Fried R., 1991, ApJ, 378, 293
- Wagner et al. (1992) Wagner R.M., Kreidl T.J., Howell S.B., Starrfield S.G., 1992, ApJ, 401, L97
- Wagner et al. (1994) Wagner R.M., Starrfield S.G., Hjellming R.M., Howell S.B., Kreidl T.J., 1994, ApJ, 429, L25
- Walton et al. (2015) Walton D.J. et al., 2015, Astron. Telegr., #7752.
- Walton et al. (2017) Walton D.J., 2017, ApJ, 839, 110
- Wolf et al. (1993) Wolf S., Mantel K.H., Horne K., Barwig H., Schoembs R., Baernbantner O., 1993, A&A, 273, 160
- Wood et al. (1989) Wood J.H., 1989, MNRAS, 239, 809
- Ziólkowski & Zdziarski (2018) Ziólkowski J., Zdziarski A.A., 2018, MNRAS, 480, 1580
- Zurita et al. (2003) Zurita C., Casares J., Shahbaz T., 2003, ApJ, 582, 369
- Zurita et al. (2004) Zurita C., Casares J., Hynes R.I., Shahbaz T., Charles P.A., Pavlenko E.P., 2004, MNRAS, 352, 877
- Zycki et al. (1999) Zycki P.T., Done C., Smith D.A., 1999, MNRAS, 309, 561