Gray Level Image Threshold Using Neutrosophic Shannon Entropy
Abstract
This article presents a new method of segmenting grayscale images by minimizing Shannon’s neutrosophic entropy. For the proposed segmentation method, the neutrosophic information components, i.e., the degree of truth, the degree of neutrality and the degree of falsity are defined taking into account the belonging to the segmented regions and at the same time to the separation threshold area. The principle of the method is simple and easy to understand and can lead to multiple thresholds. The efficacy of the method is illustrated using some test gray level images. The experimental results show that the proposed method has good performance for segmentation with optimal gray level thresholds.
Keywords: image segmentation, neutrosophic information, Shannon entropy, gray level image threshold.
AMS Classification: 68U10, 62H35.
1 Introduction
Image segmentation is a process that divides the image into its component parts. One of the most used methods is the thresholding one. Recent advances in the neutrosophic representation of information allow different possibilities for the development of new image segmentation techniques. Neutrosophic models have the ability to work with data uncertainty and appear as an alternative to improving the threshold selection process so we get the right segmentation. In this paper we use as a thresholding function the Shannon entropy of neutrosophic information.
Next, the structure of the article is the following: Section 2 gives the neutrosophication procedure for the gray level images. The proposed neutrosophication is very specific to the thresholding technique; Section 3 shows how Shannon entropy can be calculated for the neutrosophic information; Section 4 shows the thresholding algorithm; Section 5 shows experimental results; Section 6 shows the conclusions while the last section is the references one.
2 The Neutrosophic Information Construction
Neutrosophic representation of information was proposed by Smarandache [2], [7], [8] and [9] as an extension of fuzzy representation proposed by Zadeh [12] and intuitionistic fuzzy representation proposed by Atanassov [1]. Primary neutrosophic information is defined by three parameters: degree of truth , degree of falsity and degree of neutrality . In the next, we will show, how can construct the neutrosophic information for a gray level image, in such a way to be useful for threshold methods.
Consider the gray levels in the range . We denote with the multiset [11] of the gray levels existing in the whole image and take a point . Also, we denote with the multiset of gray levels existing in the image from the interval and with the multiset of gray levels existing in the image from the interval , that is:
| (1) |
| (2) |
The threshold represents the neutrality point between the two multisets and . Then, we calculate the average for gray levels lower than and the average for gray levels larger than with formulas:
| (3) |
| (4) |
For calculation the dissimilarity between two gray levels we will use the following metric [5], [6]:
| (5) |
Using the metric , we calculate the dissimilarities between each gray level and the averages , and the threshold . It results , and .
| (6) |
| (7) |
| (8) |
We denote the minimum between the dissimilarities and with:
| (9) |
With these dissimilarities, we will construct the neutrosophic
information associated with each gray level and related to the
threshold : the degree of truth , the degree of falsity
and the degree of neutrality .
The degree of truth:
| (10) |
The degree of falsity:
| (11) |
The degree of neutrality:
| (12) |
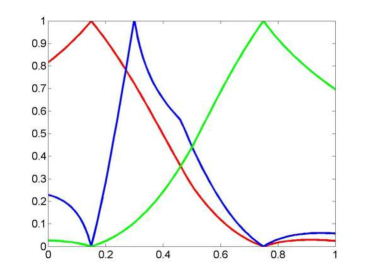
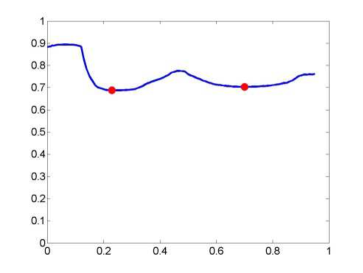
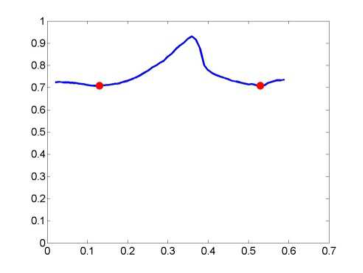
In figure 1, we can see the graphic of the functions , and for the particular case: , and
3 The Shannon entropy for neutrosophic information
In this paper, the Shannon function [10] is used as a measure for
the neutrosophic information uncertainty. We do the following notations:
The bifuzzy undefinedness :
| (13) |
The bifuzzy contradiction :
| (14) |
The escort fuzzy degree of truth :
| (15) |
The escort fuzzy degree of falsity :
| (16) |
Then, we calculate the neutrosophic Shannon entropy for each gray level using formula proposed in [3, 4].
| (17) |
In the space the Shannon entropy for neutrosophic
information verifies the general conditions of neutrosophic uncertainty
[4]:
i)
ii)
iii)
iv) if , and .
The property (iv) shows that the Shannon entropy decreases with , increases with and increases with .
From (iv) it results that because and . Also, we must mention that there exists the following equality:
| (18) |
4 The algorithm for thresholding operation
We denote by and . For each , we calculate the entropy average for the three fuzzy sets defined by the neutrosophic components , and . Here, the natural number is the step of threshold quantization. Typically, . It results the following three partial entropy functions: , , .
| (19) |
| (20) |
| (21) |
Then, we define the optimal function that is the total entropy, which is calculated with the average of the three partial entropies calculated above.
| (22) |
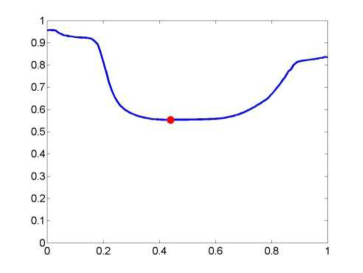
The segmentation thresholds are the local minimum points of the total entropy .
5 Experimental results
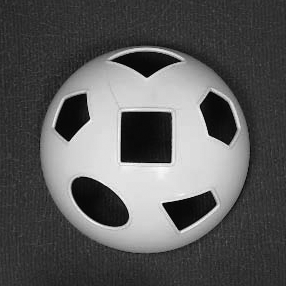
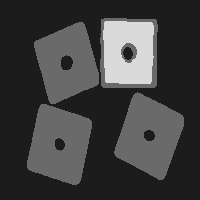
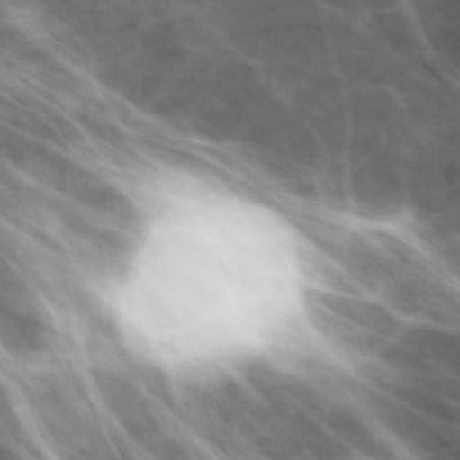
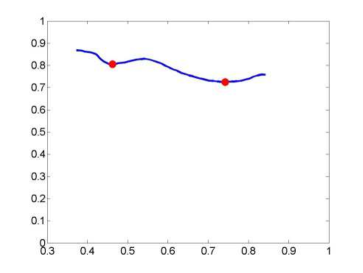
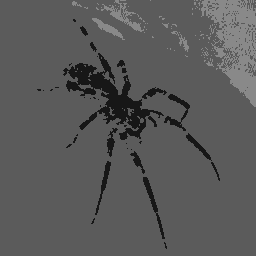
The proposed method was applied for segmentation of the following four images: ball, block, mammography and spider. The obtained results can be seen in figs. 2, 4, 6 and 8 while the entropy functions can be seen in figs. 3, 5, 7 and 9.
 |

|
| a) | b) |
 |
|
| a) | b) |
 |

|
| a) | b) |
 |
|
| a) | b) |
6 Conclusions
Based on the concept of neutrosophic information and the definition of the degree of truth, degree of neutrality and degree of falsity, a new image thresholding method is proposed. It utilizes the Shannon entropy in order to determine adequate threshold values. It is expected that the absolute value of the difference between degree of truth and degree of falsity for each pixel can be as close to 1 as possible, so that the entropy of each pixel is as minimal as possible. The proposed method which is based on minimizing the neutrosophic entropy of an image has demonstrated performance in multilevel thresholding. At the same time, the experimental results indicate that the proposed method can find appropriate threshold values.
References
-
1.
K. Atanassov. Intuitionistic Fuzzy sets. Fuzzy Sets and Systems 20, pp. 87-96, (1986).
-
2.
C. Ashbacher, Introduction to Neutrosophic Logic, American Research Press, Rehoboth, NM, (2002).
-
3.
V. Patrascu, Shannon entropy for imprecise and under-defined or over-defined information, The 25th Conference on Applied and Industrial Mathematics, CAIM 2017, Iasi, Romania, ROMAI Journal, vol. 14, no. 1, pp. 169-185, (2018).
-
4.
V. Patrascu, Shannon Entropy for Neutrosophic Information, doi:10.13140
/RG.2.2.32352.74244, arXiv:1810.00748, September, (2018). -
5.
V. Patrascu, A Novel Penta-Valued Descriptor for Color Clustering, The 6th International Conference on Image and Signal Processing, ICISP 2014, Cherbourg, Normandy, France, June 30 - July 2, 2014, Volume: Image and Signal Processing, Lecture Notes in Computer Science, Volume 8509, Springer International Publishing Switzerland, pp. 173-182, (2014).
-
6.
V. Patrascu, New Framework of HSL System Based Color Clustering Algorithm, The 24th Midwest Artificial Intelligence and Cognitive Sciences Conference, MAICS 2013, April 13-14, 2013, New Albany, Indiana. USA, ceur-ws.org, Vol. 1348, pp. 85-91, (2013).
-
7.
U. Rivieccio, Neutrosophic Logics: Prospects and Problems, Fuzzy Sets and Systems, 159, pp. 1860-1868, (2008).
-
8.
F. Smarandache, A Unifying Field in Logics: Neutrosophic Logic. Neutrosophy, Neutrosophic Set, Neutrosophic Probability, American Research Press, Rehoboth, NM, (1999).
-
9.
F. Smarandache, Neutrosophic Set - A Generalization of the Intuitionistic Fuzzy Set, International Journal of Pure and Applied Mathematics, 24, no. 3, pp. 287-297, (2005).
-
10.
C.E. Shannon, A mathematical theory of communication, Bell System Tech., J. 27, pp. 379-423, (1948).
-
11.
Wikipedia, https://en.wikipedia.org/wiki/Multiset.
-
12.
A. L. Zadeh. Fuzzy sets, Information and Control, 8, pp. 338-353, (1965).