Another relic bulge globular cluster: ESO 456-SC38 (Djorgovski 2)††thanks: Observations obtained at the Hubble Space Telescope, GO-14074 (PI: Cohen), and the European Southern Observatory, proposal 089.D-0493(A) (PI: Saviane).
Abstract
Context. The object ESO456-SC38 (Djorgovski 2) is one of the globular clusters that is closest to the Galactic center. It is on the blue horizontal branch and has a moderate metallicity of [Fe/H]-1.0. It is thus similar to the very old inner bulge globular clusters NGC 6522, NGC 6558, and HP 1, and therefore appears to be part of the primeval formation stages of the Milky Way.
Aims. The aim of this work is to determine an accurate distance and metallicity for ESO456-SC38, as well as orbital parameters, in order to check similarities with other clusters in the inner bulge that have previously been well studied in terms of spectroscopy and photometry. This is a considerably fainter cluster that is contaminated by a rich stellar field; it is also quite absorbed by the dusty foreground.
Methods. We analyzed ESO456-SC38 based on Hubble Space Telescope photometry, with the filters F606W from ACS, F110W and F160W from WFC3, and photometry in V and I from FORS2 at the VLT. We combined this with identified stars that are covered by Gaia Data Release 2.
Results. The isochrone fitting was carried out with the statistical Markov chain Monte Carlo method. We derive an accurate distance of d kpc and a reddening of E(B-V). The best-fitting BaSTI isochrones correspond to an age of Gyr and a metallicity of [Fe/H].
Conclusions. ESO 456-SC38 adds to the list of moderately metal-poor globular clusters located in the inner bulge. It is on the blue horizontal branch and is very old. The cluster is confined to the bulge and bar region, but it does not support the Galactic bar structure. The old stellar population represented by clusters like this has to be taken into account in models of Galactic bulge formation. Studying them also provides indications on the formation times of the globular clusters themselves.
Key Words.:
Galaxy: Bulge - Globular Clusters: individual: Djorgovski 21 Introduction
Colour-magnitude diagrams (CMD), abundances, and kinematics of globular clusters (GCs) have been essential for understanding the formation and evolution of the Milky Way (MW). To mention a few, the studies of Searle & Zinn (1978), Renzini & Fusi Pecci (1988), Minniti (1995), Ortolani et al. (1995), and Barbuy et al. (1998a), Côté (1999) at the end of the last century helped shape the role of GCs in our understanding of the MW as we see it today. The multi-population content of many GCs is an additional clue to their very nature (e.g., Piotto et al. 2015, and references therein).
Globular clusters in the Galactic bulge consist of prominent populous clusters as well as some poorly populated clusters. Minni 22 is a recent example of the latter, with [Fe/H] (Minniti et al. 2018). On the other hand, the halo, in particular the outer halo, harbors many faint and ultra-faint clusters (UFC) that may represent the low end of the luminosity function of GCs, at times at the verge of dissolution (see, e.g., Luque et al. 2016 for two faint halo clusters revealed in the Dark Energy Survey, DES). These halo UFCs are mostly old, with evidence that they have recently been accreted by the MW. Taking into account faint bulge and halo stellar systems such as GC subclasses together with various GCs that are extremely absorbed and/or contaminated by rich stellar fields, Bica et al. (2019) compiled 200 of them in the MW by including those studied by Minniti et al. (2018) and others. This represents an increase of 37% with respect to the compilation of Harris (1996), and is an increase of 27% comparted to his 2010 version. Bica et al. also compiled 94 GC candidates, most of them toward the bulge. This suggests that additional GCs lie still farther away in the bulge region.
The bulge and bulge-halo (or inner halo) characterizations can distinguish these GC populations (Bica et al. 2016) as long as distances and other basic cluster parameters are well constrained and lead to their orbits (e.g., Pérez-Villegas et al. 2018, Ortolani et al. 2019). The Galactic bulge contains a variety of clusters, from the most metal-rich in the Galaxy to moderately metal-poor clusters with a peak at [Fe/H] (Bica et al. 2016). Only one cluster is confirmed to be more metal poor than this, which is Terzan 4 with [Fe/H] (Origlia & Rich 2004). Bica et al. (2016) listed the metallicities and abundances of bulge globular clusters obtained with spectroscopy, that are available in the literature (their Table 3). The compilation by Harris (1996, edition 2010) also includes estimates based on photometry, which can be more uncertain.
There appears to be a concentration of GCs with a metallicity of [Fe/H] together with a blue horizontal branch (e.g., Bica et al. 2016, Cohen et al. 2018). Field halo stars with [Fe/H] are very rare because this is the high end of the halo metallicity distribution function (e.g., An et al. 2013); the distribution of globular cluster metallicities from Harris (1996, edition 2010) shows a small peak at [Fe/H]-1.0, where essentially all correspond to clusters located in the bulge (Bica et al. 2016).
These objects appear to be among the oldest in the central bulge and the MW itself, such as NGC 6522, HP1, and NGC 6558. These clusters were analyzed spectroscopically for instance by Barbuy et al. (2014, 2016, 2018b). NGC 6522 was found to be the oldest in the sample by Meissner & Weiss (2006), and also in the estimation by Barbuy et al. (2009). NGC 6522 and HP1 were shown to be very old, with about 13 Gyr, by Kerber et al. (2018, 2019). The old stellar populations seen in GCs are thought to have a counterpart in the bulge field (e.g., Renzini et al. 2018, and references therein). One particular evidence for this are the RR Lyrae stars, which have a similar metallicity peak at [Fe/H]-1.0 as the moderately metal-poor bulge GCs (e.g., Pietrukowicz et al. 2012; Saha et al. 2019). Further evidence for this comes from Schultheis et al. (2015), who have found a peak of bulge field stars at [Fe/H] that show an enhancement in alpha-elements, and Schiavon et al. (2017), who identified a sample of nitrogen-rich stars that also show metallicities of [Fe/H] .
Our group has been carrying out deep photometry and high-resolution spectroscopy, as well as proper-motion cleaned data, by employing two epochs of bulge globular clusters (e.g., Rossi et al. 2015a, Pérez-Villegas et al. 2018) to derive their parameters and dynamical properties. The ultimate goal is understanding the earliest formation processes of the central parts of the Galaxy (Barbuy et al. 2018a).
This study deeply explores an apparently additional GC member of that group, ESO456-SC38 (Djorgovski 2). This object was already an entry in the Barbuy et al. (1998) central bulge sample.
The source ESO 456-SC38 was discovered by Holmberg et al. (1978) and published in the sixth list of the ESO/Uppsala survey of the ESO (B) atlas of the southern sky. They classified the object as an open cluster, while Djorgovski (1987) classified it as a GC, so that it is often referred to as Djorgovski 2 (or Djorg 2).
ESO456-SC38, or Djorgovski 2 (Djorgovski 1987), is located at = 18h01m49.0s, = 27o, with Galactic coordinates l = 277, b = 250. ESO456-SC38 is projected on a very contaminated central bulge stellar field. With CMDs in the and bands, Ortolani et al. (1997) derived a reddening and a metallicity [Fe/H] . A high metallicity, dex, was also derived by Valenti et al (2010) from near-infrared photometry. Harris (1996, version 2010) reported and [Fe/H] , and also provided an integrated absolute magnitude of . This means that this is an intermediate-luminosity GC.
Vásquez et al. (2018) derived a metallicity of [Fe/H] and a radial velocity of v km s-1 from three stars using spectroscopic observations of the Ca II triplet (CaT). Dias et al. (2016) obtained a heliocentric radial velocity of km s-1 using spectra in the visible region of four member stars. The derived metallicity is quite uncertain in the range [Fe/H] to depending on the adopted spectral library.
We here use accurate Gaia proper-motion selected CMDs for the bright stars, combined with deep photometry from the Hubble Space Telescope (HST) and the Very Large Telescope (VLT), to determine the metallicity and distance of this cluster. Orbital parameters are then derived in order to verify its role as an additional key GC for constraining the bulge properties and its history.
In Section 2 we present the observations and the data reductions. In Sect. 3 we derive the cluster parameters, based on HST and VLT CMDs with superimposed red giants that have been measured with Gaia. The orbit parameters are then derived in Sect. 4. Conclusions are drawn in Sect. 5.
2 Observations and data reduction
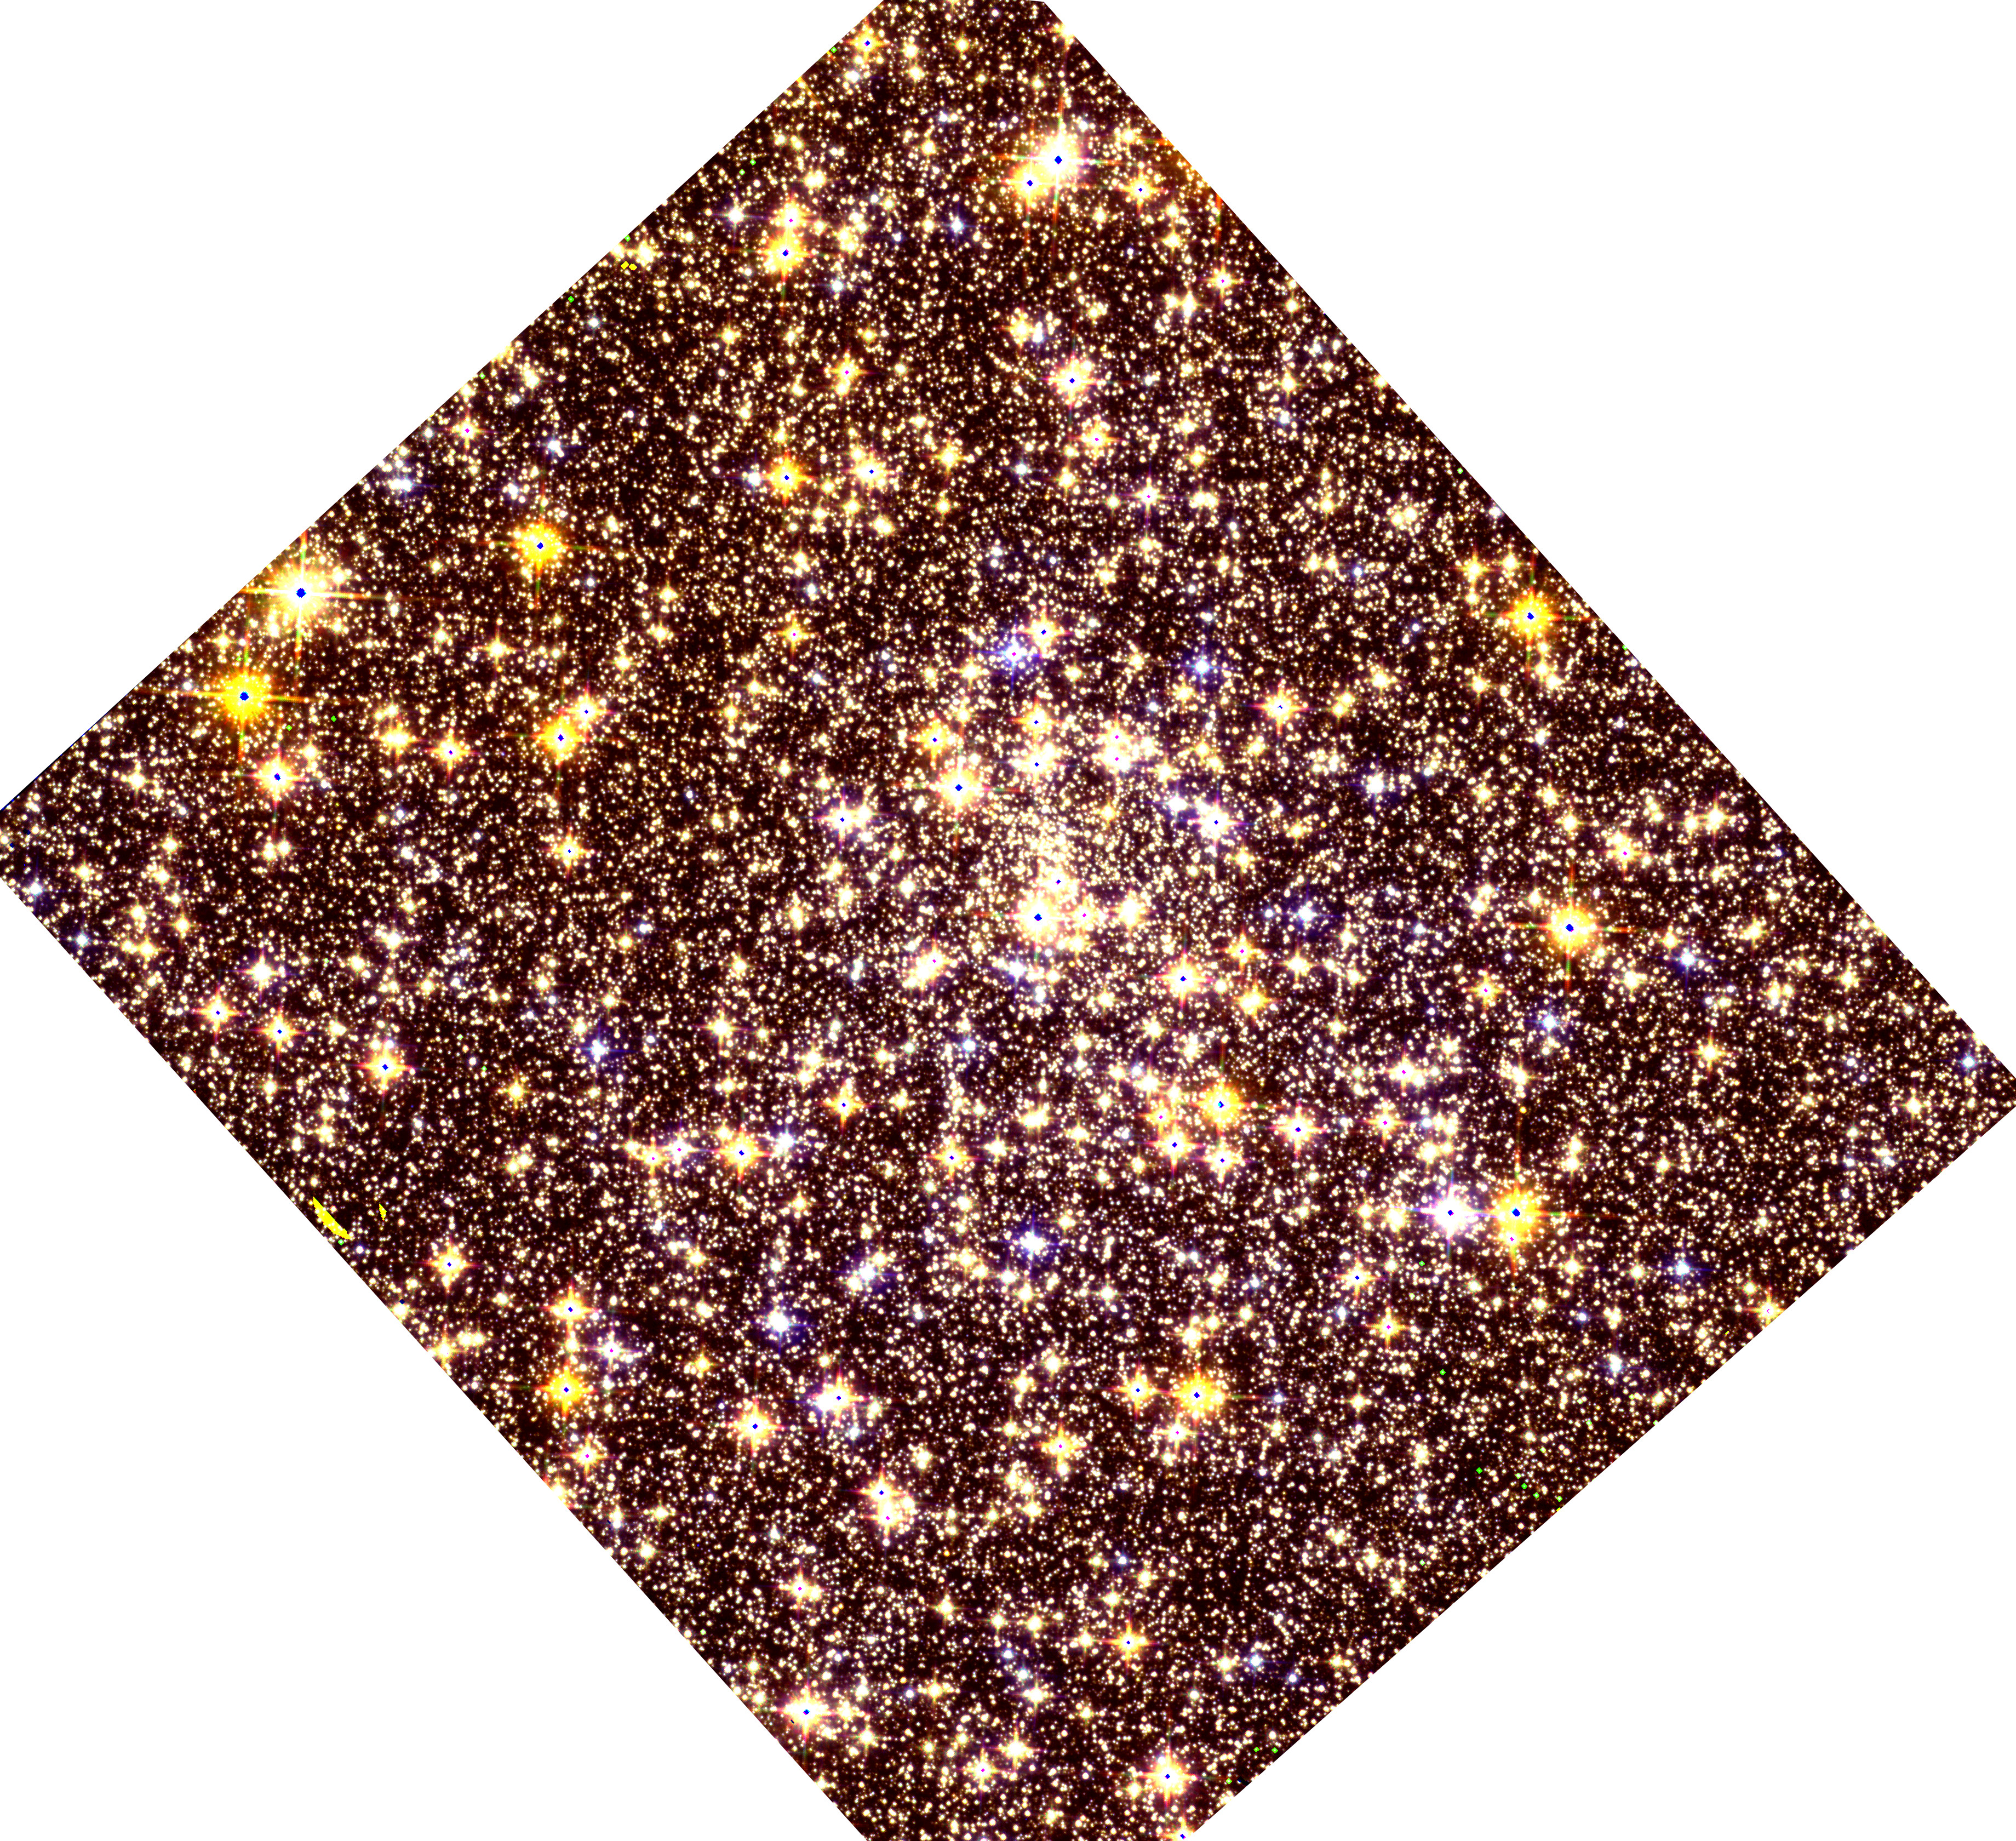
We used available HST and VLT observations of the cluster. We made use of HST observations collected during the mission GO-14074 (PI: Cohen, mean epoch 2016.4) in F606W with the Wide Field Channel (WFC) of the Advanced Camera for Surveys (ACS), and in F110W and F160W with the IR channel of the Wide Field Camera 3 (WFC3). For the data reduction we adopted the software kitchen_sync2, developed by J. Anderson (Anderson et al. 2008) that was also used by Nardiello et al. (2018) to extract an atlas of 56 GCs. Briefly, using flc images (i.e., corrected for charge transfer inefficency, Anderson & Bedin 2010) and perturbed empirical arrays of point spread functions (PSF), the software analyzes all the exposures simultaneously to find and measure the sources. We refer to Nardiello et al. (2018) and Bellini et al. (2017) for a detailed description of this approach. The magnitudes were calibrated into the Vega-mag system by comparing aperture photometry on drc images against our PSF-fitting photometry and adopting the photometric zero-points given by the ACS zero-points calculator111https://acszeropoints.stsci.edu/ in the case of ACS/WFC observations, and by Kalirai et al. (2009) in the case of WFC3/IR data. A three-color image of the field observed with HST is shown in Fig. 1.
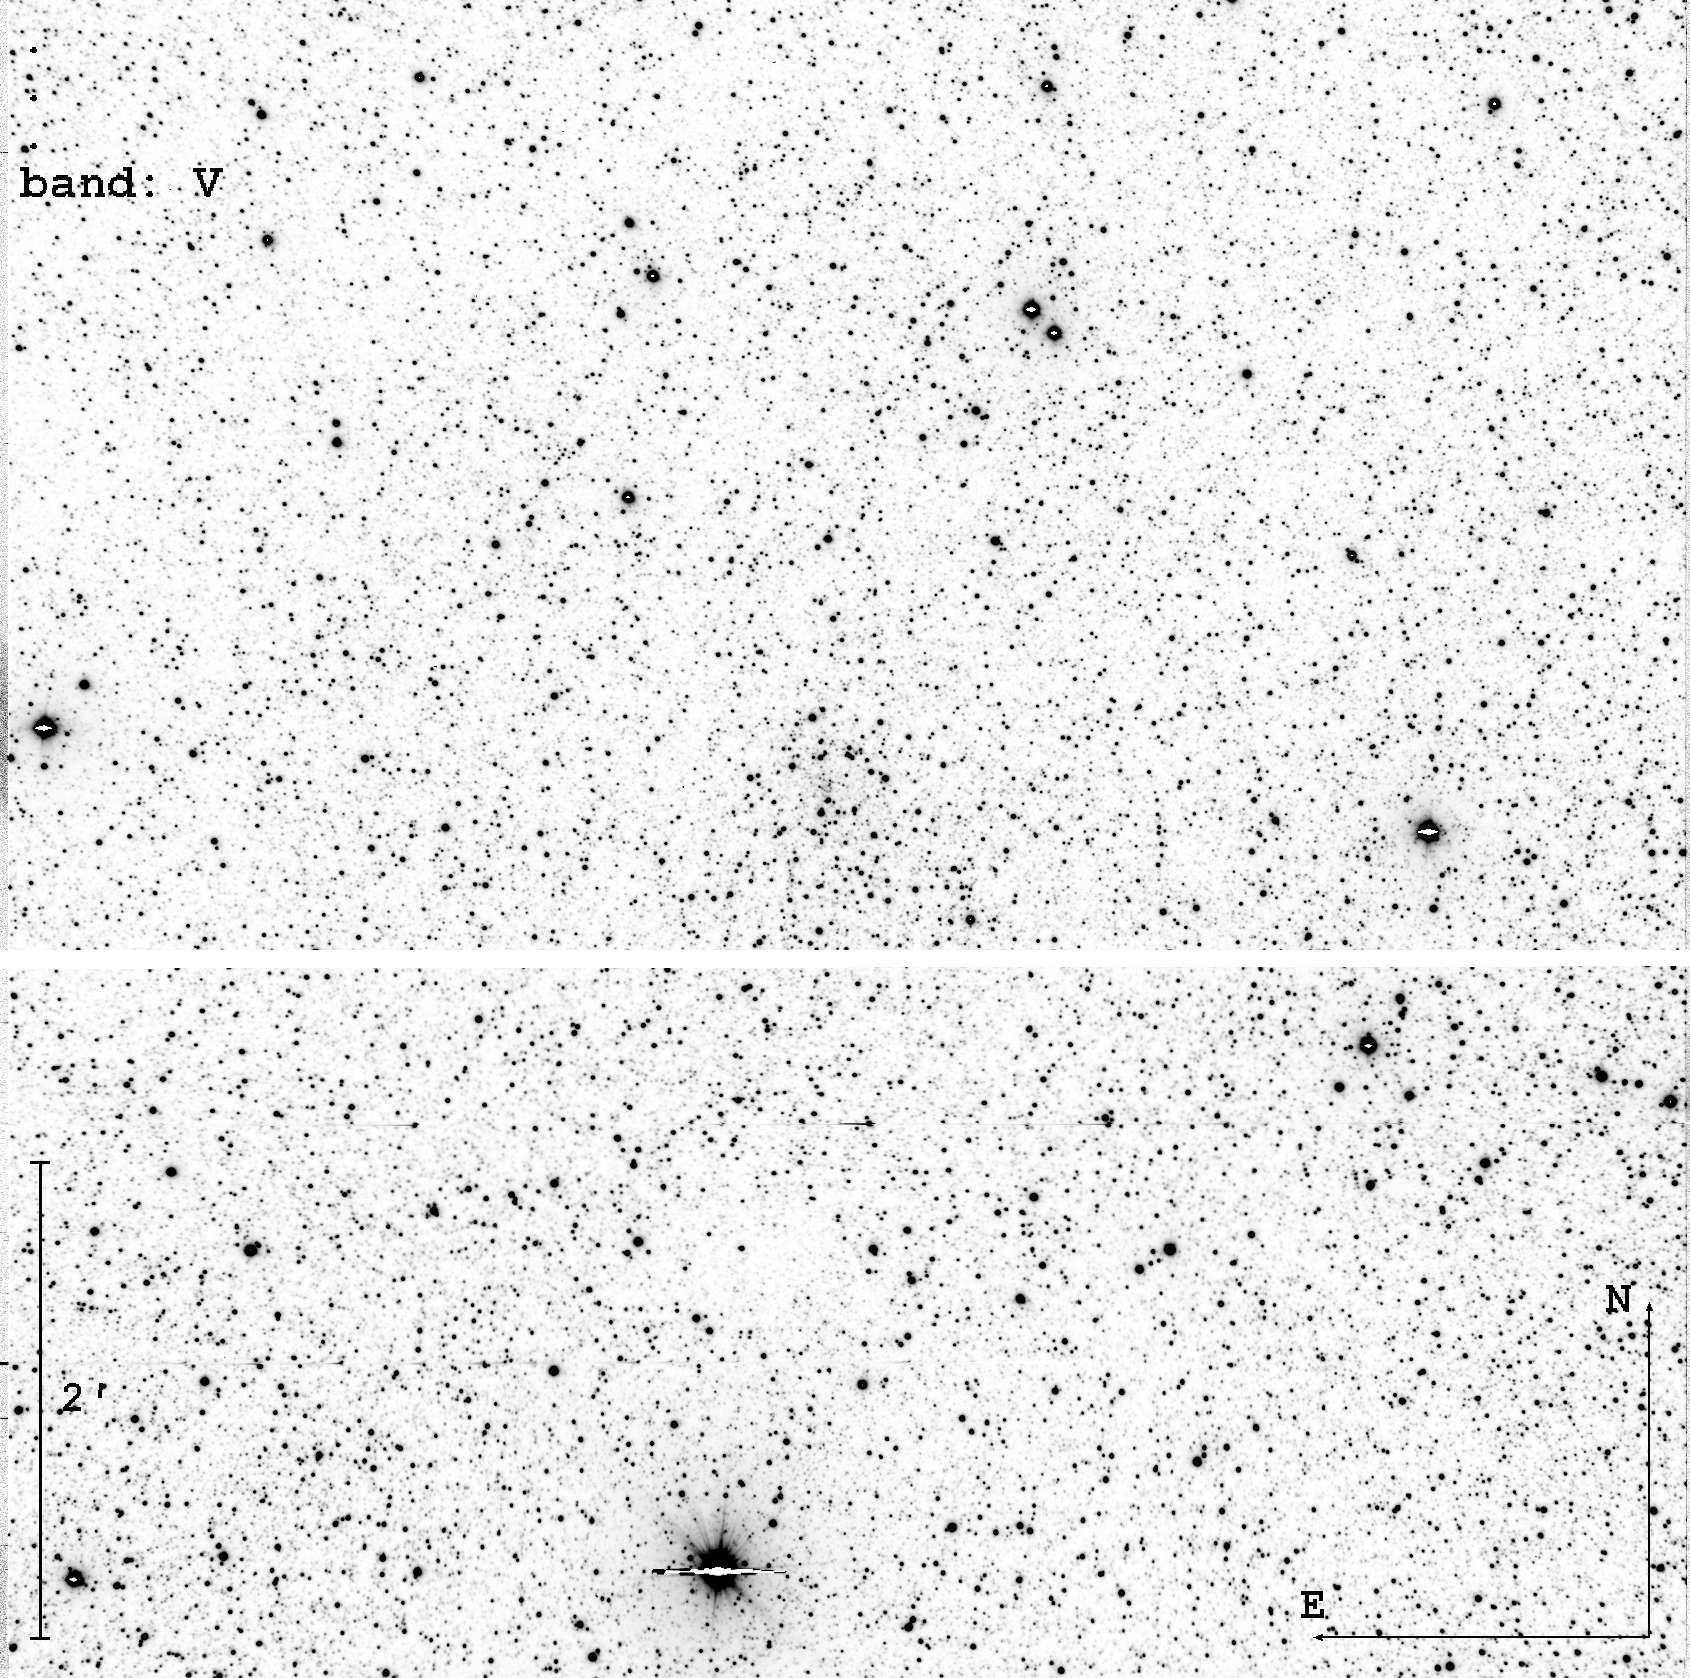
The VLT imaging observations were obtained with FORS2 during a preimaging run for our spectroscopic survey of MW globular clusters (Saviane et al. 2012; Dias et al. 2016; Vásquez et al. 2018). The cluster was observed under excellent seeing conditions ( arcsec FWHM), using 30s exposures in and complemented by very short exposures (0.25s) to allow photometry of the otherwise saturated brightest red giant stars. Photometry was obtained with daophot and allstar (Stetson 1987). Because sky conditions were not always photometric during the preimaging observations, the zero-point of our photometry was tied to the well-calibrated observations obtained at the Danish telescope by Ortolani et al. (1997), properly taking into account the color transformations. The original zero-point error was estimated to be of 0.03 mag. Because the transfer error is 0.02 mag, we estimate a total budget error of 0.04 mag for both colors. In Fig. 2 we show a image of ESO456-SC38 from FORS2.
3 Color-magnitude diagrams and cluster parameters
| E(B-V) | d⊙ | RGC | [Fe/H] | vr | ref. |
| (kpc) | (kpc) | (dex) | (km s-1) | ||
| — | 1 | ||||
| — | 2 | ||||
| — | 3 | ||||
| — | — | — | 4 |
3.1 Gaia DR2 cross-identifications
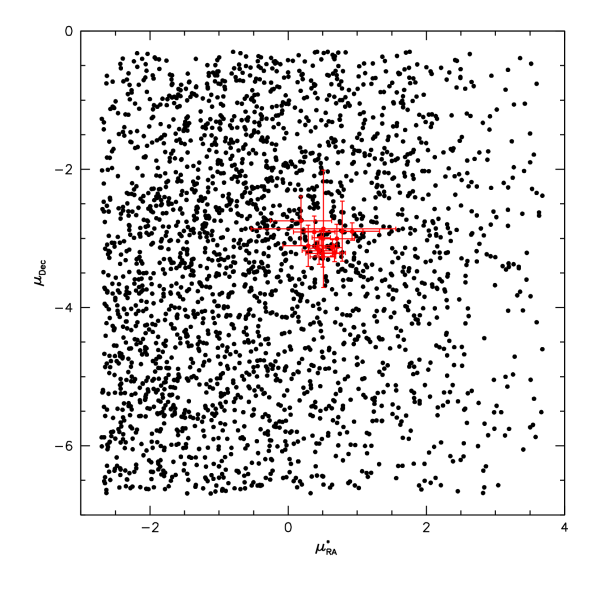
The merged catalogs of ACS+WFC3 and FORS2 at the VLT were matched to the Second Data Release of Gaia (Gaia collaboration 2018a,b) using topcat (Taylor 2005). There are only a few stars in common, therefore no cuts due to Gaia DR2 flags were applied. For the match we adopted a maximum distance of 0.3 arcsec. A plot of the cross-identified stars in the proper motion space shows a clearly detectable excess around mas/yr, mas/yr, which we identified as the mean proper motion of ESO456-SC38, in agreement with the value derived by Vasiliev (2019) and Baumgardt et al. (2019). We selected a subsample of stars within a radius of 1.7 mas around the mean proper motion to increase the cluster membership probability and reduce the contamination by the Galactic disk and bulge. The mean parallax of this subsample is 0.075 mas (). In view of this large error, we refrain from deriving a geometric distance from this parallax. However, we note that adding the mean systematic error that is known to affect the parallax in Gaia DR2 (Gaia Collaboration et al. 2018b), this value suggests a long distance of kpc.
3.2 Color-magnitude diagrams and isochrone fitting
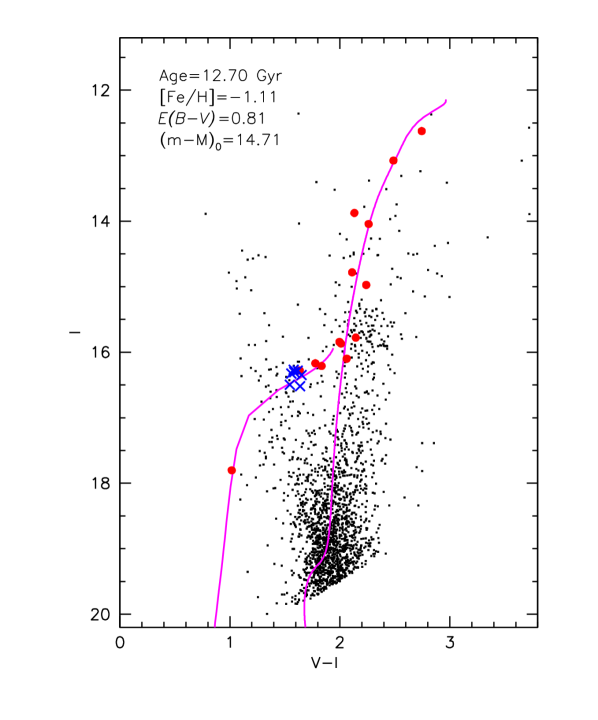
In Figs. 3 and 5 we plot the inner region of the CMD (within 0.3 arcmin and 0.9 arcmin of the cluster center, respectively) from the HST and VLT data. The subsample of probable cluster members from the Gaia DR2 match is plotted as red dots.
The BaSTI (Pietrinferni et al. 2004, 2006) alpha-enhanced stellar evolution models222http://basti-ao-abruzzo.inaf.it/index.html were adopted for the isochrone fitting. The isochrones were corrected for reddening dependent on effective temperatures, as discussed in Ortolani et al. (2017). We used for that purpose the star-by-star reddening provided for the Padova isochrone model set333http://stev.oapd.inaf.it/cgi-bin/cmd_2.3 (Bressan et al. 2012). This correction mainly shrinks the CMDs in color, and the fit quality greatly improves for very reddened clusters, as shown for Djorg 1 (Ortolani et al. 2019).
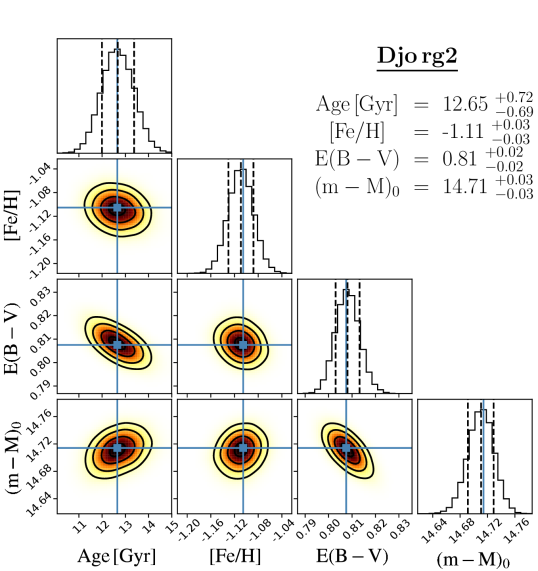
In Fig. 3 the HST mF606W vs. mF606W - mF110W CMD of ESO46-SC38 is fit with a Bayesian approach. The code Statistical Inference of physical paRameters of sIngle and mUltiple populations in Stellar clusters (SIRIUS) by Souza et al. (in preparation) applies statistical isochrone fitting following a Bayesian approach with the Markov chain Monte Carlo (MCMC) sampling method, in order to derive the age, metallicity, reddening, and distance. The method is described in Kerber et al. (2019).
In the middle and right panels of Fig. 3 we superimpose the same parameters as are adopted in the left panel of Fig. 3 for the CMDs mF110W vs. mF110W - mF160W (middle) and mF606W vs. mF606W - mF160W (right). This shows a very good compatibility. A corner plot relative to the mF606W vs. mF606W - mF110W CMD (left panel in Fig. 3) is presented in Fig. 4.
In these figures, the isochrone fitting the deep HST photometry is located near the blue edge of the main sequence (MS). This is due to a combined effect of field contamination (prevailing on the red side), binarity, and loss of completeness in the cluster sequence at the faint end.
We also point out that the presence of a blue horizontal branch (BHB) is confirmed from counting the relative number of stars in the horizontal branch (HB) and red giant branch (RGB). The number of HB stars is about 20-30% higher than the number of RGB stars, in agreement with other globular clusters and the typical evolution timescale ratio (see, e.g., Iben et al. 1969). In addition, the BHB is well fit in Fig. 3. The foreground and background contamination from the MW is small in the region of the HB.
By adopting this statistical method for the fitting procedure, we derive an age of Gyr, a metallicity of [Fe/H], a reddening of E(B-V) and a distance modulus of (m-M) or a distance of kpc. The metallicity obtained from the MCMC fitting of [Fe/H]=-1.110.03 and [/Fe]=+0.4 (Z0.004) is in excellent agreement with the spectroscopic value of [Fe/H] by Vásquez et al. (2018).
3.3 Distance to ESO456-SC38
In Fig. 5 we compare the FORS2 data with a BaSTI isochrone using the parameters derived from the MCMC isochrone fit to HST data. This comparison provides support and confirmation of the HST fit.
We inspected the OGLE III catalog of RR Lyrae stars (Soszyński et al. 2014) and considered seven of them that are also reported in Clement et al. (2001). These seven RR Lyrae stars (plotted as crosses in Fig. 5) have mean magnitudes , , and . Assuming (Gaia Collaboration et al. 2017) and a metallicity [Fe/H] , we obtain . The error in comes from the error in metallicity, which in our case is 0.03. Assuming total-to-selective absorption , and , the distance modulus from RR Lyrae results in (m-M)0 = 14.8 and a distance of 9.12 kpc. This distance is in good agreement with the distance values from the CMD fits, 8.750.12. This distance is significantly larger than the 6.3 kpc value given in Harris (1996) that was adopted by Baumgardt et al. (2019) for their dynamical calculations.
For the data in Fig. 5, we adopted a radial selection within 0.9 arcmin, which is the scale radius of a Plummer profile from Vasiliev (2019). For our stars in Gaia DR2, the sample is defined by a more restrictive radial selection of half of the scale radius plus a selection in proper motion space (vector diagram) equal to a radius 0.5 mas/yr around the mean proper motion of the cluster as determined by Vasiliev (2019) and Baumgardt et al. (2019) using a rigorous statistical approach. The radius was selected by visual inspection of the diagram to restrictively encompass the cluster overdensity in the proper motion space. This region is comparable to the region of the cluster member candidates described by Vasiliev (2019) in his Figure 1. The distribution of our Gaia-identified star sample in proper motion space is shown in Fig. 6 with errors given in Gaia DR2.
4 Orbital properties
For the first time, we have the entire information on ESO456-SC38 that is needed to estimate its probable Galactic orbit. We used a combination of the proper motions from Gaia DR2 (from Vasiliev 2019, confirmed by our analysis), the recent radial velocity determinations using CaT spectra (Vásquez et al. 2018), and the accurate distance calculated in this work.
In our analysis, we employed a nonaxisymmetric model for the Galactic gravitational potential. The model has an axisymmetric background made by an exponential disk built from the superposition of three Miyamoto-Nagai potentials (Miyamoto & Nagai 1975) following the recipe by Smith et al. (2015), and a Navarro-Frenk-White (NFW) density profile (Navarro et al. 1997) to model the dark matter halo, which has a circular velocity km s-1 at kpc (Bland-Hawthorn & Gerhard 2016). On the axisymmetric background, a triaxial Ferrer’s bar potential is superimposed. The total bar mass is M⊙, an angle of with the Sun-major axis of the bar, a gradient of the pattern speed of the bar of , 45, and 50 km s-1 kpc-1, and a major axis extension of 3.5 kpc. We kept the same bar extension, but changed the bar pattern speed.
The orbits were integrated with the NIGO tool (Rossi 2015b), which includes the potentials mentioned above. The solution of the equations of motion was found numerically using the Shampine–Gordon algorithm (for details, see Rossi 2015c). The initial conditions of ESO456-SC38 were obtained from the observational data, coordinates, heliocentric distance, radial velocity, and absolute proper motions given in Table 2. The velocity components of the Sun with respect to the local standard of rest are km s-1 (Schönrich et al. 2010), where U, V, W, are positive in the direction of the Galactic center, Galactic rotation, and North Galactic Pole, respectively. We generated a set of 1000 initial conditions using a Monte Carlo method, taking into account the errors in distance, heliocentric radial velocity, and absolute proper motion in both components to estimate the effect of the uncertainties associated with the cluster parameters. We integrated these initial conditions forward for 10 Gyr.
For each orbit, we calculated the perigalactic distance , apogalactic distance , the maximum vertical excursion from the Galactic plane , and the eccentricity defined by . In order to determine whether the orbital motion of the cluster has a prograde or a retrograde sense with respect to the rotation of the bar, we calculated the component of the angular momentum in the inertial frame, . Because this quantity is no longer conserved in a model with nonaxisymmetric structures, we are interested only in the sign of the maximum and minimum .
| Parameter | Value | Ref. |
|---|---|---|
| 18h01m49.0s, 27o | This work | |
| (km s-1) | 1 | |
| (kpc) | This work | |
| † (mas yr-1) | 2 | |
| † (mas yr | 2 |
References — (1) Vásquez et al. (2018); (2) Vasiliev (2019).
†Uncertainty includes a systematic error of 0.035 mas yr-1
(Gaia Collaboration et al. 2018b).
Figure 7 shows the probability densities of the orbits in the and projection co-rotating with the bar. The red and yellow colors exhibit the region of space that the set of orbits for ESO456-SC38 crosses most frequently. The black curves are the corresponding orbits using the central values of the cluster observational parameters given in Table 2.
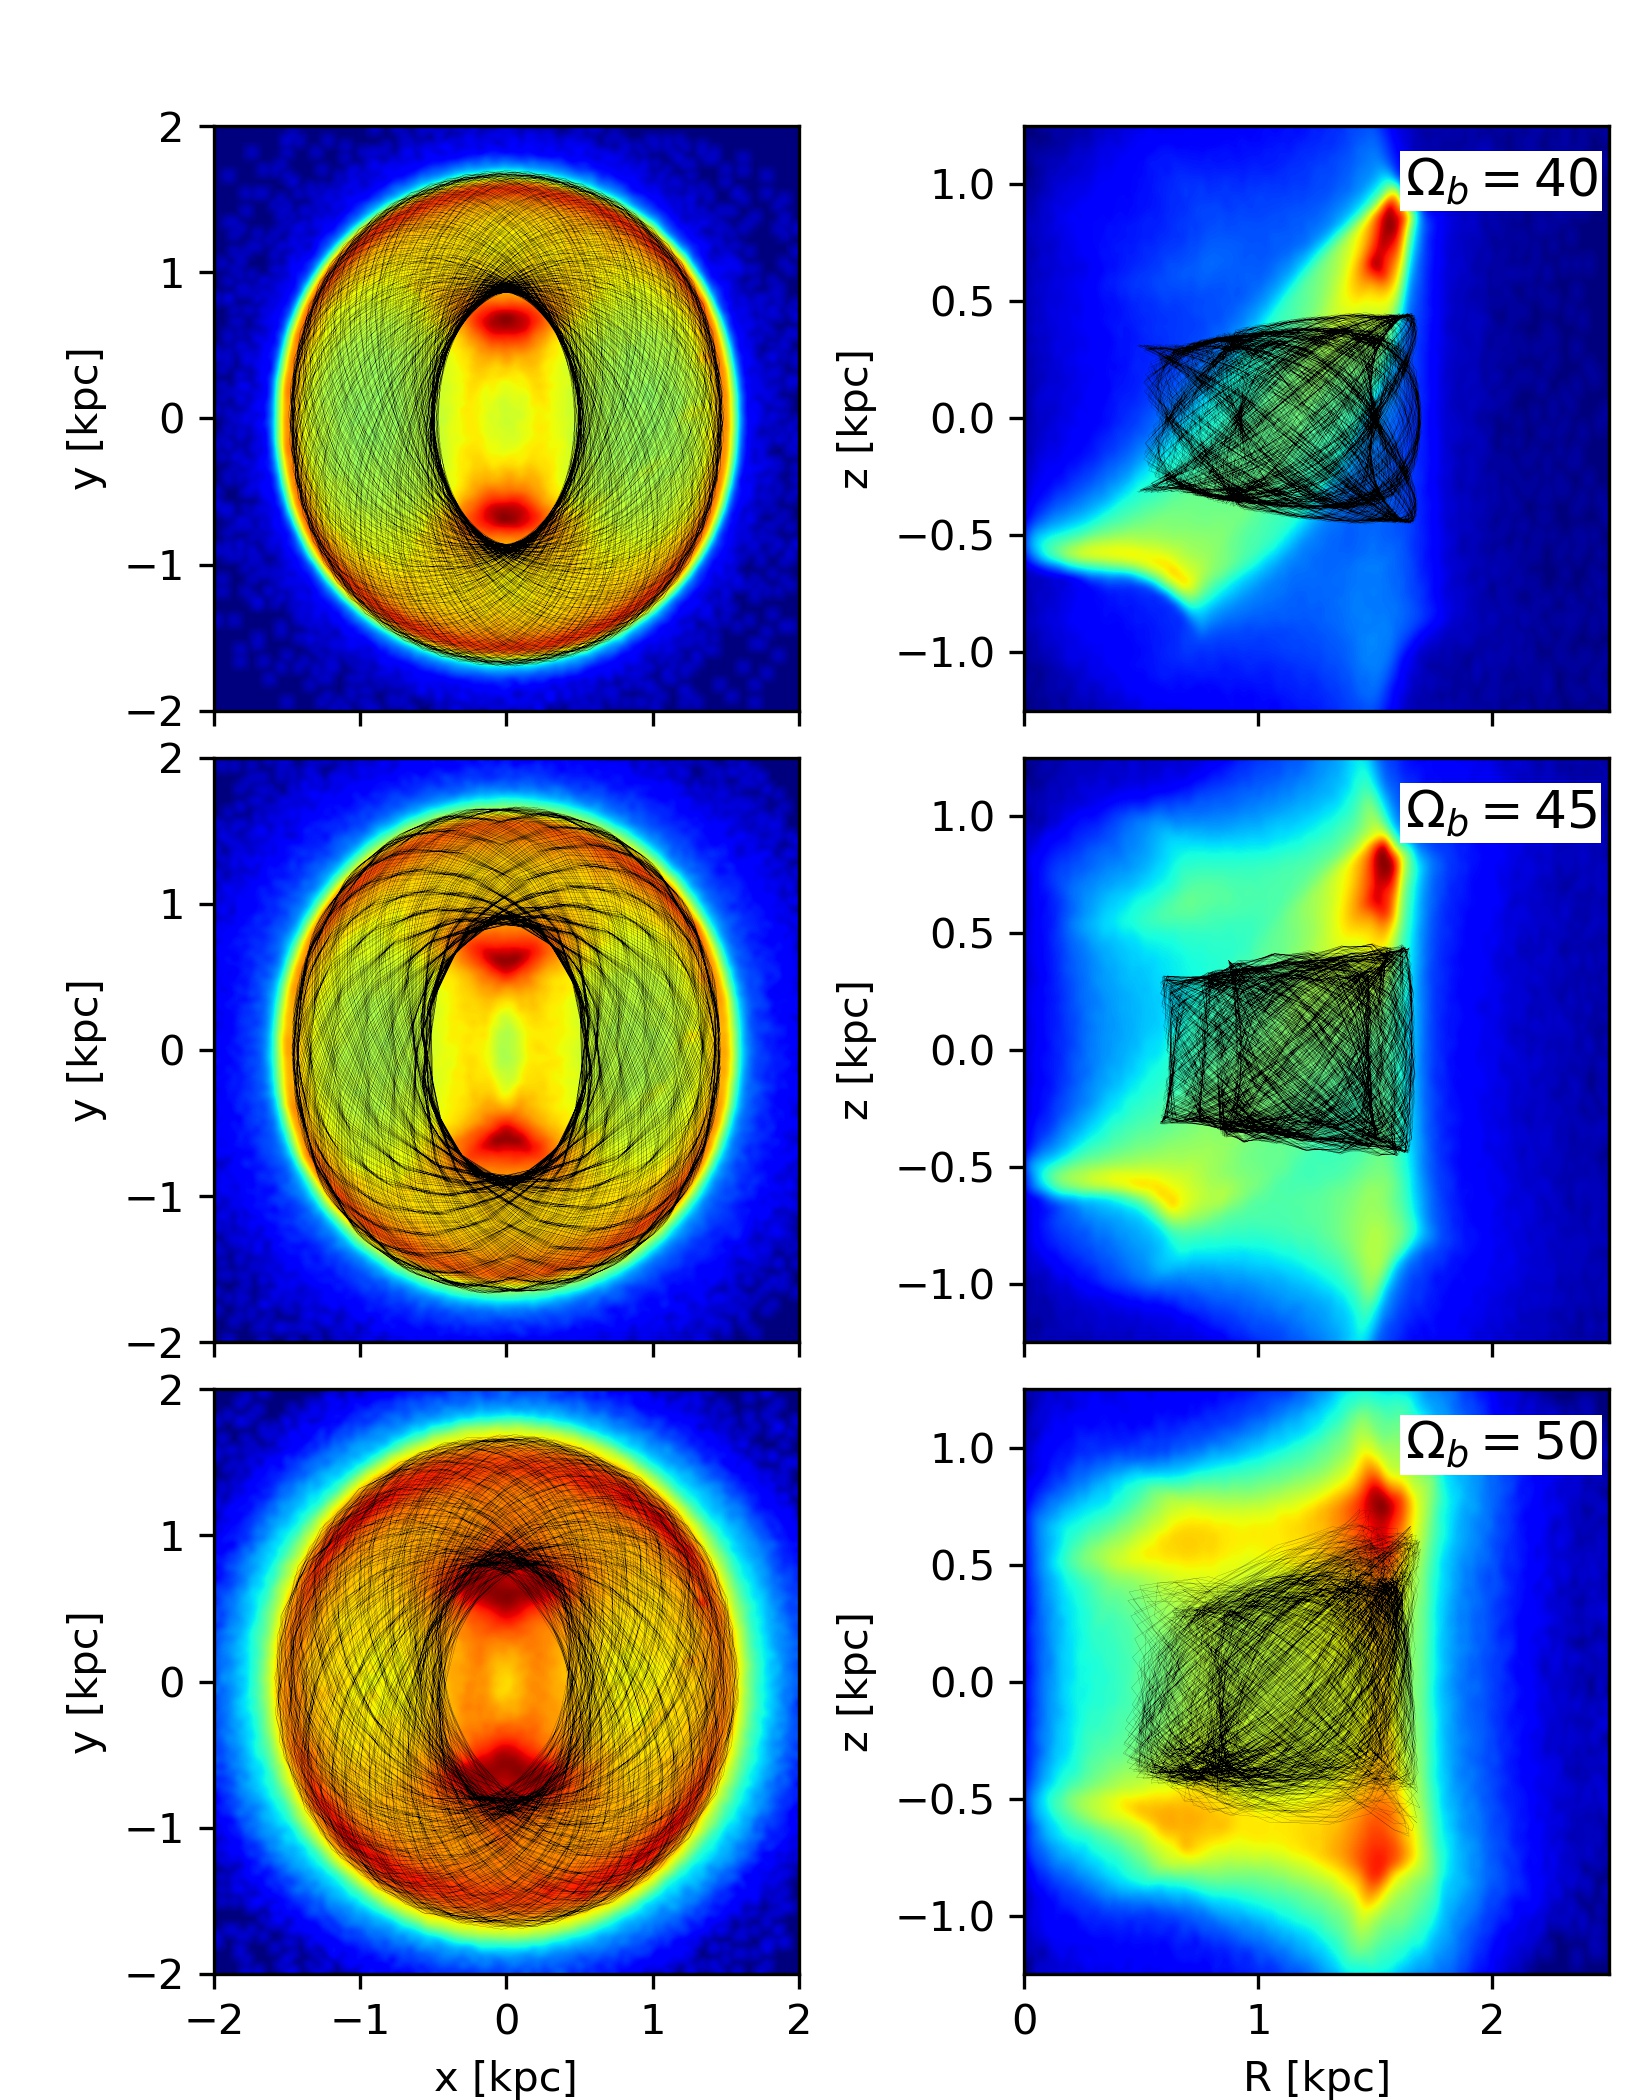
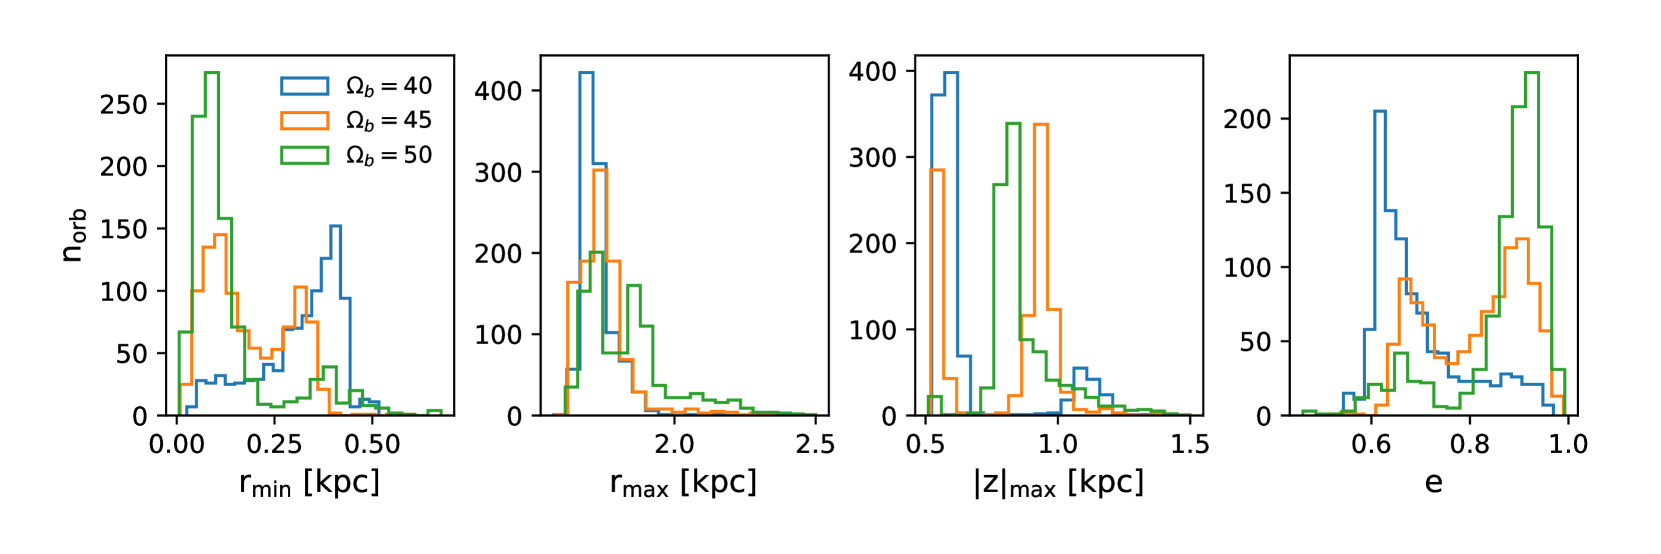
Distributions for the perigalactic distance, apogalactic distance, maximum vertical height, and eccentricity for ESO456-SC38 are presented in Fig. 8, where the different colors represent the angular velocities investigated here. The cluster has radial excursions between and kpc with maximum vertical excursions from the Galactic plane between and kpc, and the eccentricity is between and . Additionally, the distribution of the perigalactic distance and eccentricity are sensitive to the pattern speed, that is, with a faster angular velocity of the bar, the perigalactic distance is closer to the Galactic center and the eccentricity increased. In the maximum vertical excursion, the orbits are more confined to the plane with a lower pattern speed. The apogalactic distance behaves similarly as the pattern speeds. Even though the sample of orbits for ESO456-SC38 is confined inside 2.5 kpc from the Galactic center, the orbits do not support the bar structure. Most of the orbits are prograde and retrograde at the same time when the pattern speed is slower, while most of the orbits are retrograde when the pattern speed is faster, but there are no prograde orbits. Prograde-retrograde orbits have been observed in other globular clusters (Pichardo et al. 2004; Allen et al. 2006). This effect is produced by the bar, and it could be related to chaotic behavior, but this is not yet well understood. In particular, the orbit calculated with the central values of the observational parameters is retrograde for the three different pattern speeds. Table 3 gives the average of the orbital parameters for ESO456-SC38. The errors provided in each column are the standard deviation of the distribution.
| (km s-1 kpc-1) | (kpc) | (kpc) | (kpc) | |
|---|---|---|---|---|
| 40 | 0.32 0.11 | 1.73 0.07 | 0.67 0.20 | 0.70 0.10 |
| 45 | 0.18 0.10 | 1.75 0.12 | 0.82 0.21 | 0.81 0.10 |
| 50 | 0.14 0.12 | 1.84 0.16 | 0.87 0.14 | 0.87 0.10 |
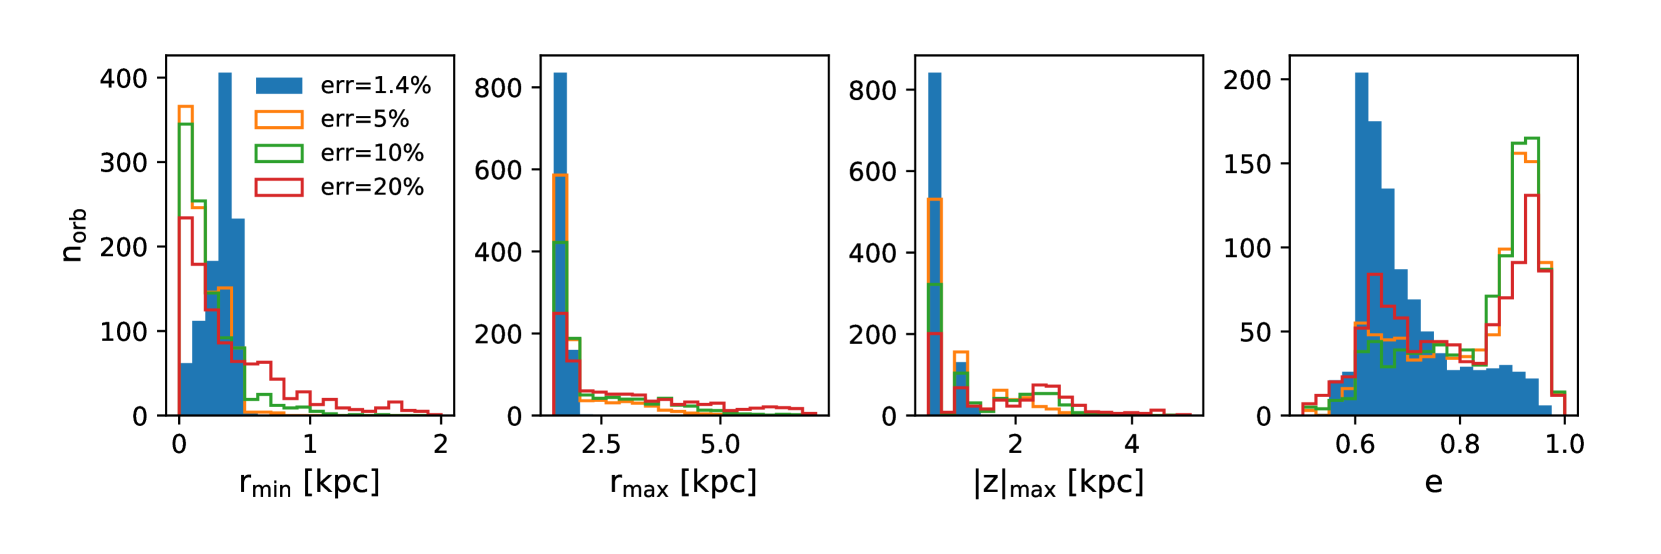
Uncertainties in orbits: The range of orbital parameters can be affected by the distance uncertainty. Because we performed a statistical isochrone fitting where we took the photometric uncertainties given by the HST into account using information of the horizontal branch and metallicity, we trust our distance determination with an uncertainty of 0.12 kpc, which is equivalent to 1.4%. To show how much the range of the orbital parameters would change, we calculated three sets of orbits, assuming 5, 10, and 20% in the distance error. As expected, the parameter range increases with the error. As shown in Fig. 9, with an error larger than 5%, the cluster could reach distances out of the bulge and bar region and vertical excursions from the plane higher than 2 kpc, which would cause more eccentric orbits. Additionally, with larger uncertainties, the cluster is freer to reach regions of the Galaxy that would not be accessible with a smaller uncertainty. In other words, it could be closer or farther to some resonance that could affect its orbit. With an uncertainty of 0.12 kpc, most of the orbits are retrograde (for the slower pattern speed of the bar) with no prograde orbits, but when the error increases, the cluster would present some prograde orbits, and their number increases with distance error. For this reason, it is crucial to have the best possible accurate distance determination for the clusters in the bulge, in order to be able to construct precise orbits around the Galaxy.
5 Summary and conclusions
We have gathered photometric data from the Hubble Space Telescope in F606W with the ACS camera, and in F110W with the WFC3 camera, together with images in V and I obtained with FORS2 at the Very Large Telescope. These data were further cross-identified with Gaia measurements of proper motions. This combination of data allowed us to derive an accurate distance of d⊙ = . The best-fitting BaSTi isochrones correspond to an age of Gyr, a reddening of E(B-V), and a metallicity of [Fe/H].
The source ESO456-SC38 is an addition to the list of moderately metal-poor ([Fe/H]) clusters on the blue horizontal branch, and is projected very close to the Galactic center. It appears to be similar to NGC 6522 (Barbuy et al. 2014, Kerber et al. 2018), HP 1 (Barbuy et al. 2016, Kerber et al. 2019), and NGC 6558 (Barbuy et al. 2018b). The Galactic bulge currently appears to be dominated by a bar, but in its early beginnings, a classical bulge was probably present, as proven by the concentration of these very old GCs. This is further shown by the presence of RR Lyrae stars that also have a peak in metallicity at [Fe/H]1.0 (Pietrukowicz et al. 2012). The scenario could be an early small classical bulge, or else a very early thick disk, with a fast chemical enrichment reaching [Fe/H] to 1.0, when most metal-poor stars and GCs formed. The subsequent evolution of the bulge is dominated by the effects of the bar. For example, Zoccali et al. (2018) measured red clump stars and suggested that the bulge currently contains two main components, a metal-poor component with a peak at [Fe/H]-0.4, and a metal-rich one with a peak at [Fe/H]+0.3. In addition to the difference in metallicity, these components also show different spatial distribution, kinematics, and abundance ratios. The metal-rich end of the metallicity distribution function in the bulge varies from one study to another (e.g., Barbuy et al. 2018a). We note for metal-poor stars that the surveys that are based on red clump stars are biased against metal-poor stars. For the detection of the old stars, surveys of RR Lyrae stars are suitable (Saha et al. 2019; Pietrukowicz et al. 2012), and spectroscopic surveys such as Extremely Metal-poor BuLge stars with AAOmega survey (EMBLA) (Howes et al. 2016) are ongoing.
Finally, by combining the accurate distance derived in this work, the Gaia proper motions, and the radial velocity from spectroscopy, we were able to compute a set of orbits for ESO456-SC38 in order to determine the most probable region where the cluster is moving in the Galaxy. The cluster has an eccentric orbit (e 0.7) that increases with the pattern speed of the Galactic bar, with a radial distance between 0.1 and 2.5 kpc from the Galactic center and a maximum vertical excursion between 0.5 and 1.5 kpc. Its orbits are increasingly confined within the bulge and bar region, but even this does not support the bar structure, similarly to the old GCs HP 1 and NGC 6558.
Acknowledgements.
SO and DN acknowledge partial support by the Universita‘ degli Studi di Padova Progetto di Ateneo CPDA141214 and BIRD178590 and by INAF under the program PRIN-INAF2014. SOS acknowledges the FAPESP PhD fellowship no. 2018/22044-3. BB and EB acknowledge grants from the Brazilian agencies CAPES - Finance code 001, CNPq and FAPESP. APV acknowledges the FAPESP postdoctoral fellowship grant no. 2017/15893-1.References
- (1) An, D., Beers, T.C., Johnson, J.A. et al. 2013, ApJ, 763, 65
- Allen et al. (2006) Allen, C., Moreno, E., & Pichardo, B. 2006, ApJ, 652, 1150
- (3) Anderson, J., Sarajedini, A., Bedin, L. R., et al. 2008, AJ, 135, 2055
- (4) Anderson, J., & Bedin, L. R. 2010, PASP, 122, 1035
- (5) Barbuy, B., Bica, E., Ortolani, S. 1998, A&A, 333, 117
- (6) Barbuy, B., Zoccali, M., Ortolani, S. et al. 2009, A&A, 507, 405
- Barbuy et al. (2014) Barbuy B, Chiappini C, Cantelli E, et al. 2014, A&A, 570, A76
- Barbuy et al. (2016) Barbuy B, Cantelli E, Vemado A, et al. 2016, A&A, 591, A53
- Barbuy et al. (2018a) Barbuy, B., Chiappini, C., Gerhard, O. 2018a, ARA&A, 56, 223
- Barbuy et al. (2018b) Barbuy, B, Muniz, L., Ortolani, S., et al. et al. 2018b, A&A, 619, A178
- Baumgardt et al. (2019) Baumgardt, H., Hilker, M., Sollima, A., & Bellini, A. 2019, MNRAS, 482, 5138
- Bellini et al. (2017) Bellini, A., Anderson, J., Bedin, L.R. et al. ApJ, 2017, 842, 6
- (13) Bica, E., Barbuy, B., Ortolani, S. 2016, PASA, 33, 28
- Bica et al. (2019) Bica, E., Pavani, D. B., Bonatto, C. J., & Lima, E. F. 2019, AJ, 157, 12
- Bland-Hawthorn & Gerhard (2016) Bland-Hawthorn, J., & Gerhard, O. 2016, ARA&A, 54, 529
- (16) Bressan, A., Marigo, P., Girardi, L. et al. 2012, MNRAS, 427, 127
- Clement et al. (2001) Clement, C. M., Muzzin, A., Dufton, Q., et al. 2001, AJ, 122, 2587
- (18) Cohen, R.E., Mauro, F., Alonso-Garcia, J. et al. 2018, AJ, 156, 41
- Côté (1999) Côté, P. 1999, AJ, 118, 406
- Dias et al. (2016) Dias, B., Barbuy, B., Saviane, I., et al. 2016, A&A, 590, A9
- (21) Djorgovski, S. 1987, ApJ, 317, L13
- Gaia Collaboration (2017) Gaia Collaboration, Clementini, G., Eyer, L., Ripepi, V., et al., 2017, A&A, 605, A79
- Gaia Collaboration et al. (2018a) Gaia Collaboration, Brown, A. G. A., Vallenari, A., Prusti, T. et al. 2018a, A&A, 616, A1
- Gaia Collaboration (2018b) Gaia Collaboration, Helmi, A., van Leeuwen, F., McMillan, P.J. et al., 2018b, A&A, 616, A12
- (25) Harris, W.E. 1996, AJ, 112, 1487
- (26) Howes, L.M., Asplund, M., Keller, S.C. et al. 2016, MNRAS, 460, 884
- Holmberg et al. (1978) Holmberg, E. B., Lauberts, A., Schuster, H.-E., & West, R. M. 1978, A&AS, 34, 285
- Iben et al. (1969) Iben, I. Jr., Rood, R.T., Strom, K.M., Strom, S.E. 1969, Nature, 224, 1006
- Kalirai et al. (2009) Kalirai, J. S., MacKenty, J., Bohlin, R., et al. 2009, WFC3 SMOV Proposal 11451: The Photometric Performance and Calibration of WFC3/IR, Tech. Rep.
- Kerber et al. (2018) Kerber, L.O., Nardiello, D., Ortolani, S., et al. 2018, ApJ, 853, 15
- Kerber et al. (2019) Kerber, L. O., Libralato, M., Souza, S. O., et al. 2019, MNRAS, 484, 5530
- (32) Luque, E., Queiroz, A., Santiago, B. et al. 2016, MNRAS, 458, 603
- (33) Meissner, F., Weiss, A. 2006, A&A, 456, 1085
- (34) Minniti, D. 1995, AJ, 110, 1686
- (35) Minniti, D., Geisler, D., Alonso-García, J. et al. 2018, ApJ, 849, L24
- (36) Miyamoto, M., & Nagai, R. 1975, PASJ, 27, 533
- Nardiello et al. (2018) Nardiello, D., Libralato, M., Piotto, G. et al. 2018, MNRAS, 481, 3382
- (38) Navarro, J. F., Frenk, C. S., & White, S. D. M. 1997, ApJ, 490, 493
- (39) Origlia, L., Rich, R.M. 2004, AJ, 127, 3422
- (40) Ortolani, S., Renzini, A., Gilmozzi, R., et al. 1995, Nature, 377, 701
- (41) Ortolani, S., Bica, E., Barbuy, B. 1997, A&AS, 126, 319
- (42) Ortolani, S., Cassisi, S., Salaris, M. 2017, in Galaxies, vol. 5, p. 28.
- Ortolani et al. (2019) Ortolani, S., Nardiello, D., Pérez-Villegas, A., Bica, E., & Barbuy, B. 2019, A&A, 622, A94
- (44) Pérez-Villegas, A., Rossi, L., Ortolani, S., et al. 2018, PASA, 35, 21
- Pichardo et al. (2004) Pichardo, B., Martos, M., & Moreno, E. 2004, ApJ, 609, 144
- Pietrinferni et al. (2004) Pietrinferni, A., Cassisi, S., Salaris, M., Castelli, F. 2004, ApJ, 612, 167
- Pietrinferni et al. (2006) Pietrinferni, A., Cassisi, S., Salaris, M., Castelli, F. 2006, ApJ, 642, 797
- Pietrukowicz et al. (2012) Pietrukowicz, P., Udalski, A., Soszynski, I., Nataf, D.M., Wyrzykowski, Ł,, et al. 2012, ApJ, 750, 169
- Piotto et al. (2015) Piotto, G., Milone, A. P., Bedin, L. R., et al. 2015, AJ, 149, 91
- Renzini & Fusi Pecci (1988) Renzini, A. & Fusi Pecci, F. 1988, ARA&A, 26, 199
- Renzini et al. (2018) Renzini, A., Gennaro, M., Zoccali, M. et al. 2018, ApJ, 863, 16
- (52) Rossi, L., Ortolani, S., Bica, E., Barbuy, B., Bonfanti, A. 2015a, MNRAS, 450, 3270
- Rossi (2015b) Rossi, L. J. 2015a, NIGO: Numerical Integrator of Galactic Orbits, Astrophysics Source Code Library
- Rossi (2015c) Rossi, L. J. 2015b, Astronomy and Computing, 12, 11
- Saha et al. (2019) Saha, A., Vivas, K., Olszewski, E.W., et al. 2019, arXiv:1902.05637
- Saviane et al. (2012) Saviane, I., da Costa, G. S., Held, E. V., et al. 2012, A&A, 540, A27
- Schönrich et al. (2010) Schönrich, R., Binney, J., & Dehnen, W. 2010, MNRAS, 403, 1829
- Schultheis et al. (2015) Schultheis, M., Cunha, K., Zasowski, G. et al. 2015, A&A, 584, A45
- Schiavon et al. (2017) Schiavon, R.P., Zamora, O., Carrera, R. et al. 2017, MNRAS, 465, 501
- Searle & Zinn (1978) Searle, L. & Zinn, R. 1978, ApJ, 225, 357
- (61) Smith, R., Flynn, C., Candlish, G. N., Fellhauer, M., & Gibson, B. K. 2015, MNRAS, 448, 2934
- Soszyński et al. (2014) Soszyński, I., Udalski, A., Szymański, M. K., et al. 2014, Acta Astron., 64, 177
- Stetson (1987) Stetson, P. B. 1987, PASP, 99, 191
- Taylor (2005) Taylor, M. B. 2005, in Astronomical Society of the Pacific Conference Series, Vol. 347, Astronomical Data Analysis Software and Systems XIV, ed. P. Shopbell, M. Britton, & R. Ebert, 29
- (65) Valenti, E., Ferraro, F.R., Origlia, L. 2010, MNRAS, 402, 1729
- Vasiliev (2019) Vasiliev, E. 2019, MNRAS, 484, 2832
- (67) Vásquez, S., Saviane, I., Held, E.V. et al. 2018, A&A, 619, A13
- (68) Zoccali, M., Valenti, E., Gonzalez, O.A. 2018, A&A, 618, A147