The origin of the asymmetry in the fragment mass distribution of low-energy nuclear fission is considered from the semiclassical point of view. Using the semiclassical periodic-orbit theory, one can define and quantify the shell effect associated with spatially localized nascent-fragment (prefragment) part of the potential. We investigate the roles of prefragments in the deformed shell effect using a simple cavity potential model, but with realistic shape degrees of freedom for describing the fission processes. The results suggest that the prefragment magic numbers play essential roles in determining the shapes at the fission saddles, which should have a close relation to the fragment mass distribution.
Semiclassical origin of asymmetric nuclear fission: Nascent-fragment shell effect in periodic-orbit theory
Revised: 20 August 2019)
pacs:
21.60.-n, 36.40.-c, 03.65.Sq, 05.45.Mt1 Introduction
In the low-energy fission process of a heavy nucleus, nucleon distribution is elongated in one direction and a neck is formed which begins to separate the system into two nascent fragments, which we shall call “prefragments” for shortness. By the Coulomb repulsion between two prefragments, the system is finally divided into two fragments. According to the experimental results[1], the fragment mass distributions are asymmetric in most of the actinide nuclei, namely, those nuclei are likely to break up into two fragments with different sizes. Since the fragment mass distribution is determined by the shape of the nucleus on the fission saddle, the system is expected to favor an asymmetric shape in the fission deformation processes. The fission process is first studied with the liquid-drop model (LDM)[2, 3]. However, the asymmetric fragment-mass distribution cannot be explained within the LDM: symmetric shapes are favored throughout the fission deformation processes (see Sec. 3 below). The above problem is known to be solved by taking account of the quantum shell effect. Both static and dynamic theoretical approaches have achieved great successes in the systematic reproduction of the experimental results[4].
The most remarkable feature of the experimental results in the fissions of actinide nuclei would be the preference of heavier fragments around regardless of the parent species. It was considered as due to the strong shell effect of the spherical fragments near the doubly-magic isotope. Further theoretical studies have revealed that the evolution of deformed shell effect in the fission process is essential in determining the fragment distribution, and the shell effect associated with spatially localized prefragments should be present. However, the standard quantum mechanical mean-field approaches cannot extract such prefragment shell effect out of that in the total system. The parity splitting of levels in the two-center shell model potential is investigated as the indication of fragment shell effect[5, 6], but it is limited to symmetric shapes. Shell effects of the independent fragments are discussed in some recent works[7, 8], but it is not trivial to clarify how they reflect the effect of the prefragment embedded in the total system. We should say that the physical mechanism of the asymmetric fission has not been sufficiently clarified. Since the asymmetry itself can be reproduced in mean-field calculations, its origin must be explained within the mean-field theory. However, it is hard to define the shell effect associated with each of the prefragments because most of the single-particle wave functions are delocalized in the mean-field potential.
It was pointed out by Strutinsky et al. that the semiclassical periodic-orbit theory (POT) [9, 10] would be able to explain the origin of such prefragment shell effect[11]. In the POT, single-particle level density is represented as the sum over the contributions of classical periodic orbits (POs). If a neck is formed upon the elongated potential, a set of POs appear which are confined in each of the prefragments, and their contributions to the level density can be regarded as the prefragment shell effect. However, such kind of analysis hasn’t been carried out in deformed potential models for the fission processes. In this work, we apply the POT to a simple deformed cavity potential model and discuss the effect of prefragment shell effect to elucidate the underlying mechanism of asymmetric fission.
2 Asymmetric fission
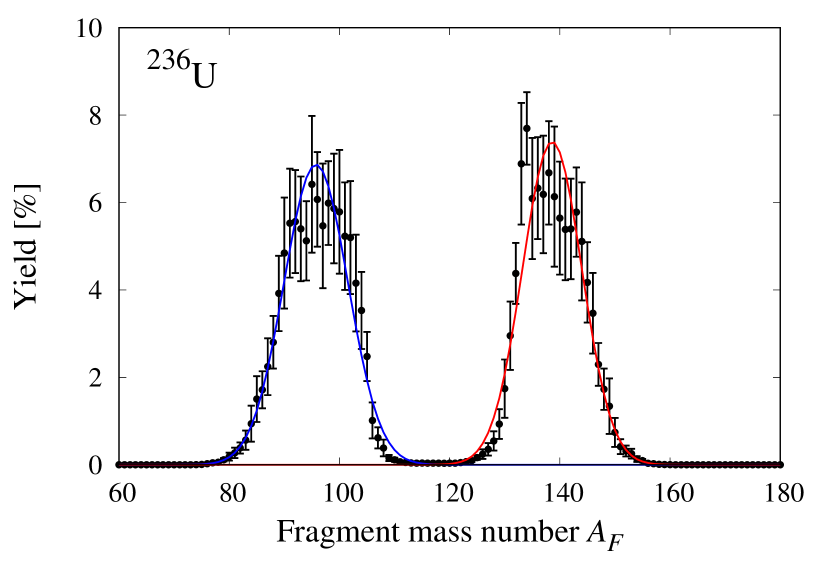
Figure 1 shows the distribution of fragment mass yields for the neutron-induced fission of 236U. It consists of two peaks with the heavier component around and the lighter component around . In the figure, each of the peaks is fitted by the Gaussian.
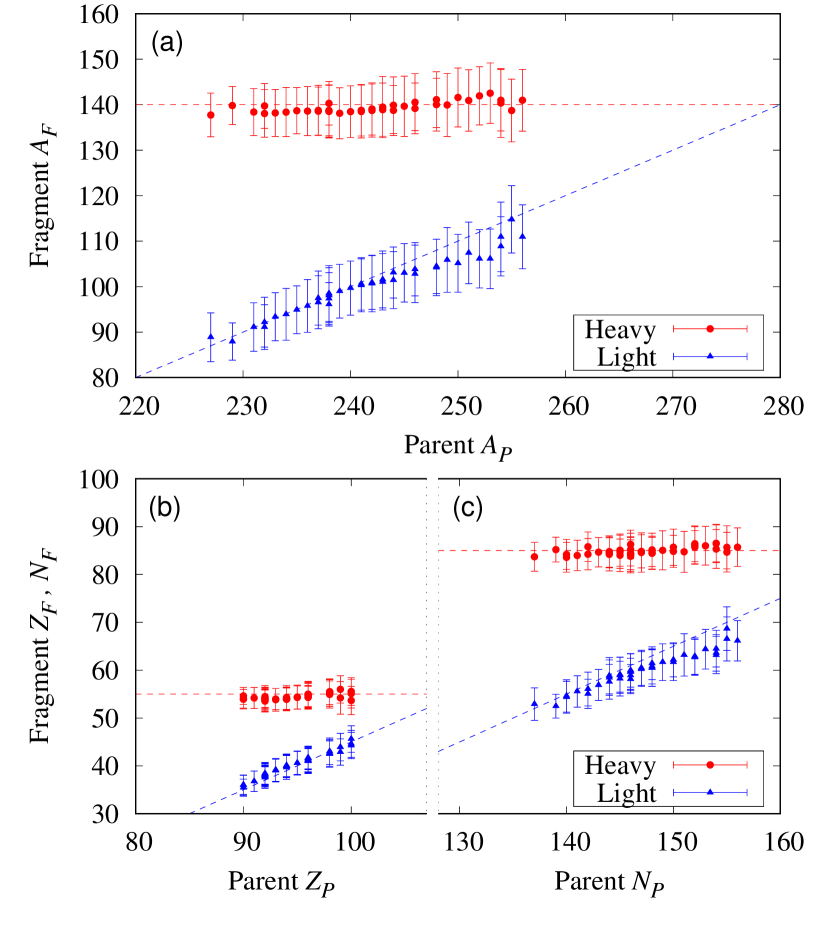
This two-peak structure in the fragment-mass distribution is common among all other actinide nuclei. The positions of the centers of those peaks and the standard deviations around them are summarized in Figure 2. The outstanding feature is that the peak of the heavier fragment is always found around ( and ) independently of the parent species. Since these numbers are close to the magic numbers and , the energy gain due to the shell effect of the fragment has been considered as the primary driving force behind the above asymmetric fissions.
For lighter nuclei, the fissions had been expected to occur in more symmetric manners because such strong shell effect that advantages the fragment mass asymmetry seems to be absent. However, substantially asymmetric fragment mass distributions were observed in the fissions of some neutron-deficient mercury isotopes. In the relatively recent experiment[13], the fission of 180Hg has turned out to be asymmetric although the symmetric fission product \fourIdx904050Zr with neutron number at magic and proton number at submagic is very stable.
The origin of the above asymmetry, what they call a new type of asymmetric fission, has been theoretically studied in several approaches: see [14, 15] for instance. These works have pointed out the significance of finding the optimum fission path on the potential energy surface which runs through the normally deformed ground state and the elongated saddle points. In the case of 180Hg, one finds a deep valley along the line of the symmetric shapes at large elongation in the potential energy surface due to the low energy of the symmetric fission products 90Zr. But it is inaccessible from the fission path consisting of a sequence of minima and saddles from the normal deformed minima because they are separated from each other by a high potential ridge (see, e.g., Fig. 7 of Ref. [14]). It tells us that the energies of the final states alone are not sufficient to understand the asymmetric fission. It is also important to consider the potential landscape in the shape parameter and find the energetically favored fission path along which the shape of the system likely to evolve towards the scission.
In Ref. [15], it is found that a prefragment whose density distribution is quite similar to that of isolated 90Zr comes up in the elongated parent nucleus 180Hg. With such a configuration, the other prefragment necessarily becomes lighter since there must be some nucleons in the neck part between the two prefragments. From this observation, they concluded that the shell effect associated with the prefragment corresponding to 90Zr plays a role to make the fission asymmetric rather than symmetric, contrary to the first expectation. More recently, nucleon localization functions[16] were investigated in the microscopic calculations for fission deformation processes[17, 18], which clearly indicate the formation of prefragments similar to relatively stable isolated nuclei. For fissions of superheavy nuclei, it is predicted that the shell structure of doubly magic 208Pb, as well as that of 132Sn, plays an important role[19, 20, 21] (see also [22, 23]).
The above numerical outcomes indicate the significance of shell effect associated with prefragments formed in the elongated nuclear body. In those works, realistic models are used which take into account various effects such as Coulomb force, pairing correlations, and realistic nucleon distributions. Those effects are all important to reproduce the individual experimental data. However, to answer the fundamental question what the essential mechanism for the asymmetric fission is, it may be useful to study a simplified model that captures the essence of the relation between the shell evolution and the shape change during the fission process. In the following part, we shall use extremely simplified mean-field potential model to focus our attention on the role of the shape evolution in the fission deformation processes. The prefragment shell effect is considered by the POT in line with Strutinsky’s view[11].
3 Three-Quadratic-Surfaces parametrization
For describing the fission deformation processes, several types of shape parametrization have been proposed. Two-center shell model potential, consisting of two oscillators centered at two different points and the neck part smoothly connecting them, have been utilized in several static and dynamical calculations[5, 6, 24]. It includes the five essential parameters to describe the shape of the potential: elongation, fragment mass asymmetry, neck radius, and quadrupole deformations of the two prefragments. Although it is important to fully consider those five shape degrees of freedom, parameter sets with reduced numbers have also been used for simpler analyses. The (--) model with three parameters controlling the elongation, neck shape and asymmetry, was employed in the review article [25] on the application of the shell correction method to the fission problem. Semiclassical analysis was made in the cavity model with the same shape parametrization[26], and the role of POs in generating fission path leading to the asymmetric shape was discussed.
Since our aim is to discuss the prefragment shell effect, the three-quadratic-surfaces (3QS) parametrization proposed by R. Nix[28] is convenient with which one can easily control the shapes of the prefragments[29]. In the 3QS, the surface of the axially symmetric potential is divided into three regions along the axis of symmetry direction, and each of them is expressed as a quadratic surface,
| (1) |
These three parts are smoothly connected at the joints and . The established surface is described by the five independent shape parameters under the center-of-mass and volume-conservation conditions. is the dimensionless elongation parameter proportional to the quadrupole moment , defined as[30]
| (2) |
where the charge density is assumed to be uniform inside the surface, and is the nuclear radius in the spherical limit. is the prefragment mass asymmetry
| (3) |
where the mass of the th prefragment () is calculated assuming a uniform-density spheroidal body. is the curvature of the middle surface
| (4) |
which takes negative values () when the neck is formed and the nuclear surface turns a dumbbell shape. is the spheroidal deformation parameters of the th prefragment,
| (5) |
In the present work, we shall fix the shapes of the prefragments to be spherical . We also fix the neck parameter to , which is close to its values for some actinide nuclei along the fission paths obtained in the realistic macroscopic-microscopic calculations[14]. Then, we consider the deformed shell structure against the elongation and fragment mass asymmetry. Shapes at several values of are displayed in Fig. 3. Consideration of the roles of the prefragment deformations is left for future studies.

Using this parametrization, let us first examine the deformation energy in the liquid-drop model (LDM). The LDM deformation energy consists of surface and Coulomb parts
| (6) |
where the coefficients and are dependent on the deformation .

Figure 4 shows the LDM deformation energies for the nucleus 236U as functions of the elongation parameter and the asymmetry parameter , with the prefragment deformations and the neck parameter fixed at and . One sees that the asymmetric configuration is disfavored through the fission deformation processes. Thus, the origin of the asymmetric fission cannot be found in the classical LDM energy.
4 Shell structures in the fission processes and the periodic-orbit theory
In this section, we first give a brief introduction to the general aspects of semiclassical periodic orbit theory. The advantage of the semiclassical theory in considering the prefragment shell effect is emphasized. Then, we apply the theory to the 3QS cavity model and investigate the shell structures in the fission deformation processes.
4.1 Semiclassical theory of shell structures
The single-particle level density for the mean-field Hamiltonian is given by
| (7) |
where is the th energy eigenvalue of from the bottom, and is the transition amplitude which can be expressed in the path integral representation. Semiclassical evaluation of the path integral using the stationary-phase method extracts contributions of classical POs, and one obtains the so-called trace formula which expresses the quantum level density in terms of the classical POs as
| (8) |
In the right-hand side, represents the average part of the level density which is generally a moderate and monotonous function of energy, and the second term represents the oscillating part. The sum is taken over all the POs in the classical counterpart of the system, where specifies the orbit. is the action integral along the orbit , is the Maslov index related to the geometric property of the orbit, and the amplitude is determined by the degeneracy, stability and period of the orbit.
In a cavity potential, the classical particle moves rectilinearly and is reflected ideally at the boundary, and one has the same set of POs independent of energy. Since the modulus of momentum is constant, action integral along the orbit is simply given by
| (9) |
where is the geometric length of the orbit. In this case, it is more useful to rewrite the trace formula (8) in terms of the wave number variable , instead of energy :
| (10) |
The contribution of each orbit gives a regularly oscillating function of , and the period of the oscillation is inversely proportional to the length of the orbit
| (11) |
Accordingly, the shorter orbits are responsible for the gross shell effect with large . Generally a complicated structure in the level density fluctuation is built up with the superposition of the contributions of various orbits having different lengths.
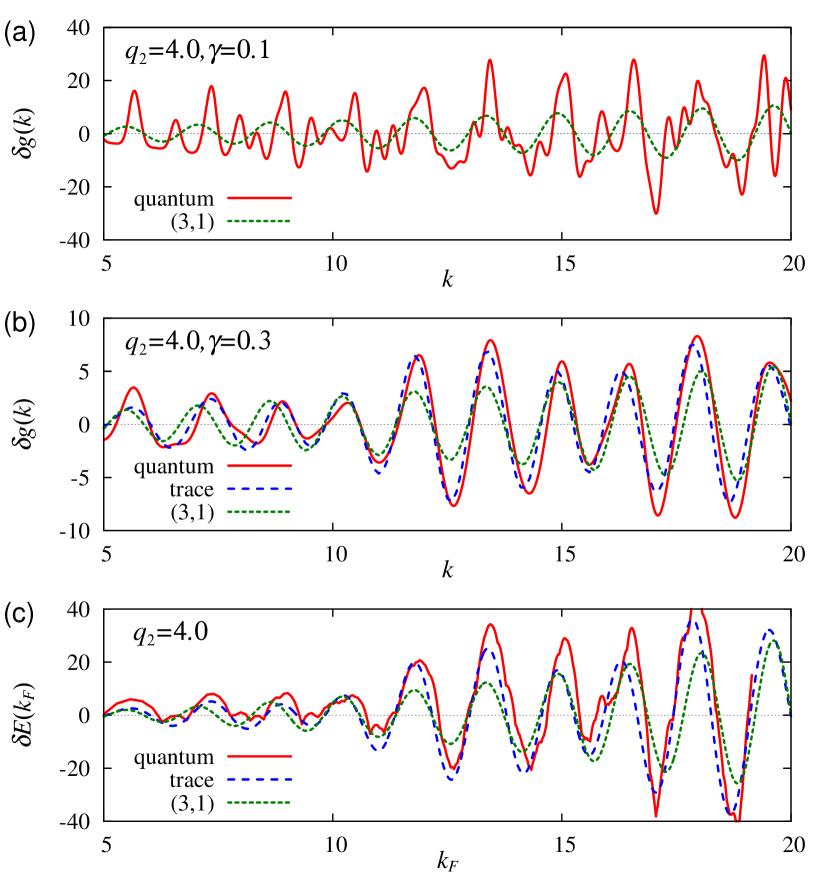
In Fig. 5, we show the oscillating part of the level density coarse-grained with the averaging width ,
| (12) |
for the symmetric 3QS shape with the elongation parameter . With the averaging width , contributions of long POs having the lengths are integrated out and only the shorter POs prevail. With , many orbits up to contribute and one sees a complicated fine structure. With , one finds a simple oscillating pattern governed by only a few shortest orbits. In the panel (b) of Fig. 5, one sees that the gross structures in quantum level densities are nicely reproduced by the semiclassical trace formula taking account of only five shortest PO families confined in the prefragments.
Shell energy is directly related to the oscillating part of the level density as[25]
| (13) |
with the Fermi energy satisfying
| (14) |
depends essentially on the gross shell structures of since the fine structures are mostly integrated out. By inserting the PO sum (8) into , one obtains the semiclassical formula for shell energy[11, 27]
| (15) |
with the Fermi wave number . In Eq. (15), the contribution of each PO has an additional factor proportional to , which plays a role to suppress the contributions of longer POs. In the panel (c) of Fig. 5, shell energy of the 3QS cavity system with the same shape as that used in the two upper panels is plotted as a function of the Fermi wave number. One sees that the oscillating pattern is nicely reproduced simply by the contributions of some shortest POs.
In general, shell structures are known to be very sensitive to the shape of the potential. In semiclassical point of view, it can be explained by the sensitivity of the stability of POs to the potential shape, as well as the changes of the orbit lengths which lead to the different kinds of interference effects.
4.2 Prefragment shell effect — relation to classical periodic orbits
As stated above, one can extract the prefragment contribution out of the total shell energy using the POT. Periodic orbits in our model can be classified into the following three groups:
-
1.
orbits confined in the 1st prefragment
-
2.
orbits confined in the 2nd prefragment
-
3.
orbits staying in the middle surface or those traveling between two prefragments
as illustrated in Fig. 6.
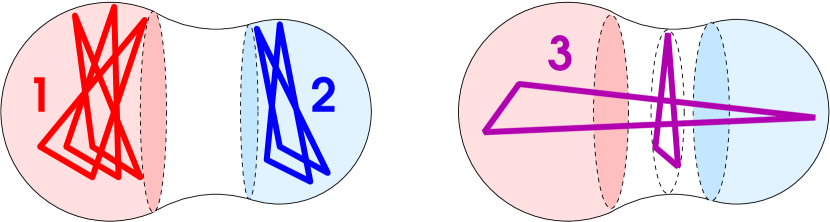
An unambiguous definition of the prefragment shell effect can be given by the contributions of orbits confined in the corresponding prefragment. According to the above classification of POs, we decompose the shell energy into three parts as
| (16) |
The orbits included in the third category generally have less contributions to the shell energy because of the small degeneracy compared to the prefragment orbits. Thus, the prefragment shell effect dominates the total shell effect with developing neck configuration. In this way, shape stabilities of the prefragments are expected to play a crucial role in the deformed shell effect in the fission process.
To estimate the prefragment shell effect, one has to calculate the classical POs and their characteristics such as periods, degeneracies and stabilities. All the classical periodic orbits in the spherical cavity potential are obtained analytically. They are specified by the two indices : counts the number of reflections on the surface, and the number of rotations around the center of the sphere. Regular polygon orbits such as triangle (3,1) and square (4,1) orbits form three-parameter families generated by the three-dimensional rotation, while the diameter orbits form two-parameter families[10]. In the 3QS cavity potential under consideration, one has the same diameter and polygon orbits confined in prefragments which are truncated spheres. By considering the restricted ranges of rotation angles for those orbit families in the prefragments, the reduction factor of the amplitude relative to that for the family in non-truncated spherical cavity can be obtained. The principal part of the contribution of the PO family is given by the amplitude
| (17) |
However, the above contribution is insufficient to reproduce the quantum results, and one needs to take into account the end-point corrections to the contribution of the truncated family. By extending the Balian-Bloch trace formula[10], we have derived the formula for the contribution of such truncated family [31, 32] in the form
| (18) |
where the sum in the first line is taken over the principal part (with degeneracy ) and several orders of the end-point corrections (with ). In the next subsection, we will compare the quantum results with our semiclassical formula.
4.3 Quantum-Classical correspondence in Fourier transformation
In the cavity model, one can easily extract information on the contributions of classical POs by Fourier transformation of quantum level density. Practically, quantum spectra is available up to a finite maximum value, and we truncate the high-energy part of the spectrum with the Gaussian and consider the following Fourier transform:
| (19) |
Inserting the trace formula (10), one obtains
| (20) |
Using this relation, one can extract information on the contributions of classical POs out of the quantum spectrum. The modulus of the Fourier transform exhibits successive peaks centered at the lengths of the classical POs , and the amplitude of a certain orbit is available from the height of the peak by
| (21) |
if there is no other peak in the vicinity. Eq. (20) is derived by ignoring the dependence of the amplitude for simplicity. The expression taking account of the correct dependence is given in [31, 32], which just replaces the gaussian with another similar function.
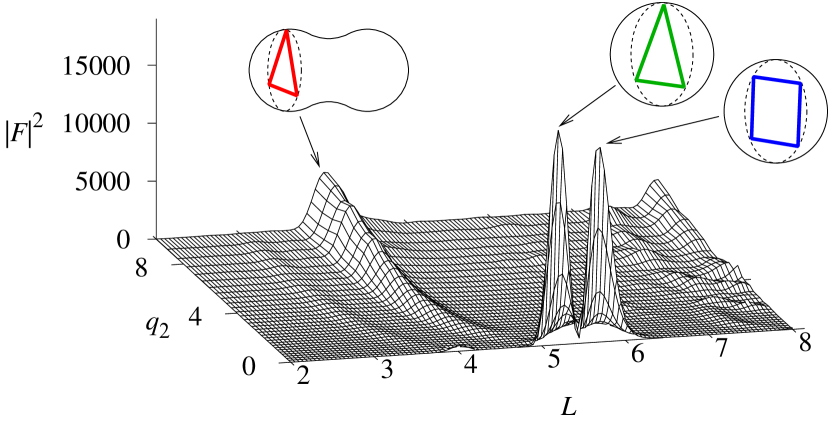
Figure 7 shows the Fourier transform of the quantum mechanical level density for the symmetric 3QS cavity. Squared modulus of the Fourier amplitude, , calculated for varying is plotted on the plane. At the spherical shape, , one sees two pronounced peaks corresponding to the triangle and square PO families having the lengths and , respectively, in units of . The peak corresponding to the diameter orbit at is much smaller because of the small degeneracy. With increasing , the above two peaks rapidly decrease, and instead, a peak corresponding to the prefragment triangle orbit grows up and makes a significant contribution at large .
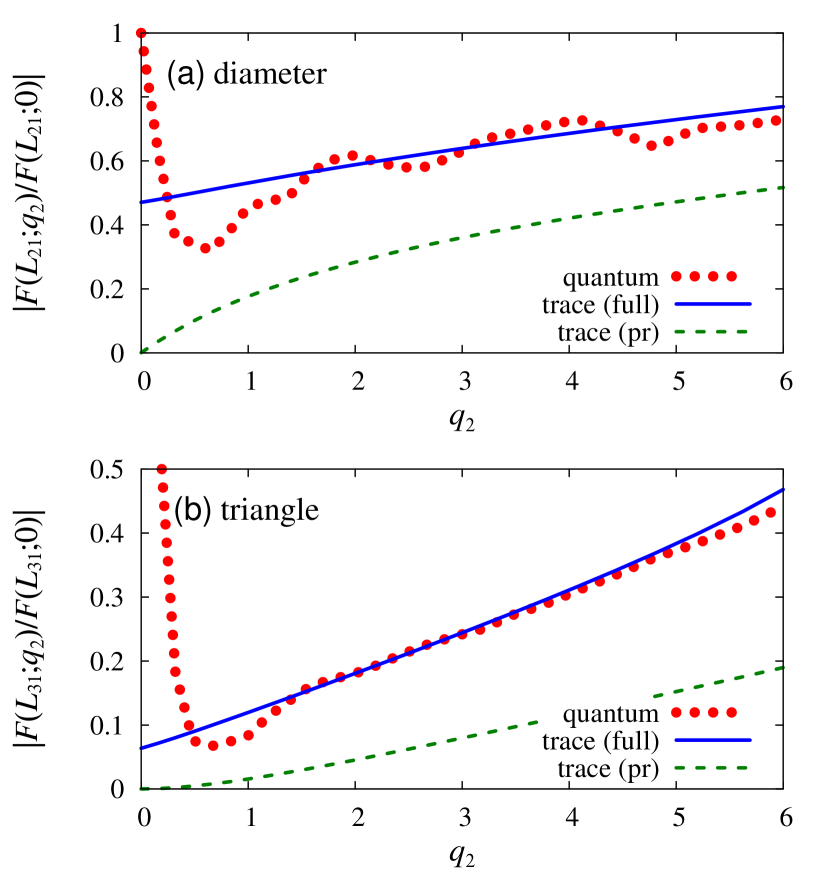
In Fig. 8, the Fourier peak of the quantum level density at the lengths of the prefragment diameter (2,1) and triangle (3,1) orbits are compared with the semiclassical amplitudes derived in [31], according to Eq. (21). As we discussed in Sec. 4.2, one has the same families of the diameter and regular polygon orbits in the prefragments as those in the non-truncated spherical cavity, but with the restricted ranges of the parameters. The dotted curves in Fig. 8 represent the moduli of the Fourier transform (19) at the length of the diameter and triangle POs, divided by their values at the spherical shape . The corresponding semiclassical results shown by the solid lines are the amplitudes in Eq. (18), including principal parts and all the end-point corrections, divided by those for non-truncated spherical cavity. The dashed curves show the principal parts, namely, the reduction factor of the truncated family , which considerably underestimate the quantum results. By taking into account the end-point corrections, quantum results are nicely reproduced both for the diameter and triangle POs.
4.4 Semiclassical analysis of the prefragment shell effect
In the following part, we investigate the prefragment shell effect in the 3QS cavity model using the trace formula (15) for shell energy.
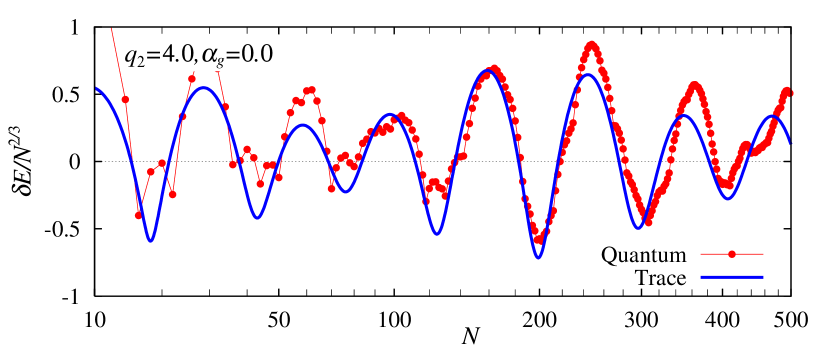
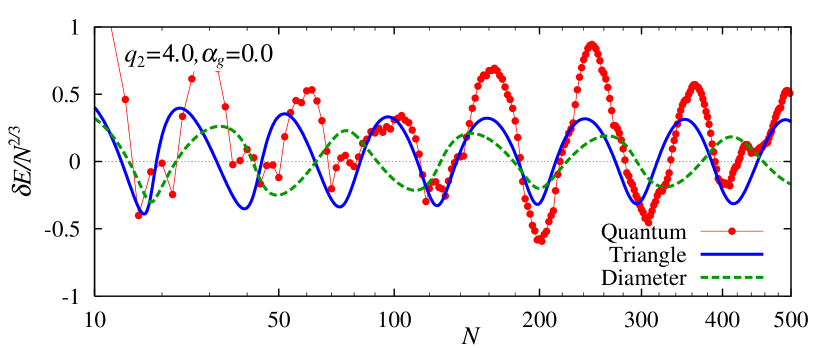
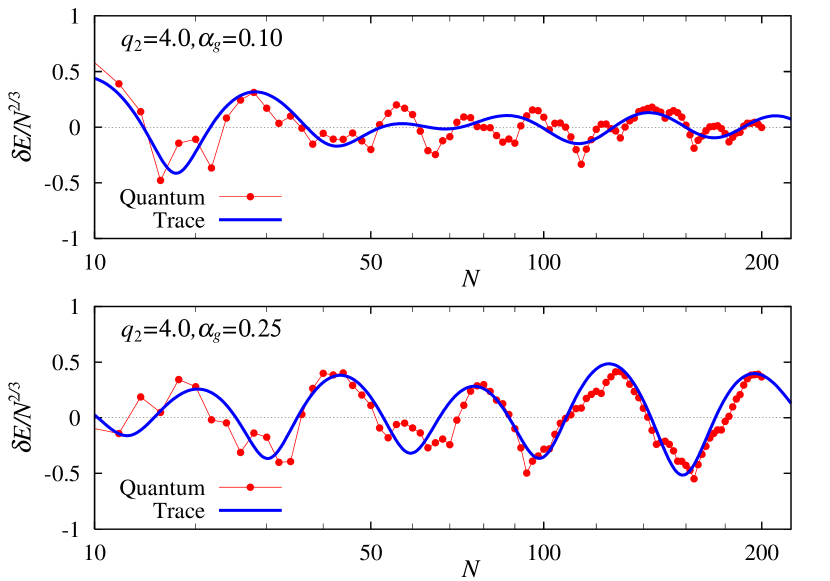
Figure 10 shows the shell energy for the symmetric 3QS cavity model, where POs confined in one of the prefragments and those in the other are equivalent, and they make constructive contributions. Quantum results are nicely reproduced by the semiclassical trace formula taking into account the five shortest prefragment POs. One finds a modulation in the gross shell structure. This modulation is caused by the interference between POs with different lengths. In Fig. 10, contributions of the diameter and triangle orbits are shown. The diameter orbit has small amplitude in the Fourier analysis (see Fig. 7) but it has significant contribution to the shell energy due to the shortness [see Eq. (15)]. Especially deep minima around for are caused by the constructive contributions of those two orbits. For particle numbers where those contributions are destructive, shell effect becomes relatively weak.
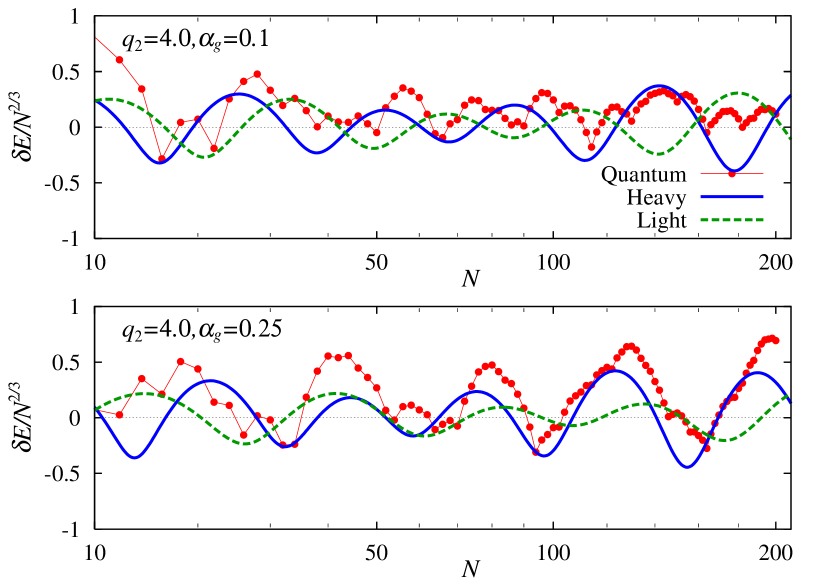
Quantum shell energy is nicely reproduced by the trace formula in Fig. 12, except for some fine structures. In Fig. 12, contributions of heavy and light prefragments are shown. Due to the asymmetry, the orbits of the same type but in the different prefragments have different lengths, and one finds an interference between them. For , contributions of two prefragments are out of phase in the plotted particle number region and the shell effects are relatively weak. For , those contributions turn more constructive and one finds larger shell effects.
4.5 Effect of prefragment magics on asymmetric fission
Since each spherical prefragment has the same set of PO families as in the non-truncated spherical cavity, one can expect the possibility of expressing the shell energy of the 3QS cavity in terms of the spherical one. Let us define the factor by
| (22) |
It represents the value of the amplitude for the orbit (including the principal part and all the end-point corrections) in the th prefragment relative to that in the non-truncated spherical cavity with the same radius . The values of are found to be similar among all the important POs, and let us just replace them with for the most important triangle orbit. Then, the contributions of POs in the th prefragment can be approximately given by
| (23) |
where the prefragment particle number is related to the total particle number by
| (24) |
Thus, the shell energy of the 3QS cavity can be approximated by the sum of shell energies in the spherical cavity as
| (25) |
Since the spherical cavity model has magic numbers , (see e.g., Fig. 2.4 of [33]) the system will achieve shell energy gain when the prefragment particle numbers coincide with those magic numbers.
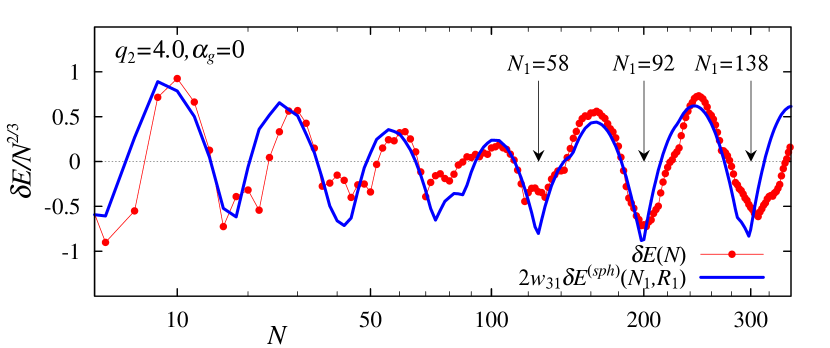
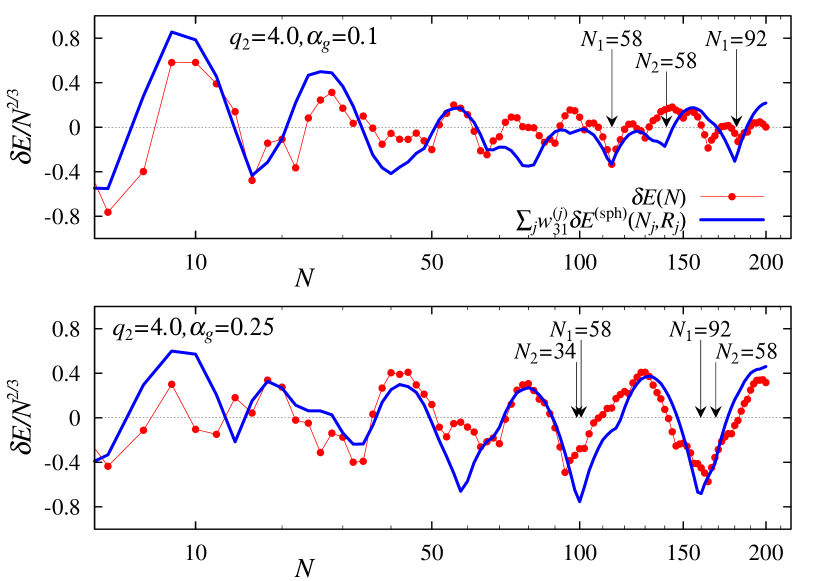
Figures 14 and 14 compare the exact shell energies with the sum of spherical ones given on the right-hand side of Eq. (25). For symmetric shapes shown in Fig. 14, one sees nice agreement between the two results, and the shell energy minima are corresponding to the prefragment magic numbers. For asymmetric shapes, the agreement between the two results is not as good as the symmetric case, but one clearly sees the effect of prefragment magic numbers. For , magic numbers of two prefragments make constructive contributions to give the deep shell energy minima, e.g., around and .
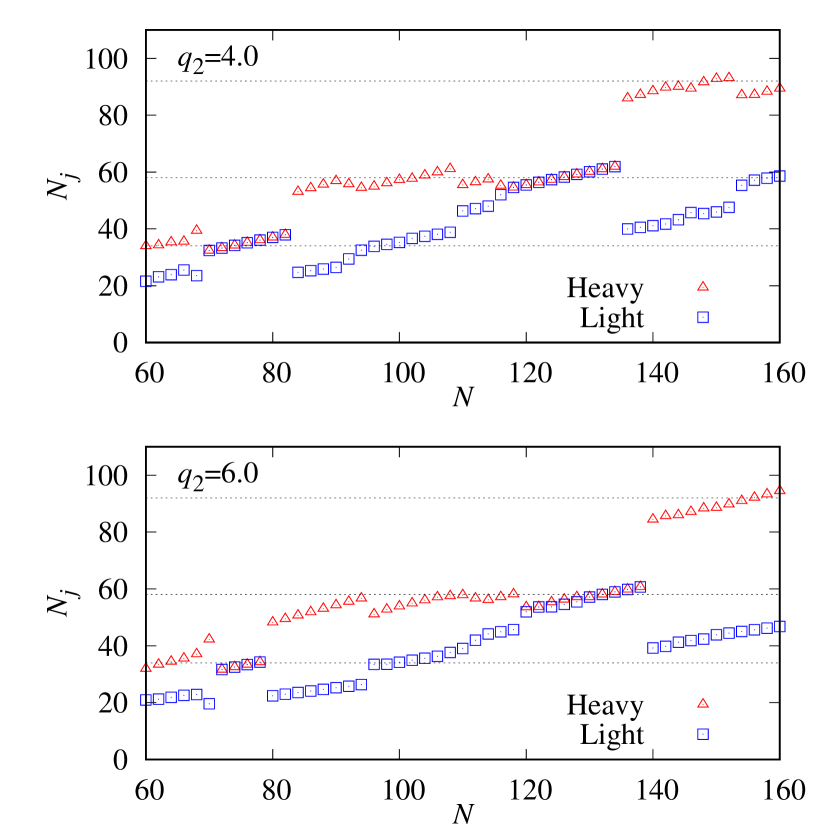
Let us consider the effect of these prefragment magic numbers to the asymmetric fission. We calculated the shell energy as a function of and , and find the value of which minimizes the shell energy for each fixed value of . At those values of the asymmetry parameter, prefragment particle numbers are calculated and plotted in Fig. 15. The horizontal dotted lines indicate the spherical magic numbers. It is found that the heavier prefragment particle number sticks to one of the magic number and jumps to the next magic number in a stepwise manner with increasing total particle number . The result for is almost the same as that for , and these prefragment particle numbers successfully explain the behavior of the experimental data for the fragment mass distributions shown in Fig. 2.
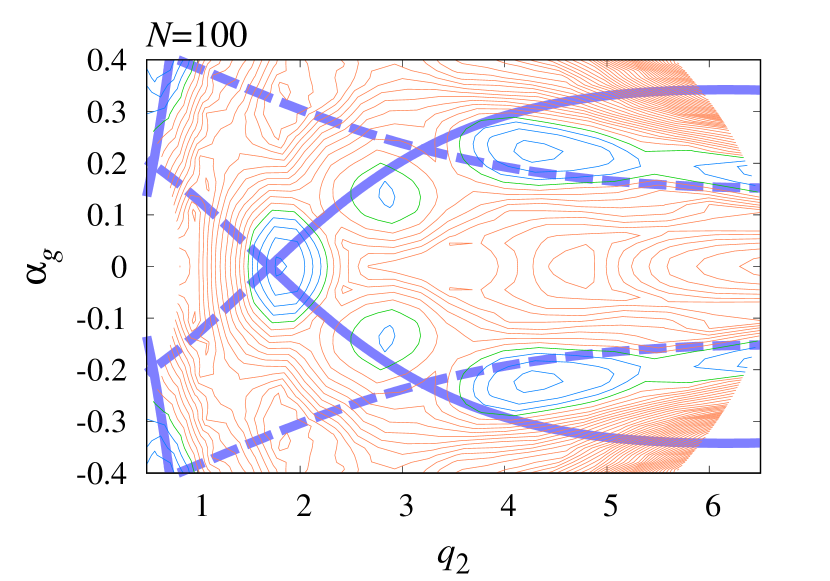
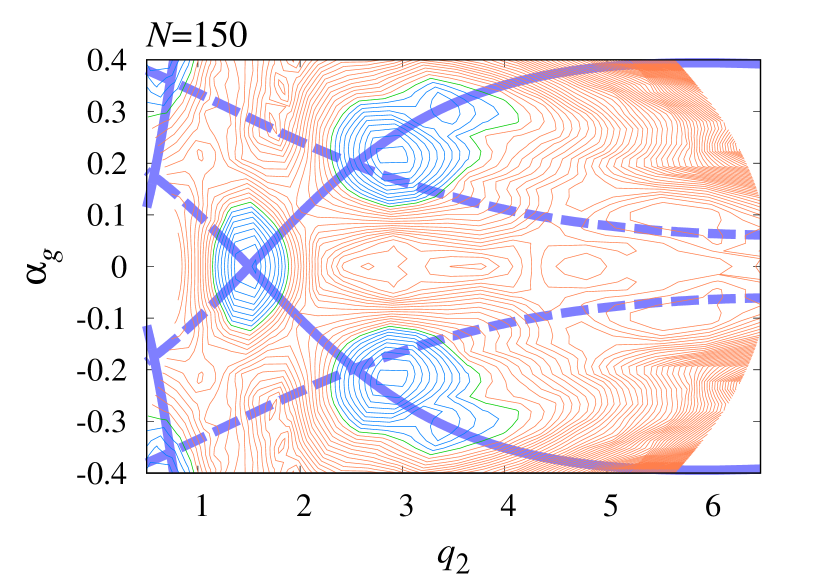
Figure 16 shows the contour plots of the shell energy for several particle numbers in the deformation space . One sees valleys running through the strongly elongated asymmetric shapes. This curve approximately corresponds to the constant-action curve of the triangle orbits
| (26) |
where contribution of triangle orbit to the shell energy (15) takes minima. It approximately gives the condition for the prefragment particle number to coincide with the spherical magic number.
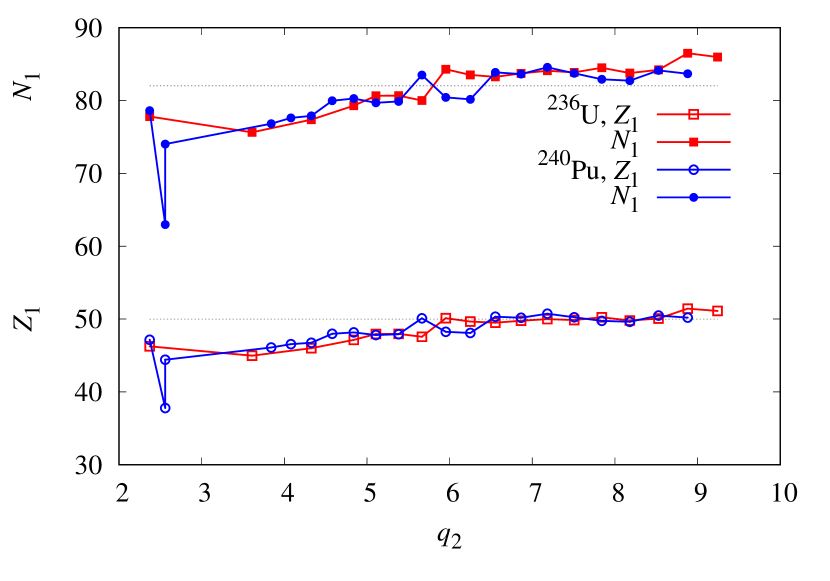
To see the role of the prefragment shell effect in more realistic situations, we examined the results of the realistic macroscopic-microscopic calculations carried out by one of the authors (T. I.) and his collaborators[14]. The potential energy surface was calculated as a function of five shape parameters in the 3QS parametrization, and then the fission path was determined by the immersion method. Looking at the shapes at the minima and saddles along the fission paths for 236U and 240Pu, we noticed that the heavier prefragment remains spherical and its radius is approximately constant. In Fig. 17, the prefragment proton and neutron numbers evaluated by
| (27) |
are plotted against the elongation parameter . One sees that both proton and neutron numbers stick to the magic numbers and . This strongly suggests the significance of prefragment shell effect to determine the shapes of the nucleus along the fission path in realistic situations.
In the realistic calculation for 180Hg, both of the prefragments are deformed in the fission process. We expect that our semiclassical prescription will also be useful in investigating the role of the prefragment shell effect on the asymmetric fissions in this region.
5 Summary
In this work, we investigated the shell structures in fission processes with the 3QS cavity model. Using the POT, prefragment shell effect is evaluated as the contributions of POs confined in each of the prefragments. As the nuclear body is elongated, neck configuration develops and the prefragment triangle orbit family makes a dominant contribution to the shell effect. The energy valleys are formed along the constant-action curves where the contribution of the triangle orbit takes minima. Since the spherical magic numbers are approximately given by the action condition of the triangle orbit family, one has significant prefragment shell effect along the above constant-action curves, and they are playing significant roles in determining the fission path on the potential energy surface.
In the present study, the prefragments are fixed at spherical shapes for simplicity. This successfully reproduces the experimental features of the fissions in actinide nuclei where the spherical shell effect of the heavier prefragments are significant. However, the lighter prefragments are usually deformed and the prefragment deformation should be taken into account for more extensive description of the fission processes. This should be critical in analyzing the asymmetric fission of other mass regions, where both of the prefragments are expected to be deformed. In recent realistic mean-field calculations, the importance of the octupole shape degree of freedom for the prefragments was suggested[7, 8]. It would be an interesting future subject to consider which kinds of shape degrees of freedom to be taken into account to describe the optimum fission path. When the octupole degree of freedom is taken into account, the effect of local symmetry restorations associated with the PO bifurcations might play some important roles[34].
References
- [1] Andreyev A N, Nishio K and Schmidt K-H 2018 Rep. Prog. Phys. 81 016301
- [2] Bohr N and Wheeler J A 1939 Phys. Rev. 56 426
- [3] Hill D L and Wheeler J A 1953 Phys. Rev. 89 1102
- [4] Schmidt K-H and Jurado B 2018 Rep. Prog. Phys. 81 106301
- [5] Mosel U and Schmitt H W 1971 Nucl. Phys. A 165 73
- [6] Mosel U and Schmitt H W 1971 Phys. Rev. C 4 2185
- [7] Scamps G and Simenel C 2018 Nature 564 382
- [8] Scamps G and Simenel C 2019 Phys. Rev. C 100 041602
- [9] Gutzwiller M C 1971 J. Math. Phys. 12 343
- [10] Balian R and Bloch C 1972 Ann. Phys. 69 76
- [11] Strutinsky V M and Magner A G 1976 Sov. J. Part. Nucl. 7 138
- [12] Data available, e.g., at the US NNDC (National Nuclear Data Center) web site https://www.nndc.bnl.gov/.
- [13] Andreyev A N et al.2010 Phys. Rev. Lett. 105 252502
- [14] Ichikawa T, Iwamoto A, Möller P and Sierk A J 2012 Phys. Rev. C 86 024610
- [15] Warda M, Staszczak A and Nazarewicz W 2012 Phys. Rev. C 86 024601
- [16] Reinhard P-G, Maruhn J A, Umar A S and Oberacker V E 2011 Phys. Rev. C 83 034312
- [17] Zhang C, Schuetrumpf B and Nazarewicz W 2016 Phys. Rev. C 94 064323
- [18] Sadhukhan J, Zhang C, Nazarewicz W and Schunck N, 2017 Phys. Rev. C 96 061301(R)
- [19] Ichikawa T, Iwamoto A, Möller P and Sierk A J 2005 Phys. Rev. C 71 044608
- [20] Warda M, Zdeb A and Robledo L M, 2018 Phys. Rev. C 98 041602(R)
- [21] Matheson Z, Giuliani S A, Nazarewicz S, Sadhukhan J and Schunck N 2019 Phys. Rev. C 99 041304(R)
- [22] Kaur G, Sandhu K and Sharma M K 2016 Phys. Rev. C 94 014615
- [23] Kaur G and Sharma M K 2019 Nucl. Phys. A 990 79
- [24] Aritomo Y, Chiba S and Ivanyuk F 2014 Phys. Rev. C 90 054609
- [25] Brack M, Damgaard J, Jensen A S, Pauli H C, Strutinsky V M and Wong C Y 1972 Rev. Mod. Phys. 44 320
- [26] Brack M, Reimann S M and Sieber M 1997 Phys. Rev. Lett. 79 1817
- [27] Brack M and Bahduri R K 2003 “Semiclassical Physics” (Boulder: Westview Press)
- [28] Nix J R 1969 Nucl. Phys. A 130 241
- [29] Möller P, Sierk A J, Ichikawa T, Iwamoto A, Bengtsson R Uhrenholt H and Åberg S 2009 Phys. Rev. C 79 064304
- [30] Cohen S and Swiatecki W J 1963 Ann. Phys. 22 406
- [31] Arita K 2018 Phys. Rev. C 98 064310
- [32] Arita K, Ichikawa T and Matsuyanagi K 2018 Phys. Rev. C 98 064311
- [33] Ring P and Schuck P 1980 “The Nuclear Many-Body Problem” (Heidelberg: Springer)
- [34] Sugita A, Arita K and Matsuyanagi K 1998 Prog. Theor. Phys. 100 597