The supersoft X-ray transient ASASSN-16oh as a thermonuclear runaway without mass ejection
Abstract
The supersoft X-ray and optical transient ASASSN-16oh has been interpreted by Maccarone et al. (2019) as having being induced by an accretion event on a massive white dwarf, resembling a dwarf nova super-outburst. These authors argued that the supersoft X-ray spectrum had a different origin than in an atmosphere heated by shell nuclear burning, because no mass was ejected. We find instead that the event’s timescale and other characteristics are typical of non-mass ejecting thermonuclear runaways, as already predicted by Shara et al. (1977) and the extensive grid of nova models by Yaron et al. (2005). We suggest that the low X-ray and bolometric luminosity in comparison to the predictions of the models of nuclear burning are due to an optically thick accretion disk, hiding most of the white dwarf surface. If this is the case, we calculated that the optical transient can be explained as a non-ejective thermonuclear event on a WD of 1.1M⊙ accreting at the rate of M⊙yr-1. We make predictions that should prove whether the nature of the transient event was due to thermonuclear burning or to accretion; observational proof should be obtained in the next few years, because a new outburst should occur within 10-15 years of the event.
1 Introduction
ASASSN-16oh was discovered on December 2 2016 by the All-Sky Automated Survey for Supernovae, as a V=16.9 transient in the field of the Small Magellanic Cloud (SMC) (Shappee et al., 2014). It was then observed with the Neil Gehrels Swift Observatory, whose X-ray telescope showed that on 2016 December 15 a supersoft X-ray source (hereafter, SSS) was the X-ray counterpart of the optical transient, with a blackbody temperature of about 900,000K and a luminosity of about 1037 erg s-1 (assuming the source is located in the SMC, Maccarone et al. (2019)). The optical spectra showed narrow optical emission lines (unresolved with a resolution of about 300 km s-1) at a velocity consistent with the systemic one of the SMC (Maccarone et al., 2019).
OGLE data showed that the optical magnitude decreased from I21 to a peak at I=16.5 within an interval of 296 days (although the rise could not be monitored for a period of over 4 months at the beginning, so there is some uncertainty), and a decay to I19.5 followed in an interval of between 259 and 268 days after maximum brightness (see Maccarone et al., 2019). There was a successive brightening to magnitude I19 and a decay to I21 with another oscillation (Maccarone et al., 2019), but it is not clear whether the oscillations in luminosity in the last part of the light curve are manifestations of the return to minimum or part of a pattern observed by OGLE in the 6 years before the outburst, when the magnitude oscillated between I21 and I19.5 at least four times.
Maccarone et al. (2019) have argued that this event cannot be due to thermonuclear burning, which is the cause of the vast majority of SSS in the Galaxy and in the Magellanic Clouds, because no mass was ejected, and the rise to maximum was much longer and the amplitude lower than in novae. Thus, they proposed a qualitative model of a peculiar disk instability. These authors suggested that a superoutburst in a cataclysmic variable with a massive WD (1.2 M⊙) accreting at about 3 M⊙ year-1 produces the observed supersoft X-ray flux because a “spreading layer” is suddenly accreted onto the WD surface, dissipating the rotational energy of the material incoming from the accretion disk (Kippenhahn & Thomas, 1978; Piro & Bildsten, 2004). Their underlying idea is that the disk instability in this transient occurred before the conditions for triggering nuclear burning have had a chance to develop, thus there was no ignition to lead to an ejected shell.
The theoretical models, however, have never predicted that a thermonuclear runaway on a WD always leads to mass ejection. Quite the contrary, since Shara et al. (1977) and Fujimoto (1982), non-ejecting thermonuclear runaway events have been predicted. Quantitative predictions of such events were published in detail by Yaron et al. (2005). As the mass transfer rate onto the WD increases, there is no abrupt transition to the regime in which all the generated energy is radiated (that of steady supersoft X-ray sources). There is nearly an order of magnitude range of values wherein the outburst causes only a slow increase in luminosity, followed by a slow decay. At a very high WD mass of 1.3 M⊙, the rise and decay can be short, just tens of days. In contrast, on a 0.6 M⊙ WD the time scales are tens of thousands of days (see Yaron et al., 2005).
The only observational fact that casts serious doubt on the thermonuclear outburst hypothesis in ASASSN-16oh is the low bolometric luminosity, between 1035 erg s-1 and 1036 erg s-1. Maccarone et al. (2019) find a luminosity of the order of 1036 erg s-1 with a blackbody fit, and about the same value by fitting an atmospheric model. We note that the Chandra LETG spectrum has poor S/N and the absorption features cannot be measured for proper model-fitting, so the atmospheric models cannot be “pegged” using the absorption features.
Thermonuclear runaways, regardless of the mass ejection, cause the WD to radiate at Eddington luminosity, around 1038 erg s-1. However, many novae have been found to be SSS with much lower luminosity than the theoretical prediction, often only 1/100th of Eddington luminosity. This is not thought to occur, in most cases, because the WD is obscured by non-isotropically expanding ejecta, although this may be the case of some novae (Beardmore et al., 2010, 2012; Tofflemire et al., 2013). Instead, a non-disrupted, or quickly reformed, accretion disk seems to block all or part of the flux from the central source for systems at high inclination (Ness et al., 2013). In some cases, as in U Sco, the SSS is still observed even if the WD is completely blocked, because of Thomson scattering (Ness et al., 2012, 2013; Orio et al., 2013). Maccarone et al. (2019) discussed the emission lines optical spectrum, and found that the lines are very narrow because the accretion disk must be fully ionized, so they are produced only in the outermost portion of the disk.
2 The Chandra observation
ASASSN-16oh was observed by PI Maccarone with Chandra and the HRC-S camera and LETG grating for 50 kiloseconds on 2017 March 29. The data were reported in Maccarone et al. (2019). We downloaded and analyzed them in order to fit the spectrum with a WD atmospheric model instead of a blackbody (shown by Maccarone et al., 2019), and to perform a timing analysis. We extracted the Chandra HRC-S+LETG with their first order grating redistribution matrix files and ancillary response files with the CIAO 4.9 task chandra repro, with the 4.7 version of the calibration package CALDB. Our best fit is obtained with a “halo” (metal poor) model calculated with TMAP (from the web site http://astro.uni-tuebingen.de/#rauch/TMAP/TMAP.html), the physics is described in detail in Werner et al. (2003); Rauch et al. (2010). We coadded the positive and negative order spectra with combine grating spectra to increase the signal-to-noise ratio.
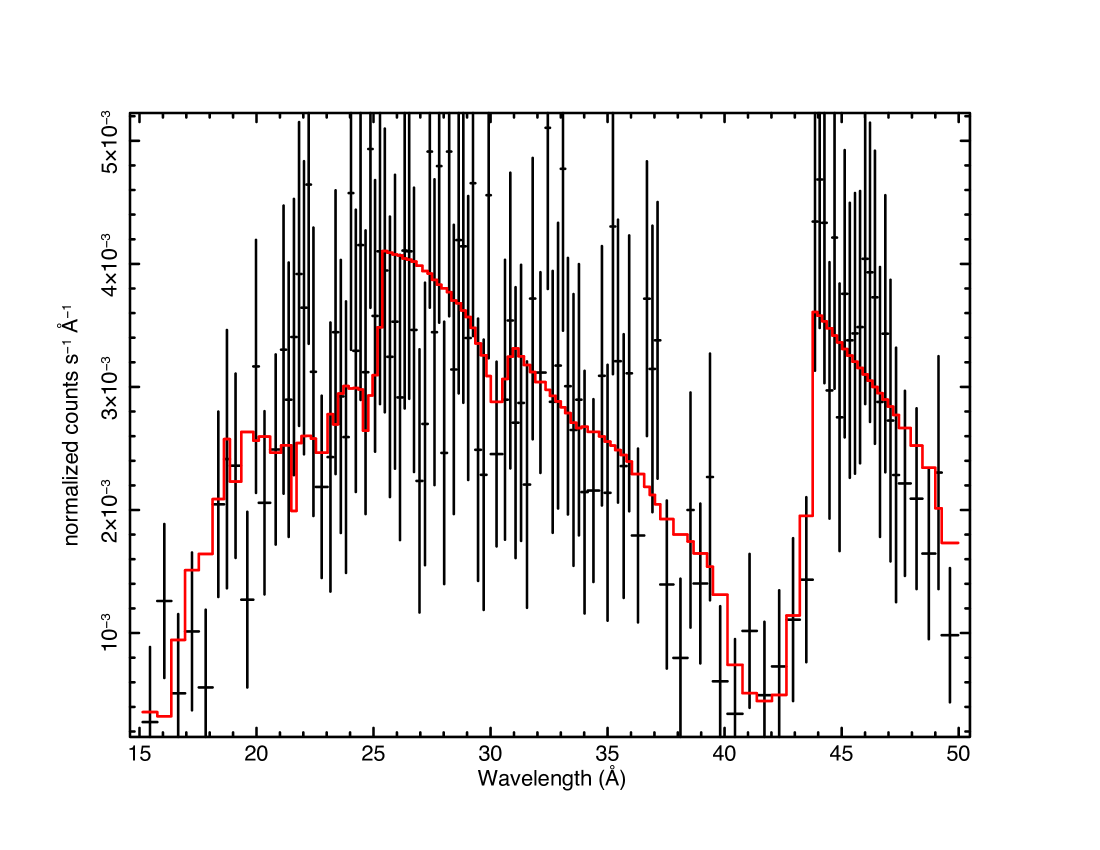
As noted by Maccarone et al. (2019), an atmospheric model with less-than-solar abundances, appropriate for the Galactic halo, fits the data better than a model with enhanced abundances, and is more appropriate for SSS in the SMC (e.g. Orio et al., 2018). As an alternative to the blackbody model plotted by the above authors in the first figure of their article, we present this atmospheric model in Fig.1. Given the data quality, this fit is statistically as acceptable as the blackbody. Because the signal-to-noise is poor, like Maccarone et al. (2019) we used C statistics (Cash, 1979) obtaining C-statistic parameter 1716 for 1710 degrees of freedom in the range 10-70 Å. The best fit shown in Fig.1 is obtained with a temperature Teff of 750,000K, a column density of N(H)=2.3 cm-2, an unabsorbed flux in the 0.1-1 keV X-ray band of 5.3 erg cm-2 s-1 and a bolometric luminosity at the SMC distance of 4.3 erg s-1. Because the best-fit column density appears low for the SMC, by constraining the value of N(H) to N(H)=4 cm-2 we obtain with Teff=736,000K the same unabsorbed flux and a bolometric luminosity at the SMC distance of 6.4 erg s-1. This fit with higher N(H) is still statistically acceptable, and given the data quality it cannot be ruled out.
3 A non-ejecting nova model
The rise to maximum in the case of a thermonuclear runaway that does not eject mass is very long compared to a runaway that produces a classical nova event without mass ejection. The duration of a thermonuclear event is dictated by the expansion velocity — the faster the envelope expands, the faster the maximum luminosity is attained. The velocity varies inversely with the accretion rate, i.e., a slow accretion rate yields a fast velocity, while faster rates yield slower velocities (Yaron et al., 2005, Table 3). At extremely high accretion rates, the velocity of the mass in the outer shells of the WD’s envelope becomes so slow that it does not exceed the WD escape velocity, resulting in a slow expansion and contraction, entirely without mass ejection.
Our models are produced by using a hydrodynamic Lagrangian nova evolution code, that simulates the evolution of multiple consecutive cycles of a WD accreting mass, the triggering of a TNR, and the onset of the outburst. Further details regarding the code may be found in Prialnik & Kovetz (1995); Epelstain et al. (2007); Hillman et al. (2015).
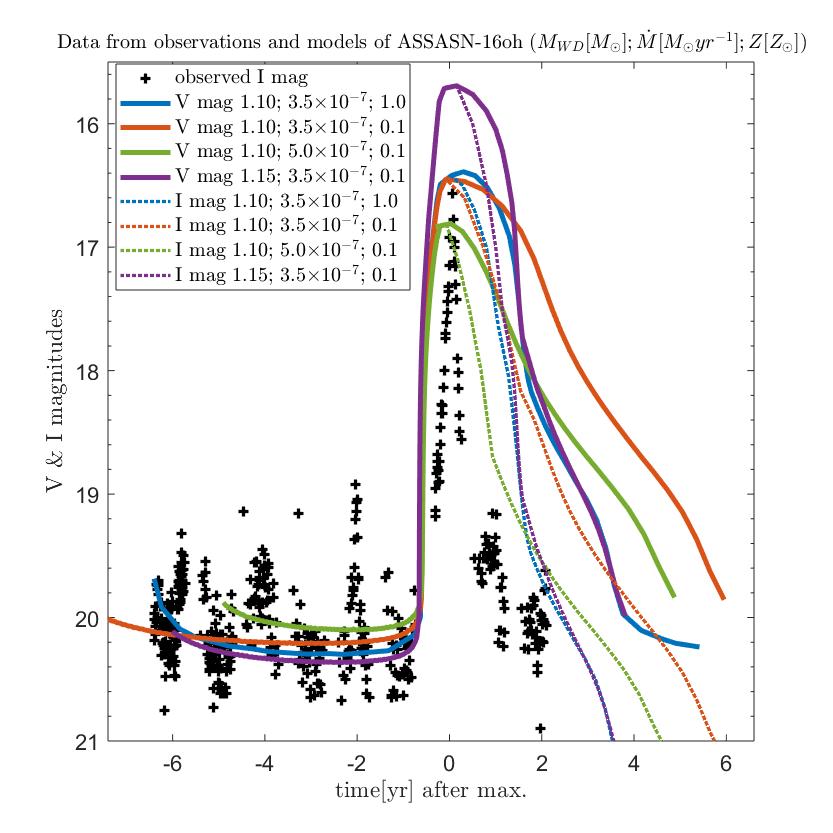
Turning to the extensive grid of models by Yaron et al. (2005), we find that the models that best fit the data are those of a 1.1M⊙ WD accreting at M⊙ yr-1. The recurrence time of the thermonuclear outburst is years, and each V band outburst lasts almost 4 years. A comparison with the observed light curve is shown in Fig.2. The maximum effective temperature (Teff) the model reaches is K, which is consistent with the value we obtain by fitting the Chandra data.
The accreted matter of this model, as for the entire grid of models by Yaron et al. (2005), is of solar metalicity. The metalicity in the SMC is about one tenth of the solar metalicity. We therefore carried out three additional simulations, each one varying from the above model by either mass, accretion rate or metalicity, in order to understand how sensitive the results are to changes in these parameters. The light curves for these models, in the V and I bands, are presented in Fig.2. We find that lowering the metalicity, while not changing the mass and accretion rate lengthens the outburst duration by . In addition, we find that decreasing the accretion rate, while not changing the WD mass or metalicity, increases the outburst amplitude and duration, as we see for the solar metalicity grid of models. Decreasing only the WD mass at constant accretion rate and metalicity decreases the outburst amplitude and increases its duration, also in agreement with the behavior of the grid of solar metalicity models. We conclude, that changing the metalicity of the accreted matter will produce similar behavioral trends to what we see in the grid, with somewhat of a shift in the initial input parameters (i.e. and ), the general regime of the results remaining as discussed here and demonstrated in Fig.2.
Our code produces the V band light curve, while the OGLE data is in the I band. We show these V band light curves as a prediction of the light curve behavior in this band, which can be tested during the next eruption, provided it will be observed in the V band. The V band light curves in Fig.2 exhibit a longer outburst duration than that of the observed I band. This discrepancy between the V and I bands is due to the effective temperature in TNR events rising quickly, shifting the light curve towards faster frequencies, i.e., away from the IR. Therefore, the I band will decline earlier than the V band. The dashed curves in Fig.2 show an estimate of the I band of our models We produced this estimate based on the computed median of the V-I mag of over 30 classical novae light curves from Shara et al. (2016, fig.8a) showing a gradual decline from V-I0 to V-I1 over 40 days, and on the longer term V-I behaviors of IM Nor and CI Aql (Schaefer, 2010, table 25) showing a decline to V-I1.3 a few years after maximum. Fig.2 demonstrates how the estimated I band decline, for all four models, begins earlier than that of the V band, bearing a good resemblance with the dimming time scale of the OGLE data.
A special characteristic of the OGLE light curve obtained with over 8 years of monitoring, of which 6 are before the beginning of the outburst, are the small scale flares (1 mag oscillations) observed 6 times, approximately once a year. The duration of these flares would be unusually long for small amplitude dwarf nova outbursts, on the other hand phenomena of irregular variability with a 1 mag amplitude, possibly different from the dwarf nova phenomenon, are not unusual in classical and recurrent novae and a few examples of pre- and post-outburst fluctuations can be found in Collazzi et al. (2009).
4 Timing analysis of the Chandra light curve
We examined the Chandra zero-order light curves measured with the HRC-S camera in the exposure described in Section 2, Maccarone et al. (2019), because thermonuclear burning SSS seem to be associated either with phenomena of short pulsations lasting around a minute or less (see Ness et al., 2015, and references therein), or with longer periodicities of the order of half an hour. For the latter, examples are V1494 Aql (Drake et al., 2003), V4743 Sgr (Leibowitz et al., 2006; Zemko et al., 2016; Dobrotka & Ness, 2017), V2491 Cyg (Ness et al., 2011; Zemko et al., 2015), V959 Mon (Peretz et al., 2016). These periodic modulations over tens of minutes have been attributed to the WD spin for V4743 Sgr and V2491 Cyg. A possible explanation for the SSS in those novae is that the WD is magnetic, namely an intermediate polar. During burning, the surface of the magnetic caps, heated also from above by accretion, may be at a higher temperature than the rest of the WD surface. This may have been the case of the intermediate polar nova V407 Lup, observed with Chandra (Aydi et al., 2018). Another interesting possibility proposed for V407 Lup and other SSS is that the burning was confined to the magnetic polar regions for a certain period of time (Orio & Shaviv, 1993; King et al., 2002; Aydi et al., 2018).
In the Lombe-Scargle periodograms of the Chandra data of our source, performed after a polynomial detrending to take possible irregular variability into account, we found two peaks at 0.6 and 0.8 mHz below the 70% confidence level, and no peak reaching the 90% confidence level. However, in the first half of the exposure, the 0.8 mHz signal, corresponding to about 20.83 minutes, is at the 86% confidence level. Although this is not a high confidence detection, the modulation may be real and may not have been measured in the second half of the exposure because its amplitude decreased. Such changes in the short term modulations of the soft X-ray flux over the time of an exposure seem to be common in novae (Ness et al., 2011; Dobrotka & Ness, 2017).
5 Discussion & Conclusions
Modeling shows that thermonuclear runaway events on WD’s (i.e., nova events) with a lack of (or very little) mass ejection are possible, providing the mass accretion rate is sufficiently high, at least a few times Prialnik & Kovetz (1995); Yaron et al. (2005); Starrfield et al. (2012); Hillman et al. (2016).
When fitting the Chandra data with an atmospheric model, we tested models with enhanced and metal-poor abundances. The best fit was obtained with the metal-poor “halo” model, which is also consistent with SMC abundances.
We have shown that the time scale of quiescence (accretion), and of the rise and decline (eruption) are in excellent agreement with our nova model of a WD mass of and accretion of solar metalicity matter at a high accretion rate of , while the metal-poor examples that we have presented here are also in good agreement with the light curve. Examining the four models demonstrates the impact of altering the different parameters will have on the eruptive behavior, in particular, it shows that the change caused by altering the metalicity can be compensated for by tweaking one (or both) of the other parameters.
The effective temperature of the fit is in excellent agreement with the maximum produced by the model. The variance of the modeled is small compared with a mass ejecting eruption, it remains above K throughout the event. This is because the TNR is relatively weak so the WD radius expands less than in a mass ejecting event. The maximum modeled radius is always so the cooling of the WD’s photosphere is very moderate. This means the WD is always an SSS during TNR of this class of non-ejecting events, which is in agreement with the Swift observations that overlap the time of the observed OGLE I mag. The observed brightness is at least two orders of magnitude lower than the modeled brightness. However, the combination of observed luminosity and effective temperature would yield a very unlikely, nearly Chandrasekhar mass WD. We interpret the discrepancy in observed and modeled luminosity as due to obscuration, an explanation already brought forward in recent years to explain the low SSS luminosity in several novae as due to the accretion disk in a high inclination binary. There is no information on the inclination of this system, because the accretion disk is fully ionized, as discussed in the Introduction. At the high mass accretion rate we inferred, the disk should remain fully ionized even at quiescence, so determining the inclination from the emission line profiles does not seem feasible even after the outburst. We note that the disk in outburst must have been very flared and very optically thick, consistent with the Swift UVOT light curves published by Rajoelimanana et al. (2017), which indicate UV luminosity higher than the I luminosity by a factor of almost 10. This large UV luminosity must arise in the disk, because with a peak temperature of 750,000 K the observed UV flux is too high to be due the Raleigh-Jeans tail of the SSS. Thus, regardless of the inclination, it is very likely that the accretion disk was optically thick to supersoft X-rays, geometrically thick and completely opaque to the SSS flux coming from most of the WD surface. We suggest that this explains the low measured bolometric luminosity compared with the thermonuclear runaway model.
Indeed, novae are frequently reported to exhibit an observed brightness that is merely a fraction of the true luminosity. For example, due to the high inclination angle of U Sco, the WD is not directly observed. For this object it is flux from Thomson scattering that is measured, which conserves the WD spectral shape and features, but at a lower intensity than the true WD luminosity. For U Sco it is Orio et al. (2013). Ness et al. (2013) discuss the cases of three other novae with high inclination, V1494 Aql, V959 Mon, and HV Cet, in which the SSS luminosity is only partially detected. V959 Mon was analyzed in detail by Peretz et al. (2016). The “missing SSS flux” is also characteristic of two persistent SSS’s, CAL 87 (Orio et al., 2004; Ness et al., 2013) and QR And (Ness et al., 2013), which are also high inclination objects.
Maccarone et al. (2019) suggested that ASASSN-16oh cannot be a nova eruption due to the lack of an observed shell, meaning that the WD did not eject mass. We have shown via modeling that the lack of ejected mass does not indicate that there is no thermonuclear burning, but rather that the expansion velocity is slower than the escape velocity from the WD surface. This is caused by a very high mass transfer rate, which minimizes degeneracy and hence explosivity in the accreted envelope of ASSASN-16oh. The resulting recurrent thermonuclear runaway is nonejective.
One SSS in M31, CXO J004318.8+412016, is estimated to be a WD with a mass of and an accretion rate and has been reported to be consistent with a post-thermonuclear outburst X-ray behavior of a very rapidly recurring source, possibly with a time of only a few months. No optical outburst has been observed from this source, implying no mass loss Orio et al. (2017). This may be the case for other recurring SSS observed in M31 (Orio et al., 2010) and in external galaxies (see catalog by Wang et al., 2016).
We have shown that the characteristics of ASASSN-16oh are typical of a non-ejective thermonuclear outburst, making it highly plausible that this object is indeed a non-ejecting nova. The models discussed here have recurrence periods of order ten to fifteen years, leading to the prediction that ASASSN-16oh may erupt again in about a decade, supporting the hypothesis that it is a typical recurrent thermonuclear runaway event.
References
- Aydi et al. (2018) Aydi, E., Orio, M., Beardmore, A. P., et al. 2018, MNRAS, 480, 572, doi: 10.1093/mnras/sty1759
- Beardmore et al. (2010) Beardmore, A. P., Osborne, J. P., Page, K. L., et al. 2010, Astronomische Nachrichten, 331, 156
- Beardmore et al. (2012) —. 2012, A&A, 545, A116
- Cash (1979) Cash, W. 1979, ApJ, 228, 939, doi: 10.1086/156922
- Collazzi et al. (2009) Collazzi, A. C., Schaefer, B. E., Xiao, L., et al. 2009, AJ, 138, 1846, doi: 10.1088/0004-6256/138/6/1846
- Dobrotka & Ness (2017) Dobrotka, A., & Ness, J.-U. 2017, MNRAS, 467, 4865, doi: 10.1093/mnras/stx442
- Drake et al. (2003) Drake, J. J., Wagner, R. M., Starrfield, S., et al. 2003, ApJ, 584, 448, doi: 10.1086/345534
- Epelstain et al. (2007) Epelstain, N., Yaron, O., Kovetz, A., & Prialnik, D. 2007, MNRAS, 374, 1449, doi: 10.1111/j.1365-2966.2006.11254.x
- Fujimoto (1982) Fujimoto, M. Y. 1982, ApJ, 257, 767, doi: 10.1086/160030
- Hillman et al. (2015) Hillman, Y., Prialnik, D., Kovetz, A., & Shara, M. M. 2015, MNRAS, 446, 1924, doi: 10.1093/mnras/stu2235
- Hillman et al. (2016) —. 2016, ApJ, 819, 168, doi: 10.3847/0004-637X/819/2/168
- King et al. (2002) King, A. R., Osborne, J. P., & Schenker, K. 2002, MNRAS, 329, L43, doi: 10.1046/j.1365-8711.2002.05173.x
- Kippenhahn & Thomas (1978) Kippenhahn, R., & Thomas, H.-C. 1978, A&A, 63, 265
- Leibowitz et al. (2006) Leibowitz, E., Orio, M., Gonzalez-Riestra, R., et al. 2006, MNRAS, 371, 424, doi: 10.1111/j.1365-2966.2006.10684.x
- Maccarone et al. (2019) Maccarone, T. J., Nelson, T. J., Brown, P. J., et al. 2019, Nature Astronomy, 3, 173
- Ness et al. (2011) Ness, J.-U., Osborne, J. P., Dobrotka, A., et al. 2011, ApJ, 733, 70, doi: 10.1088/0004-637X/733/1/70
- Ness et al. (2012) Ness, J.-U., Schaefer, B. E., Dobrotka, A., et al. 2012, ApJ, 745, 43, doi: 10.1088/0004-637X/745/1/43
- Ness et al. (2013) Ness, J.-U., Osborne, J. P., Henze, M., et al. 2013, A&A, 559, A50, doi: 10.1051/0004-6361/201322415
- Ness et al. (2015) Ness, J.-U., Beardmore, A. P., Osborne, J. P., et al. 2015, A&A, 578, A39, doi: 10.1051/0004-6361/201425178
- Orio et al. (2004) Orio, M., Ebisawa, K., Heise, J., & Hartmann, J. 2004, in Revista Mexicana de Astronomia y Astrofisica Conference Series, Vol. 20, Revista Mexicana de Astronomia y Astrofisica Conference Series, ed. G. Tovmassian & E. Sion, 210–210
- Orio et al. (2010) Orio, M., Nelson, T., Bianchini, A., Di Mille, F., & Harbeck, D. 2010, ApJ, 717, 739, doi: 10.1088/0004-637X/717/2/739
- Orio & Shaviv (1993) Orio, M., & Shaviv, G. 1993, Ap&SS, 202, 273, doi: 10.1007/BF00626882
- Orio et al. (2013) Orio, M., Behar, E., Gallagher, J., et al. 2013, MNRAS, 429, 1342, doi: 10.1093/mnras/sts421
- Orio et al. (2017) Orio, M., Luna, G. J. M., Kotulla, R., et al. 2017, MNRAS, 470, 2212, doi: 10.1093/mnras/stx1355
- Orio et al. (2018) Orio, M., Ness, J.-U., Dobrotka, A., et al. 2018, ApJ, 862, 164, doi: 10.3847/1538-4357/aacf06
- Peretz et al. (2016) Peretz, U., Orio, M., Behar, E., et al. 2016, ApJ, 829, 2, doi: 10.3847/0004-637X/829/1/2
- Piro & Bildsten (2004) Piro, A. L., & Bildsten, L. 2004, ApJ, 610, 977, doi: 10.1086/421763
- Prialnik & Kovetz (1995) Prialnik, D., & Kovetz, A. 1995, ApJ, 445, 789, doi: 10.1086/175741
- Rajoelimanana et al. (2017) Rajoelimanana, A., Charles, P., Buckley, D., & Meintjes, P. 2017, in 5th Annual Conference on High Energy Astrophysics in Southern Africa, 3
- Rauch et al. (2010) Rauch, T., Orio, M., Gonzales-Riestra, R., et al. 2010, ApJ, 717, 363, doi: 10.1088/0004-637X/717/1/363
- Schaefer (2010) Schaefer, B. 2010, The Astrophysical Journal Supplement Series, 187, 275
- Shappee et al. (2014) Shappee, B. J., Prieto, J. L., Grupe, D., et al. 2014, ApJ, 788, 48, doi: 10.1088/0004-637X/788/1/48
- Shara et al. (1977) Shara, M. M., Prialnik, D., & Shaviv, G. 1977, A&A, 61, 363
- Shara et al. (2016) Shara, M. M., Doyle, T. F., Lauer, T. R., et al. 2016, ApJS, 227, 1, doi: 10.3847/0067-0049/227/1/1
- Starrfield et al. (2012) Starrfield, S., Iliadis, C., Timmes, F. X., et al. 2012, Bulletin of the Astronomical Society of India, 40, 419. https://arxiv.org/abs/1210.6086
- Tofflemire et al. (2013) Tofflemire, B. M., Orio, M., Page, K. L., et al. 2013, ApJ, 779, 22, doi: 10.1088/0004-637X/779/1/22
- Wang et al. (2016) Wang, S., Liu, J., Qiu, Y., et al. 2016, ApJS, 224, 40, doi: 10.3847/0067-0049/224/2/40
- Werner et al. (2003) Werner, K., Deetjen, J. L., Dreizler, S., et al. 2003, in Astronomical Society of the Pacific Conference Series, Vol. 288, Stellar Atmosphere Modeling, ed. I. Hubeny, D. Mihalas, & K. Werner, 31
- Yaron et al. (2005) Yaron, O., Prialnik, D., Shara, M. M., & Kovetz, A. 2005, ApJ, 623, 398, doi: 10.1086/428435
- Zemko et al. (2015) Zemko, P., Mukai, K., & Orio, M. 2015, ApJ, 807, 61, doi: 10.1088/0004-637X/807/1/61
- Zemko et al. (2016) Zemko, P., Orio, M., Mukai, K., et al. 2016, MNRAS, 460, 2744, doi: 10.1093/mnras/stw1199