reception date \Acceptedacception date \Publishedpublication date
ISM: clouds — ISM: kinematics and dynamics — ISM: molecules — ISM: structure — stars: formation
Nobeyama 45-m Mapping Observations toward Orion A. III. Multi-Line Observations toward an Outflow-shocked Region, OMC-2 FIR 4
Abstract
We present the results of mapping observations toward an outflow-shocked region, OMC-2 FIR 4 using the Nobeyama 45-m telescope. We observed the area in 13CO (), C18O (), N2H+ (), CCS (), HCO+ (), H13CO+ (), HN13C (), H13CN (), DNC (), N2D+ (), and DC3N (). We detected a dense molecular clump that contains FIR 4/5. We also detected in 13CO blueshifted and redshifted components driven presumably by protostellar outflows in this region. The axes of the FIR 3 and VLA 13 outflows, projected on the plane of the sky, appear to point toward the FIR 4 clump, suggesting that the clump may be compressed by protostellar outflows from Class I sources, FIR 3 and VLA 13. Applying the hyperfine fit of N2H+ lines, we estimated the excitation temperature to be 20 K. The high excitation temperature is consistent with the fact that the clump contains protostars. The CCS emission was detected in this region for the first time. Its abundance is estimated to be a few , indicating that the region is chemically evolved at years, which is comparable to the typical lifetime of the Class I protostars. This timescale is consistent with the scenario that star formation in FIR 4 is triggered by dynamical compression of the protostellar outflows. The [HNC]/[HCN] ratio is evaluated to be in the dense clump and the outflow lobes, whereas it is somewhat larger in the envelope of the dense clump. The small [HNC]/[HCN] ratio indicates that the HNC formation was prevented due to high temperatures. Such high temperatures seem to be consistent with the scenario that either protostellar radiation or outflow compression, or both, affected the thermal properties of this region.
1 Introduction
In cluster-forming regions, stellar feedback from forming stars often influences the surrounding environments (McKee & Ostriker, 2007; Wang et al., 2010; Krumholz et al., 2014). For example, protostellar outflows can dynamically compress the surrounding gas and/or adjacent dense cores, and promote fragmentation and gravitational contraction leading to star formation (Shimajiri et al., 2008). In addition, such stellar feedback injects significant momentum in molecular clouds, controlling the efficiency of star formation (McKee, 1989; Nakamura & Li, 2007; Nakamura et al., 2012; Nakamura & Li, 2014; Arce et al., 2011). Theoretically, the negative effect of the stellar feedback is more important than the positive effect (Li & Nakamura, 2006; Nakamura & Li, 2007; Krumholz et al., 2014), but the positive effect is sometimes observed to enhance local star formation (Elmegreen & Lada, 1978; Sugitani & Ogura, 1994; Chauhan et al., 2009). Among the stellar feedback processes, the protostellar outflow feedback can trigger local star formation through dynamical compression of dense parts in molecular clouds (Sandell & Knee, 2001; Yokogawa et al., 2003; Shimajiri et al., 2008).
One of the good examples of the dynamical interaction between outflow and dense gas is the FIR 4 region in the Orion Molecular Could 2 (OMC-2), in which fragmentation seems to be induced by the outflow shock from a nearby protostar FIR 3 (Shimajiri et al., 2008; López-Sepulcre et al., 2013). Multi-epoch, multiwavelength Very Large Array (VLA) observations (Osorio et al., 2017) support that the FIR 3 outflow is actually moving toward the FIR 4 region, suggesting that the FIR 3 outflow is interacting with the FIR 4 region (see also González-Garcia et al., 2016). These morphological evidences strongly support that the outflow is interacting with the dense gas in this region. Shimajiri et al. (2008) detected 11 cores on the basis of the interferometric 3-mm dust continuum observations [see also Hacar et al. (2018) for the Atacama Large Millimeter/submillimeter Array (ALMA) observations]. Some of the cores have masses greater than the thermal Jeans mass in this region. Near-infrared observations suggest that protostars are already created in this clump. Although the luminosity of the central protostar is not so prominent, the mass of the protostellar envelope is derived to be about 27 (Furlan et al., 2014). Therefore, this protostar is likely to evolve at least into an intermediate-mass star. Since there are several fragments with masses greater than the local Jeans mass, the FIR 4 region may be forming a small star cluster consisting of low-mass and intermediate-mass stars.
Spectral line surveys toward FIR 4 also suggest that FIR 4 is likely to be a hot core (Ceccarelli et al., 2010; Kama et al., 2013). The hot core might be formed by the outflow compression. Or, it might be created before the outflow compression which promotes fragmentation in the FIR 4 clump. In contrast, very recently, Favre et al. (2018) found that this region has relatively uniform excitation temperature of c-C2H3 which led them to claim that there is no clear evidence of the outflow compression since the compression should create the temperature gradient. They proposed that the FIR 3 outflow does not hit FIR 4 and the spatial overlap of the outflow lobe and the clump in the two-dimensional map may be the apparent coincidence along the line of sight. However, because of the large uncertainty in the estimated temperatures and poor angular resolution, it would be difficult to accurately discuss the temperature distribution in this region from the data. Higher sensitivity and higher angular resolution observations are needed to further constrain the outflow compression scenario.
Located in the Orion A molecular cloud, the FIR 4 region is one of the closest cluster-forming regions. The distance to the Orion A molecular cloud is estimated to be 414 pc by Menten et al. (2007) and 418 6 pc by Kim et al. (2008). These two measurements reasonably coincide with each other. Hereafter, we adopt 414 pc as a representative distance of the FIR 4 region. Some indirect evidence of dynamical interaction by the FIR 3 outflow also comes from recent spectral line surveys (Kama et al., 2013; Shimajiri et al., 2015b; Kama et al., 2015). In the present paper, we characterize the physical and chemical properties of the possible outflow-shocked region, FIR 4, by several molecular line observations such as N2H+, CCS, HN13C, and H13CN. In addition, we identify possible protostellar outflow candidates in this region, using the 13CO () and HCO+ () data.
The observations of the FIR 4 region were made part of the Nobeyama Star Formation Legacy Project at the Nobeyama Radio Observatory (NRO) to observe nearby star-forming regions such as Orion A, Aquila Rift, and M17. A overview of the project will be presented in a separate paper (Nakamura et al. 2019) and the detailed observational results for the individual regions are given in other articles (Orion A: Tanabe et al. 2019, Ishii et al. (2019), Aquila Rift: Shimoikura et al. (2019), kusune19, M17: Shimoikura et al. (2019), Sugitani et al. (2019) other regions: Dobashi et al. (2018)). The FIR 4 region was observed once or twice every day to check the absolute flux calibration of 13CO (), C18O (), and N2H+ () in Orion A, which were obtained with a new receiver, FOREST installed on the Nobeyama 45-m telescope. Thus, these molecular line data have excellent sensitivity.
The paper is organized as follows. Section 2 describes the detail of our Nobeyama 45-m observations. In Section 3, we present the results of our mapping observations. We report the detection of the CCS emission at 93 GHz, which is the first detection of CCS in the OMC-2 region. In Section 4, we discuss some characteristics of the internal structure of this region. Using our molecular line data, we identify the molecular outflow candidates in this region in Section 5, and briefly discuss how the outflows interact with the dense clump. Finally, Section 6 summarizes the main results of this study.
2 Observations and Data
Observed lines with FOREST Molecule Transition Rest Frequency Effective Resolutionb noise levelc (GHz) (arcmin) (K) 13CO =1–0 110.201354 \timeform21.7” 0.19 C18O =1–0 109.782176 \timeform21.7” 0.16 CCS 93.870098 \timeform32.5” 0.04 N2H+ 93.1737637a \timeform23.4” 0.06 {tabnote} athe rest frequency of the main hyperfine component from Pagani et al. (2009). In the last column, we present the rms noise level in . We observed all 6 hyperfine components.
bThe CCS data were spatially smoothed to improve the signal-to-noise ratio.
c The noise levels are measured with a velocity resolution of 0.05 km s-1.
2.1 13CO ( = 1–0), C18O ( = 1–0), N2H+ (=1–0) and , CCS ) Observations
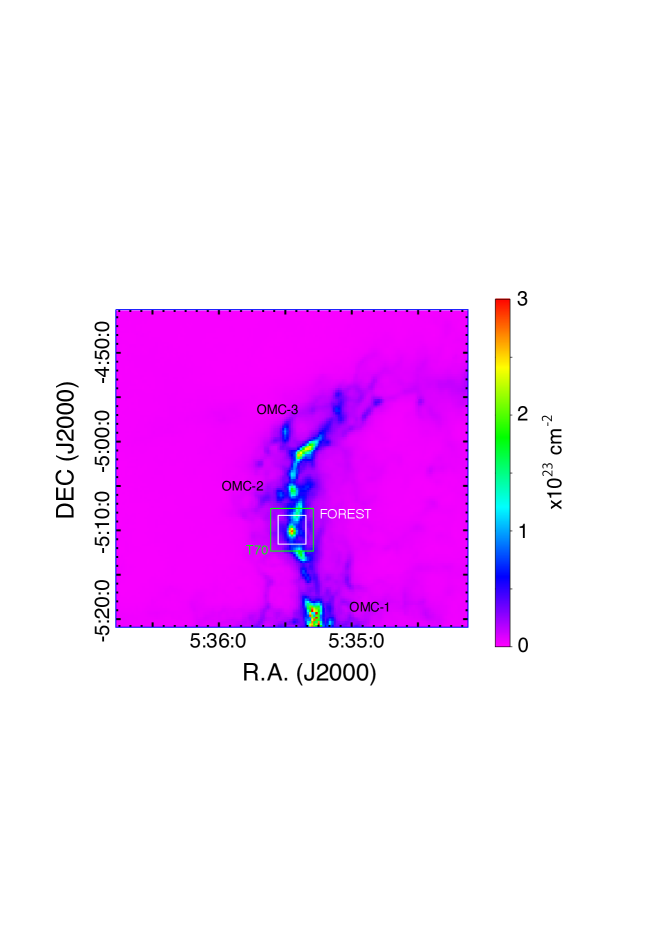
We carried out mapping observations in 13CO ( = 1–0), C18O ( = 1–0), N2H+ (=1–0) and CCS ) toward the FIR3/4/5 region in Orion A using a new receiver FOREST [Four-Beam Receiver System on the 45-m Telescope] which is a 4-beam, dual-polarization sideband-separating SIS receiver installed on the 45 m telescope of the Nobeyama Radio Observatory. See Minamidani et al. (2016) for more details of FOREST. The telescope has an Full-Width at Half Maximum (FWHM) beam size of \timeform18” at 93 GHz. The beam separation of FOREST is on the sky. The mapping area is indicated in Figure 1 with a white square. The observed lines and their parameters are summarized in Table 2. The observations were done in a On-The-Fly (OTF) mode (Sawada et al., 2008) in the period from 2016 December to 2017 March. We adopted a spectral window mode which allows us to obtain 4 lines simultaneously. The FIR 4 maps were obtained for the intensity calibration of the larger Orion A map (see Nakamura et al. 2018 for more details). As the backends, we used a digital spectrometer based on an FX-type correlator, SAM45, that is 16 sets of 4096 channel array. The frequency resolution of all spectrometer arrays was set to 15.26 kHz, which corresponds to 0.05 km s-1 at 93 GHz. The scan interval of the OTF observation is set to \timeform5”.17, so that individual scans by the 4 beams of FOREST are fully overlapped.
The temperature scale was determined by the chopper-wheel method. The telescope pointing was checked every 1 hour by observing the SiO maser line from Orion KL (R.A. [J2000], Dec. [J2000]) = ). The pointing accuracy was better than 3′′ throughout the entire observation. The typical system noise temperature was in the range from 150 K to 200 K in the single sideband mode at the observed elevation of El=\timeform30D–\timeform50D.
In order to minimize the scanning effects, the data with orthogonal scanning directions along the R.A. (-scan) and Dec. (-scan) axes were combined into a single map. In total, we combined 6 -scan and 7 -scan data into single maps. We adopted a spheroidal function with a width of 7′′.5 as a gridding convolution function to calculate the intensity at each grid point of the final cube data with a spatial grid size of \timeform7.5”, about a third of the beam size. The resultant effective angular resolution was about 22′′ at 110 GHz, corresponding to 0.05 pc at a distance of 414 pc.
The main beam efficiencies were 0.50 and 0.43 at 93 GHz and 110 GHz, respectively. We divided the intensities by the main beam efficiencies at the corresponding frequencies and made the maps in the brightness temperature scale. More details of the observations and data reduction will be given in a separate paper (Nakamura et al. 2018). The CCS image presented in figure 2(d) was smoothed to improve the signal-to-noise ratios of the map since the CCS emission in the FIR 4 region is very weak.
Observed lines with T70 Molecule Transition Rest Frequency Effective Resolutiona noise level (GHz) (arcmin) (K) HCO+ =1–0 89.188526 \timeform24.9” 0.45 H13CO+ =1–0 86.754288 \timeform33.6” 0.20 H13CN =1–0, =2–1 86.3401764 \timeform33.6” 0.16 HN13C =1–0, =2–1 87.090859 \timeform33.6” 0.18 N2D+ =1–0 77.107798 \timeform32.5” 0.29 DNC =1–0 76.305697 \timeform32.5” 0.27 DC3N =9–8 75.987149 \timeform32.5” 0.33 {tabnote} a For all the lines except HCO+, the images were smoothed to improve the signal-to-noise ratios. The last column is average rms noise levels of the whole area at an velocity resolution of 0.05 km s-1.
2.2 HCO+ ( = 1–0), H13CO+ ( = 1–0), HN13C ( = 1–0), H13CN ( = 1–0), DNC ( = 1–0), N2D+ (), and DC3N ( = 9–8) Observations
We carried out mapping observations in HCO+ ( = 1–0), H13CO+, ( = 1–0), H13CN ( = 1–0), HN13C ( = 1–0), DNC ( = 1–0), N2D+ ( =1–0), and DC3N (=9–8) toward slightly larger area than we mapped with FOREST, using the T70 receiver installed on the Nobeyama 45-m telescope. The mapping area is indicated in Figure 1 with a green square. The observed lines and their parameters are summarized in Table 2.1. The observation procedure was essentially the same as that of the FOREST observations. The observations were done in the OTF mode in the period from 2016 December to 2017 February. We used SAM 45 at a frequency resolution of 3.81 kHz, corresponding to 0.0125 km s-1 at 86 GHz. Scan interval of the OTF observation is set to \timeform5”. The typical system noise temperature was in the range from 150 K to 250 K in the single sideband mode at the observed elevation.
The temperature scale was determined by the chopper-wheel method. The telescope pointing was checked every 1 hour by observing the SiO maser line from Orion KL. The pointing accuracy was better than 3′′ throughout the entire observation. Adopting a spheroidal function with a width of 7.5′′ as a gridding convolution function to compute the intensity at each grid point, we made final images with a spatial grid size of \timeform7.5” by combining a -scan and a -scan images into single maps to obtain a map in the antenna temperature scale. The resultant effective angular resolution was about 25′′. Finally, we divided the intensities by the main beam efficiencies at the corresponding frequencies to obtain the maps in the brightness temperature scale. The main beam efficiencies at 89 GHz, 87 GHz and 76GHz for the T70 receiver were about 0.543, 0.544, and 0.549, respectively. All the lines except HCO+ are relatively weak. To improve the signal-to-noise ratios of the maps, the images presented below for all the observed lines except HCO+ were smoothed and thus the resultant effective angular resolutions were 33 for those images.
3 Spatial Distributions of Molecular Line Emission
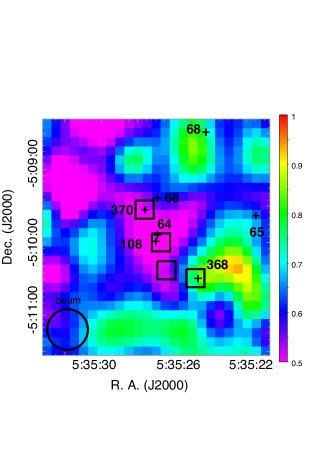
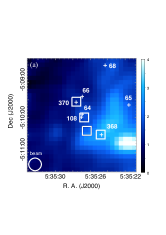
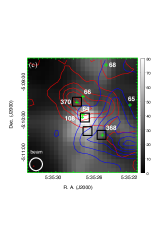
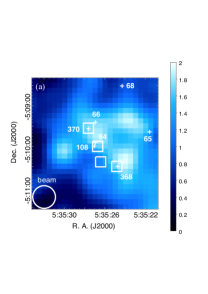
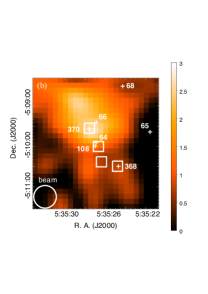
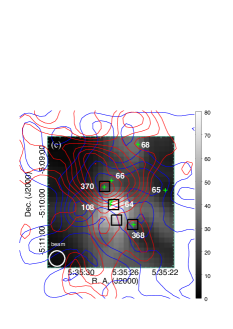
In this section, we describe the spatial distributoins of the molecular line emission in the observed area. In Figure 2, we present the integrated intensity maps of the molecular line emission detected. Recently, Kainulainen et al. (2017) investigated the OMC-2 region with ALMA. Following their Table 2, the protostars previously identified in this region are listed in Table 3.
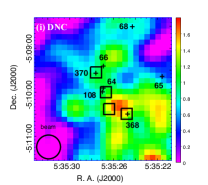
Protostars in the FIR 3/4/5 Region Name R.A. [J2000] Dec. [J2000] Mass Class Outflow candidatea Identificationb Note Referencesc HOPS68 05:35:24.287 05:08:30.65 1.7 I R C FIR2 Aso et al. (2000); Williams et al. (2003) Takahashi et al. (2008) HOPS66 05:35:26.928 05:09:24.40 1.5 Flat Takahashi et al. (2008) detected near-infrared knots. HOPS370 05:35:27.618 05:09:34.06 2.5 I BR C FIR3 Aso et al. (2000); Williams et al. (2003) Wu et al. (2005) Takahashi et al. (2008); Shimajiri et al. (2008) HOPS65 05:35:21.566 05:09:38.62 0.2 I HOPS64 05:35:26.928 05:09:54.51 0.5 ? R M this paper HOPS108 05:35:27.015 05:09:59.59 0.3 0 BR M FIR4 Takahashi et al. (2008) claimed marginal detection HOPS368 05:35:24.717 05:10:29.78 0.7 I BR C VLA 13 Takahashi et al. (2008) {tabnote} a Outflow identification is based on the present paper. See Section 5 for details.
b C and M indicate outflows identified as clear and marginal, respectively.
c previous detection
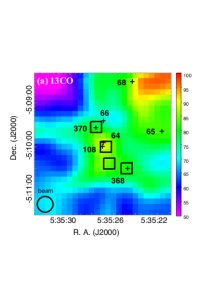
3.1 13CO and C18O
In Figures 2a and 2b, we present the velocity-integrated intensity maps of 13CO and C18O, respectively. The velocity range of the integration is set to 5.1 km s-1 15.1 km s-1 for both 13CO and C18O. The distribution of the 13CO emission matches reasonably well with that of C18O. For both 13CO and C18O maps, the intensities are strongest near the upper-right corner of the observed area (recognized as parts with red in Figures 2a and 2b), which is a part of the other core traced in the 1.1-mm continuum [Core No. 320 of Shimajiri et al. (2015a), see also the white box in Figure 1.]. The 13CO emission takes its local maximum near the position of FIR 4 (HOPS108) at (R.A. [J2000], Dec. [J2000]) = (\timeform5h35m27s, \timeform-5D10’00”), which coincides with the position of the C18O local peak. Both the 13CO and C18O emission trace a dense clump and its envelope which contains FIR 3/4/5. The dense clump corresponds to Core No. 327 of Shimajiri et al. (2015a) and is elongated in the north-south direction, which is roughly similar to the large-scale filament axis of the OMC-2 region. The high resolution ALMA maps also revealed that the main filamentary structure is along the north-south direction (Kainulainen et al., 2017; Hacar et al., 2018)
3.2 N2H+
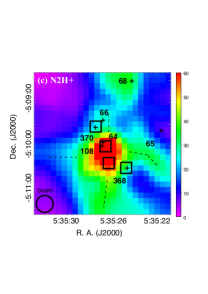
In Figure 2c, we present the intensity maps of N2H+ velocity-integrated from 1.6 km s-1 to 20.1 km s-1. In other words, we integrate the emission of all 7 hyperfine components.
The strongest emission of N2H+ () comes near the position of FIR 4 (HOPS108) at (R.A. [J2000], Dec. [J2000])=(\timeform5h35m26.5s, \timeform-5D10’00”). The position of the N2H+ peak agrees well with those of 13CO and C18O. In the following, we refer to the central compact molecular clump detected by N2H+ as the N2H+ clump. The clump contains FIR4/5. The FIR 3 protostar is located at the north-east edge of the N2H+ clump. The VLA 13 protostar is located at the south-west edge of the clump. This N2H+ clump corresponds to core No. 10 of Tatematsu et al. (2008). The N2H+ clump has a couple of spines which are indicated with dashed lines in Figure 2c. This region is also observed with ALMA in N2H+ (Hacar et al., 2018). The overall distribution of the N2H+ emission agrees well with the ALMA map. For example, the positions of the spines are in good agreement with the structures seen in the ALMA image. The ALMA map revealed that the FIR 4 clump are connected with a couple of small filaments which can be recognized in Figure 2c as spines. Such a structure is morphologically reminiscent of the hub-filament structure discussed by Myers (2009), although the size of the region is smaller than the ones originally discussed by Myers (2009). It is worth noting that the 13CO high velocity component of the VLA 13 outflow is anti-correlated with the N2H+ distribution. Similar distributions are recognized in the maps of other high density tracers (see the next subsections). The other moderately-strong N2H+ emission comes from just north of the N2H+ clump, which deviates from the C18O peak at the upper-right corner of Figure 2b.
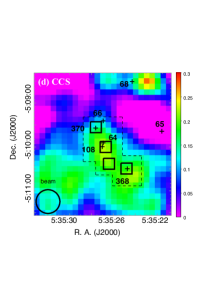
3.3 CCS
In Figure 2d, we show the integrated intensity map of CCS (). The overall distribution is roughly similar to that of C18O. This is the first detection of the CCS emission in the OMC-2 region. Previous observations by Tatematsu et al. (2008) reported no detection of CCS () presumably because of lower sensitivity. The strongest emission comes from the upper-right corner of the observed area (west of HOPS68), where the 13CO and C18O emission is strong. This component is likely to belong to core No. 320 of Shimajiri et al. (2015a). We also see another local peak in the northern part just above the N2H+ clump (east of HOPS68). The other strong peaks of CCS are located in the N2H+ clump toward FIR 4 (HOPS108) at (R.A. [J2000], Dec. [J2000]) = (\timeform5h35m27s, \timeform-5D10’00”), and just in the south-east part of VLA 13 (HOPS368).
3.4 HCO+ and H13CO+
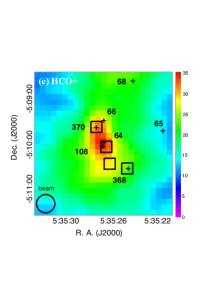
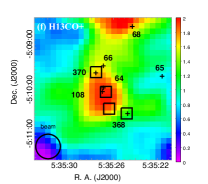
In Figures 2e and 2f, we present the integrated intensity maps of HCO+ and H13CO+. The HCO+ distribution is elongated in the north-south direction and its distribution resembles those of 13CO and C18O. But, the position of the local peak at the northern part significantly deviates from those of the 13CO and C18O (east of HOPS68) and is consistent with the N2H+ peak. H13CO+ emission basically follows the HCO+ distribution and is more extended than the N2H+ distribution.
3.5 HN13C and H13CN
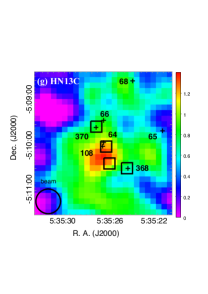
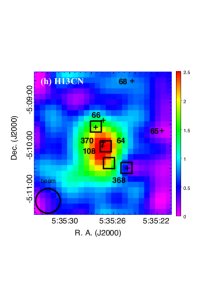
In Figures 2g and 2h we present the integrated intensity maps of HN13C and H13CN. H13CN has three hyperfine components and we integrated all three components to make the map. Roughly speaking, the spatial distributions of these emission lines are similar to that of H13CO+, although they are less extended.
The strongest H13CN emission comes from the N2H+ clump (at the position of FIR 4). HN13C has a few relatively-strong peaks at (R.A. [J2000], Dec. [J2000]) = (\timeform5h35m27s, \timeform-5D10’17”), (\timeform5h35m23s, \timeform-5D10’9”) and (\timeform5h35m25s, \timeform5D8’35”). The strongest peak is between FIR 4 and FIR 5. The other local peak is located between HOPS65 and HOPS368. Another local peak is located near HOPS68. In the N2H+ map, we see spines stretching from the central N2H+ clump toward the south-west direction. The HN13C emission appears to follow the spines seen in N2H+.
3.6 DNC, N2D+, and DC3N
We did not detect N2D+ and DC3N emission at the noise level of 0.3 K at an velocity resolution of 0.05 km s-1. Below we describe only the distribution of DNC. In Figure 2i, we present the velocity integrated intensity map of DNC. Relatively strong emission of DNC comes between FIR 5 and VLA 13 and the emission is extended toward the west direction from VLA 13 (HOPS368).
4 Derivation of Physical Quantities
4.1 N2H+ and CCS abundances
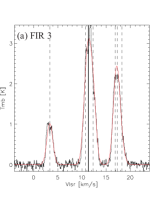
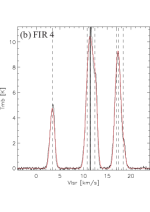
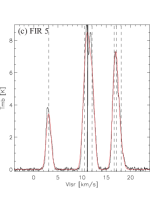
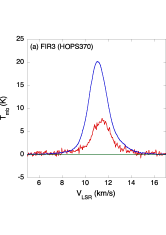
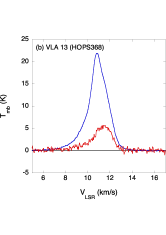
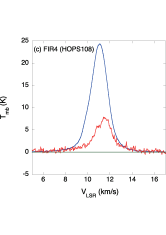
Here, we estimate the abundances of CCS and N2H+ at several positions. Since the CCS emission is weak, we derive only the values averaged in the small area which contains all four sources FIR 3/4/5 and VLA 13, which is indicated in dashed lines in Figure 2d. The averaged profile is shown in Figure 3. The derived physical quantities are summarized in Table 4.1.
We compute CCS column densities assuming that the emission is optically thin. The excitation temperature is adopted to be 5 K. The CCS fractional abundance does not vary significantly from position to position, and stays at about . Here, we derived the column density of H2 from the Herschel H2 map. The rms noise level of the CCS data was about 0.036 K km s-1 for the angular resolution of 32.5, corresponding to cm-2. Therefore, the CCS integrated intensities at the positions of FIR3/4/5 and VLA13 were from 4 to 7 . According to the chemical evolution calculations by Suzuki et al. (1992) and Marka et al. (2012), such a small abundance can be achieved at the times of years and years. According to Marka et al. (2012), the time evolution of the CCS abundance is not so different for the temperatures from 10 K to 25 K, whereas for much higher gas temperatures, the chemical time scale may be shorter due to faster chemical reaction (see e.g., Shimoikura et al., 2018). In the FIR 4 region, the gas temperature is likely to be 20 K. Thus, the chemical timescales should be comparable to those in dark clouds with 10 K. Since the protostars already formed in this region, the evolution time of this region is likely to be years, which is comparable to the typical lifetime of the Class I protostars.
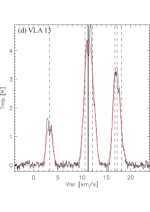
For N2H+, we apply the hyperfine fit to derive the physical parameters. The results of the hyperfine fits at FIR 3, FIR 4. FIR 5, and VLA 13 are shown in Figure 4. We used the same fitting program as that of Tanaka et al. (2013), in which the excitation temperatures and velocity widths are assumed to be identical for the seven hyperfine components. For simplicity, we assume that only one component exists along the line of sight, although this assumption seems not to be appropriate at least for FIR 3 and VLA 13, both of which have at least two components. The fractional abundance of N2H+ is relatively high in this region. It is highest at FIR 4. The excitation temperature of N2H+ is relatively high at K. It is strongest at the position of VLA 13. In the starless cores in the southern part of Orion A, the N2H+ excitation temperatures are as low as 10 K (Tatematsu et al., 2014). In Oph B2 region where only 4 protostars are identified, the N2H+ excitation temperatures stay as low as 5 K (Friesen et al., 2010). Other examples of the low excitation temperatures in starless regions can be found in Di Francesco et al. (2004) and Tanaka et al. (2013) toward Oph A and Serpens South, respectively. These previous studies indicate that in the regions where star formation is not active, the excitation temperatures of N2H+ stay as low as 5 10 K. Thus, the high excitation temperature in the FIR 4 region may indicate the existence of protostars in this region. The line widths are about 1 km s-1 for all the positions, which is comparable to that of CCS.
Physical Parameters of CCS and N2H+ toward FIR 3, FIR 4, FIR 5, and VLA 13 Area FIR 3 FIR 4 FIR 5 VLA 13 2.3 1.5 2.8 2.5 0.69 2.8 2.2 3.4 3.1 2.6 2.0 1.5 5.0 1.2 3.8 (km s-1) 1.3 0.12 5.8 2.9 2.3 1.2 16.0 0.9 21.8 0.1 23.1 0.3 26.2 1.5 (km s-1) 1.4 0.1 1.1 0.1 1.1 0.1 1.4 0.1 3.8 10.3 8.9 1.7 0.8 0.1 2.9 0.1 1.9 0.1 0.6 0.1
4.2 The HN13C/H13CN Ratio
Previous observations revealed that the [HNC]/[HCN] ratio varies from region to region. For example, in warm dense gas in OMC-1, it is measured to be much smaller than unity (Goldsmith et al., 1981, 1986). On the other hand, in cold dense gas, Tennekes et al. (2006) derived a somewhat large ratio of 3 4 toward Cha-MM1. Colzi et al. (2018) showed that for high-mass starless cores, the [HNC]/[HCN] ratio stays at around unity, whereas it decreases for more-evolved objects such as high-mass protostellar cores ( 0.5). Jin et al. (2015) found that the [HNC]/[NCN] ratio increases from IRDCs to UC HIIs. These studies indicate that the [HNC]/[HCN] ratio depends on the physical conditions. The [HNC]/[HCN] ratio may be a useful indicator to guess the physical states of star-forming regions. However, it still remains uncertain which mechanism is more responsible for determining the [HNC]/[HCN] ratio. Here, we examine the spatial distribution of the [HNC]/[HCN] ratio in the FIR 4 region to gain additional information to understand the HNC/HCN chemistry.
Hirota et al. (1998) proposed that the [HNC]/[HCN] ratio depends on the gas temperature and rapidly decreases as the temperature exceeds the critical value of 24 K, above which a neutral-neutral reaction of HNC + H HCN + H is responsible for destroying HNC (see also Schilke et al., 1992; Talbi et al., 1996). Colzi et al. (2018) discussed that the small ratio for high-mass protostellar cores may be due to the effect of selective destruction of HNC by the reactions of HNC + H HCN + H and HNC + O NH + CO, suggesting the existence of the threshold temperature for the selective destruction of HNC, although future laboratory experiments are needed to accurately estimate the reaction rate with O at low temperatures to understand the temperature dependence of the [HNC]/[HCN] ratio. Loison et al. (2014) pointed out that in the presence of carbon atom in gas phase, C + HNC reaction also prevents the [HNC]/[HCN] ratio from reaching unity. On the other hand, Aguado et al. (2017) discussed the effect of FUV radiation which can selectively photodissociates HNC, because the photodissociation cross section is larger for HNC, leading to smaller [HNC]/[HCN] ratios for stronger FUV. However, the parameter space is not fully explored for the effects of the FUV radiation. Further investigations would be needed.
In Figure 5 we show the spatial distribution of the [HNC]/[HCN] ratio of the FIR 4 region. Here, we assume that [HNC]/[HCN] ratio is identical to [HN13C]/[H13CN] ratio and we derived the column densities of HN13C and H13CN by assuming that both emission is optically thin. Here, the excitation temperature is set to 20 K to compute the column densities. We note that the column densities are insensitive to the assumed excitation temperature and they varies only within errors of 30 % in the range of 10 K to 30 K. In the N2H+ clump, the [HNC]/[HCN] ratio is estimated to be 0.5. It is smaller than the value at Cha-MMS 1 which has the ratio of 34, but not extremely small such as in the OMC-1 hot core. It is somewhat higher in the envelope of the N2H+ clump. The average ratio in the clump seems to be consistent with the values () in the high-mass protostellar objects derived by Colzi et al. (2018).
As we mentioned above, there are at least two effects discussed for reducing the [HNC]/[HCN] ratio (Hirota et al., 1998; Colzi et al., 2018; Aguado et al., 2017). One is that the gas temperature exceeds the critical temperature for the HNC formation. In this case, the achieved [HNC]/[HCN] ratio tends to be very small () for higher temperature (K). The average dust temperature of the N2H+ clump is estimated to be about 26 K (Lombardi et al., 2014), which is somewhat larger than or at least comparable to the critical temperature of 24 K. Second is the FUV radiation which can selectively photodissociate HNC, resulting in the smaller [HNC]/[HCN] ratio. Recently, Ishii et al. (2018) estimated the dimensionless FUV strength from the Herschel 70 m data and they found that the parameter of the FIR 4 region exceeds 100 and peaked at around FIR 3 ( 7000) and VLA 13 (). If the UV radiation is more responsible for determining the spatial distribution of the ratio, it should be lower at around VLA 13, similarly to at FIR 3. In contrast, our derived ratio is somewhat larger at VLA 13 than in the N2H+ clump and FIR 3, and thus seems to be inconsistent with the effect of the FUV radiation. Although further understanding of the HNC and HCN chemistry would be needed, we tentatively conclude that the effect of the temperatures comparable to the critical value ( K) is more responsible for the observed [HNC]/[HCN] ratio.
If the [HNC]/[HCN] ratio is a good indicator of the temperature in the dense regions, our [HNC]/[HCN] image might provide an evidence of the outflow-dense gas interaction in this region. When the FIR 3 outflow interacts with the dense molecular gas in the FIR 4 region, the dynamical compression heats up the gas. As a result, the [HNC]/[HCN] ratio in the FIR 4 clump may be somewhat reduced. At the positions of the outflow lobes of the FIR 3 and VLA 13 outflows (see the distribution of the outflow lobes in HCO+ (figure 8 in the next section) and 12CO (Takahashi et al., 2008)), the [HNC]/[HCN] ratio is smaller than the values in the surrounding parts. These features of the [HNC]/[HCN] ratio may be a sign of the outflow-dense gas interaction. In addition, the obtained [HNC]/[HCN] ratio in the FIR 4 clump might be inconsistent with the scenario that FIR 4 is a hot core (Ceccarelli et al., 2010; Kama et al., 2013), since the [HNC]/[HCN] ratio in the OMC-1 hot core is much smaller than the value in FIR 4 (Goldsmith et al., 1981, 1986).
5 Molecular Outflows
In the observed area, 7 protostars are previously identified, which are listed in Table 3. 5 of them are classified as Class 0/I. Such protostars often drive powerful molecular outflows. Takahashi et al. (2008) performed the outflow survey in CO () toward Orion A and in this region, they detected three outflows [FIR 2 (HOPS68), FIR 3 (HOPS370), VLA 13 (HOPS368)]. Here we identify the outflows driven on the basis of the 13CO and HCO+ images.
In Figures 6, we show the line profiles of 13CO and HCO+ toward the three representative positions, FIR3, VLA13, and FIR 4. Both the 13CO and HCO+ line profiles at the three position have high-velocity wings which may originate from molecular outflows. In Figures 7a and 7b, we show the blueshifted and redshifted components of the 13CO emission, respectively. We also show the blueshifted and redshifted 13CO emission overlaid on the N2H+ integrated intensity image in Figure 7c. For comparison, in Figure 8a, 8b, 8c, we present the same figures as Figures 7a, 7b, and 7c, respectively, but for HCO+. The HCO+ emission is another good tracer of outflows in OMC-2/3 (Aso et al., 2000).
We adopt the systemic velocity of 11.3 km s-1 which is measured in H13CO+ () (Shimajiri et al., 2008). This velocity is in good agreement with the centroid velocity determined from CCS, 11.14 km s-1. First, previous observations suggest that the FIR 3 (HOPS370) protostar is a outflow source whose axis (NW-SE direction) is roughly on the plane of sky (Takahashi et al., 2008; Shimajiri et al., 2008). Therefore, both the redshifted and blueshifted components are seen in 12CO () [see Figure 1 of Shimajiri et al. (2008)]. In our 13CO maps, the redshifted components (NW-SE direction) are more prominent and the blueshifted component is very vague. The redshifted components are also clearly seen in HCO+. The southern tip of the redshifted component appears to reach FIR 4 for both the 13CO and HCO+ maps, indicating the outflow-dense gas interaction. We note that the velocity range for the integration in 13CO is different from that of Shimajiri et al. (2008).
In the 13CO map, the redshifted component extended from FIR 3 in the east-west direction is prominent. This component can vaguely be recognized in the HCO+ map, appearing that this component is driving from HOPS66. On the other hand, the blueshifted component is not seen. It might be overlapped by the FIR 3 component.
In the upper-right corner of the figures, we see blueshifted and redshifted components from the FIR 2 (HOPS 68) outflow. This outflow is already reported by Takahashi et al. (2008) who suggested that the outflow axis is along the north-south direction. In the 13CO maps, both redshifted and blueshifted components are seen in the southern part, and the redshifted component is somewhat stronger. In the HCO+ map, we see relatively strong redshifted component in the northern part of FIR 2, which is outside the mapping area of the FOREST observations (see Figure 8). On the other hand, we do not find clear blueshifted lobe in HCO+. Since both components in 13CO are seen in the southern part, the outflow axis may be nearly on the plane-of-sky.
Near FIR 4 and FIR 5, the strong redshifted component which is extended to south from FIR 4 can be seen in the HCO+ image. This component might be the outflow from FIR 4 (HOPS 64). In fact, the compact blueshifted counterpart is distributed just north of this protostar, although this blueshifted component might be the outflow from FIR 3. Takahashi et al. (2008) also detected broad wings toward FIR 4 in CO (). Our detected components in 13CO and HCO+ may be related to their detected wings.
Finally, we see high velocity components near VLA 13 (HOPS368). A faint redshifted component is seen in the HCO+ emission in the southwest direction of VLA 13. On the other hand, the blueshifted component is seen just in the north of VLA 13. The outflow axis appears to be somewhat tilted in the NE-SW direction in the plane-of-sky. In the 13CO maps, we see both redshifted and blueshifted components in the western part. We note that the axis of the outflow seen in 12CO () also appears to be slightly tiled in the NE-SW direction (see Tanabe et al. 2018), consistent with our interpretation. Since the dense gas is not distributed in the NE-SW direction, there is a possibility that the VLA 13 outflow might blow away the dense gas in this area, and dynamically compressed the dense clump of FIR 4. The outflow identification in Orion A using 12CO () is discussed in more details by Tanabe et al. (2018). It is worth noting that the dense gas distribution is anti-correlated with the distribution of the outflow component. However, this anti-correlation is not strong evidence of the outflow interaction.
In total, we confirmed 4 known outflow candidates including marginal detection by Takahashi et al. (2008) and 1 new possible outflow candidate using the 13CO and HCO+ maps. The results of the outflow identification is summarized in Table 3. We note that the two marginally detected candidates might be just contamination of nearby outflow components from FIR 3 and VLA 13. To confirm that the HOPS64 and HOPS108 are the driving sources of the molecular outflows, higher-angular resolution observations will be needed. The scenario that the dynamical compression due to the outflows has triggered star cluster formation in this region (Shimajiri et al., 2008) is not inconsistent with the chemical timescale of 105 years expected from the CCS abundance. Star formation in FIR 4 may have been triggered by the outflow compression. Alternative scenario is that star formation in FIR 4 happened before the outflow hit the FIR 4 clump which evolved into a hot core (Kama et al., 2013) and subsequent star formation in FIR 4, or fragmentation, may be triggered by the outflow compression (Shimajiri et al., 2008). Further chemical modeling may provide us a hint to constraint the evolution of FIR 4.
6 Summary
We summarize the main results of the present paper as follows.
-
1.
We carried out mapping observations toward an outflow-shocked region, OMC-2, FIR 3/4/5 in 13CO (), C18O (), N2H+ (), CCS (), HCO+ (), H13CO+ (), HN13C (), H13CN (), DNC (), N2D+ (), and DC3N () using a new 4 beam receiver FOREST and the T70 receiver. We detected all the molecular lines except N2D+ and DC3N.
-
2.
We detected faint CCS emission from a dense clump containing FIR 4. This is the first detection of CCS emission in OMC-2. The typical fractional abundance is estimated to be about a few .
-
3.
The [HNC]/[HCN] ratio is smaller than unity in the N2H+ clump and the outflow lobes, whereas the [HNC]/[HCN] ratio is sometimes higher in the clump envelope.
-
4.
From the N2H+ hyperfine fit, we found that the excitation temperature in this region is high. The high excitation temperature might be due to the effect of radiation by protostars in this region.
-
5.
We confirmed 4 known outflow candidates including marginal detection by Takahashi et al. (2008) and 1 new possible outflow candidate using 13CO and HCO+ () emission. Previous studies suggest that the FIR 3 outflow hits the FIR4 clump (Shimajiri et al., 2008; González-Garcia et al., 2016) and triggered star formation in this region (Shimajiri et al., 2008). In the present paper, we proposed that the protostellar outflow from VLA13 as well as FIR3 may have compressed the FIR 4 clump, taking into account the spatial distribution of blueshifted and redshifted 13CO and HCO+ components projected on the plane-of-the sky. In addition, there is a possibility that the moderately-small [HNC]/[HCN] ratios in the N2H+ clump and the outflow lobes might be due to the dynamical interaction between the clump and outflows and strong FUV radiation, both of which might release the atomic carbon that prevents the formation of HNC.
This work was carried out as one of the large projects of the Nobeyama Radio Observatory (NRO), which is a branch of the National Astronomical Observatory of Japan, National Institute of Natural Sciences. We thank the NRO staff for both operating the 45 m and helping us with the data reduction. This work was financially supported by Grant-in- Aid for Scientific Research (Nos. 17H02863, 17H01118, 26287030). YS received support from the ANR (project NIKA2SKY, grant agreement ANR-15-CE31-0017).
References
- Aguado et al. (2017) Aguado, A., Roncero, O., Zanchet, A. et al. 2017, A&A, 838, 33
- Arce et al. (2011) Arce, H. G., Borkin, M. A., Goodman, A. A., et al. 2011, ApJ, 742, 105
- Aso et al. (2000) Aso, Y., Tatematsu, K., Sekimoto, Y. et al. 2000, ApJS, 131, 465
- Caselli et al. (2002) Caselli, P., Benson, P. J., Myers, P. C., & Tafalla, M., 2002, ApJ, 572, 238
- Ceccarelli et al. (2010) Ceccarelli, C., Bacmann, A., Boogert, A., et al. 2010, A&A, 521, L22
- Chauhan et al. (2009) Chauhan, N., Pandey, A. K., Ogura, K. et al. 2009, MNRAS, 396, 964
- Chini et al. (1997) Chini, R., Reipurth, B., Sievers, A. et al. 1997, A&A, 325, 542
- Colzi et al. (2018) Colzi, L., Fontani, F., Caselli, P. et al. 2018, A&A, 609, A129
- Di Francesco et al. (2004) Di Francesco, J., André, P., & Myers, P. C. 2004, ApJ, 617, 425
- Dobashi et al. (2018) Dobashi, K., Shimoikura, T., Endo, N., 2018, PASJ, in press
- Elmegreen & Lada (1978) Elmegreen, B. G. & Lada, C. J. 1977, ApJ, 214, 725
- Emerson & Graeve (1988) Emerson, D. T. & Graeve, R. 1988, A&A, 190, 353
- Favre et al. (2018) Favre, C., Ceccarelli, C., Lopez-Sepulcre et al. 2018, A&A, 859, 136
- Friesen et al. (2010) Friesen, R. K., Di Francesco, J., Shimajiri, Y., Takakuwa, S., 2010, ApJ, 708, 1002
- Furlan et al. (2014) Furlan, E., Megeath, S. T., Osorio, M., et al. 2014, ApJ, 786, 26
- Goldsmith et al. (1981) Goldsmith, P.F., Langer, W.D., Ellder, J., Irvine W., & Kollberg E. 1981, ApJ, 249, 524
- Goldsmith et al. (1986) Goldsmith P.F., Irvine, W.M., Hjalmarson, A., Elldér, J., 1986, ApJ, 310, 383
- González-Garcia et al. (2016) González-Garcia, B., Manoj, P., Watoson, D., M., et al. 2016, A&A, 596, 26
- Hacar et al. (2018) Hacar, A., Tafalla, M., Forbrich, J. et al. 2018, A&A, in press (arXiv:1801.01500)
- Hirota et al. (1998) Hirota, T., Yamamoto, S., Mikami, H., Oishi, M. 1998, ApJ, 503, 717
- Hirota et al. (2001) Hirota, T., Ikeda, M., Yamamoto, S. 2001, ApJ, 547, 814
- Ishii et al. (2019) Ishii, S., et al. 2019, PASJ, in press
- Jin et al. (2015) Jin, M., Lee, J.-E., & Kim, K.-T., 2015, ApJS, 219, 2
- Kainulainen et al. (2017) Kainulainen, J., Stutz, A. M., Stanke, T. et al. 2017, A&A, 600, 141
- Kama et al. (2013) Kama, M., López-Sepulcre, A., Dominik, C., et al. 2013, A&A, 556, 57
- Kama et al. (2015) Kama, M., Caux, E., López-Sepulcre, A., et al. 2015, A&A, 574, 107
- Kim et al. (2008) Kim, M. K., Hirota, T., Honma, M. et al. 2008, PASJ, 60, 991
- Krumholz et al. (2014) Krumholz, M., R., Bate, M. R., et al. 2015, A&A, 574, 107
- Kusune et al. (2018) Kusune, T., Nakamura, F., Sugitani, K. et al. 2018, submitted to PASJ
- Li & Nakamura (2006) Li, Z.-Y., & Nakamura, F., 2006, ApJ, 640, 187
- Loison et al. (2014) Loison, J.-C., Wakelam, V., Hickson, K. M., 2014, MNRAS, 443, 398
- Lombardi et al. (2014) Lombardi, M., Bouy, H., Alves, J., & Lada, C. J., 2014, A&A, 568, 1
- López-Sepulcre et al. (2013) López-Sepulcre, A., Taquet, V., Sánchez-Monge, ., et al. 2013, A&A, 556, 62
- Marka et al. (2012) Marka, C., Schreyer, K., Launhardt, R., Semenov, D. A., Henning, Th. 2012, A&A, 537, 4
- McKee (1989) McKee, C. F. 1989, ApJ, 345, 782
- McKee & Ostriker (2007) McKee, C. F. & Ostriker, E. C., 2007, ARA&A, 45, 56
- Menten et al. (2007) Menten, K. M., Reid, M. J., Forbrich, J., Brunthaler, A., 2007, A&A, 474, 515
- Minamidani et al. (2016) Minamidani et al. 2016, Proc. SPIE, 9914, 99141Z
- Myers (2009) Myers, P. C. 2009, ApJ, 700, 1609
- Nakamura & Li (2007) Nakamura, F. & Li, Z.-Y., 2007, ApJ, 662, 395
- Nakamura & Li (2014) Nakamura, F. & Li, Z.-Y., 2014, ApJ, 783, 115
- Nakamura et al. (2012) Nakamura, F., Miura, T., Kitamura, Y., et al., 2012, ApJ, 746, 25
- Nakamura et al. (2019) Nakamura, F., et al., 2019, PASJ, in press
- Osorio et al. (2017) Osorio, M., Diaz-Rodriguez, A. K., Anglada, G., et al. 2017, ApJ, 840, 36
- Pagani et al. (2009) Pagani, L., Daniel, F., & Dubernet, M.-L. 2009, A&A, 494, 719
- Punanova et al. (2016) Punanova, A., Caselli, P., Pon, A., et al. A&A, 587, 118
- Reipurth et al. (1999) Reipurth, B., Rodriguez, L., F., & Chini, R. AJ, 118, 983
- Sandell & Knee (2001) Sandell, G., Knee, L. B. G. 2001, ApJ, 546, 49
- Sawada et al. (2008) Sawada, T., Ikeda, N., Sunada, K., et al. 2008, PASJ, 60, 445
- Schilke et al. (1992) Schilke, P., Walmsley, C. M., Pineau des Forets, G., et al., 1992, A&A, 256, 595
- Shimajiri et al. (2008) Shimajiri, Y., Takahashi, S., Takakuwa, S., et al. 2008, ApJ, 683, 255
- Shimajiri et al. (2011) Shimajiri, Y., Kawabe, R., Takakuwa, S., et al. 2011, PASJ, 63, 105
- Shimajiri et al. (2014) Shimajiri, Y., Kitamura, Y., Saito, M., et al. 2014, A&A, 564, A68
- Shimajiri et al. (2015a) Shimajiri, Y., Kitamura, Y., Nakamura, F., et al. 2015, ApJS, 217, 7
- Shimajiri et al. (2015b) Shimajiri, Y., Sakai, T., Kitamura, Y. et al. 2015, ApJS, 221, 31
- Shimoikura et al. (2018) Shimoikura, T., Dobashi, K., Nakamura, F., Matsumoto, T., Hirota, T. 2018, ApJ, in press (arXiv:1802.00589)
- Shimoikura et al. (2019) Shimoikura, T., Dobashi, K., Nakamura, F., Shimajiri, Y., & Sugitani, K. 2019, PASJ, in press
- Shimoikura et al. (2019) Shimoikura, T., Dobashi, K., Hirose, A., Nakamura, F. Shimajiri, Y., & Sugitani, K. 2019b, PASJ, in press
- Sugitani & Ogura (1994) Sugitani, K. & Ogura, K. 1994, ApJS, 92, 163
- Sugitani et al. (2019) Sugitani, K. et al. 2019, PASJ, in press
- Suzuki et al. (1992) Suzuki, H., Yamamoto, S., Ohishi, M. et al. 1992, ApJ, 392, 551
- Tafalla & Hacar (2015) Tafalla, M. & Hacar, A., A&A, 574, 104
- Talbi et al. (1996) Talbi, D., Ellinger, Y., & Herbst, E. 1996, A&A, 314, 688
- Takahashi et al. (2008) Takahashi, S., Saito, M, Ohashi, N., et al. 2008, ApJ, 688, 344
- Tanaka et al. (2013) Tanaka, T., Nakamura, F., Awazu, Y., et al. 2013, ApJ, 778, 34
- Tatematsu et al. (2008) Tatematsu, K., Kandori, R., Umemoto, T., Murata, Y., Sekimoto, Y. 2008, PASJ, 60, 407
- Tatematsu et al. (2014) Tatematsu, K., Ohashi, S., Umemoto, T., et al. 2014, PASJ, 66, 16
- Tennekes et al. (2006) Tennekes, P. P., Harju, J., Juvela, M., Tóth, L. V., 2006, A&A, 456, 1037
- Wang et al. (2010) Wang, P., Li, Z.-Y., Abel, T., & Nakamura, F. 2010, ApJ, 709, 27
- Williams et al. (2003) Williams, J. P., Plambeck, R. L., & Heyer, M. H. 2003, ApJ, 591, 1025
- Wu et al. (2005) Wu, Y., Zhang, Q., Chen, H., Yang, C., Wei, Y., & Ho, P. T. P. 2005, AJ, 129, 330
- Yokogawa et al. (2003) Yokogawa, S., Kitamura, Y., Momose, M., & Kawabe, R. 2003, ApJ, 595, 266