Constraining Radio Mode Feedback in Galaxy Clusters with the Cluster Radio AGN Properties to z1
Abstract
We study the properties of the Sydney University Molonglo Sky Survey (SUMSS) 843 MHz radio AGN population in galaxy clusters from two large catalogs created using the Dark Energy Survey (DES): 11,800 optically selected RM-Y3 and 1,000 X-ray selected MARD-Y3 clusters. We show that cluster radio loud AGN are highly concentrated around cluster centers to . We measure the halo occupation number for cluster radio AGN above a threshold luminosity, finding that the number of radio AGN per cluster increases with cluster halo mass as () for the RM-Y3 (MARD-Y3) sample. Together, these results indicate that radio mode feedback is favoured in more massive galaxy clusters. Using optical counterparts for these sources, we demonstrate weak redshift evolution in the host broad band colors and the radio luminosity at fixed host galaxy stellar mass. We use the redshift evolution in radio luminosity to break the degeneracy between density and luminosity evolution scenarios in the redshift trend of the radio AGN luminosity function (LF). The LF exhibits a redshift trend of the form in density and luminosity, respectively, of and in the RM-Y3 sample, and and in MARD-Y3. We discuss the physical drivers of radio mode feedback in cluster AGN, and we use the cluster radio galaxy LF to estimate the average radio-mode feedback energy as a function of cluster mass and redshift and compare it to the core () X-ray radiative losses for clusters at .
keywords:
galaxies: clusters: general; galaxies: active; galaxies: luminosity function, mass function; submillimeter: galaxies; cosmology: observations1 Introduction
A number of studies of low redshift clusters have shown that local instabilities due to active galactic nuclei (AGN) outbursts reheat the intracluster medium (ICM) and regulate the cooling in the cluster centre through radio-mode AGN feedback (e.g. McNamara et al., 2005; Rafferty et al., 2006; Blanton et al., 2010; Ogrean et al., 2010; Ehlert et al., 2011; Bîrzan et al., 2012; Gitti et al., 2012; Bharadwaj et al., 2014; Voit et al., 2015; Gaspari et al., 2020). There is some evidence of the evolution of AGN feedback in massive field galaxies up to (Simpson et al., 2013), suggesting that the balance between radiative cooling and AGN feedback was achieved in the early universe. However, the evolution of AGN feedback in galaxy clusters with redshift and mass is not well studied. Hlavacek-Larrondo et al. (2013) studied X-ray AGN emission in brightest cluster galaxies (BCGs) up to =0.6, showing that the typical nuclear AGN X-ray luminosity increases by a factor of 10, mostly due to an increase in the fraction of BCGs hosting X-ray AGN between and . Bîrzan et al. (2017) studied 21 Sunyaev-Zel’dovich Effect (SZE; Sunyaev & Zel’dovich, 1972) selected clusters with and found higher radio luminosity as compared to X-ray luminosity at higher redshifts (), presumably due to increased merging activity of galaxy clusters that may trigger the radio mode feedback. Yang et al. (2018) compiled an X-ray luminous BCG sample in the redshift ranges and , and contrastingly found no evidence for evolution. These results should however be considered as preliminary, because the BCG sample is simply collected from all publicly available observations of clusters and groups, and so the sample selection is not well understood.
Previous studies of cluster radio sources have either not considered the redshift trends in the cluster radio source properties (e.g. Lin & Mohr, 2007; Lin et al., 2009; Sehgal et al., 2010; Lin et al., 2015) or have shown contrasting trends (e.g. Sommer et al., 2011; Bîrzan et al., 2017; Lin et al., 2017; Gupta et al., 2017, hereafter G17) due to statistical limitations of galaxy cluster samples extending to higher redshift. Moreover, given the relatively featureless shape of the radio galaxy luminosity function (LF, for e.g. G17), it is typically not possible to differentiate a change in number density from a change in the typical AGN luminosity (so-called luminosity evolution). Typically, the reported redshift trends in the properties of cluster radio sources have been presented as either pure density or pure luminosity evolution (e.g. Sommer et al. (2011)).
In this paper, we present the redshift and mass trends of the properties of cluster radio sources. The sources we consider come from the 843 MHz Sydney University Molonglo Sky Survey (SUMSS; Bock et al., 1999; Mauch et al., 2003; Murphy et al., 2007) radio source catalog, and at the distances where we study these sources they correspond to high radio luminosity objects that are dominated by AGN synchrotron emission. We study the cluster radio AGN to measure their spatial distribution in clusters, the halo occupation number (HON) or characteristic number within the cluster virial region, the radio luminosity evolution at fixed stellar mass and the luminosity functions. This study uses a large ensemble of optically and X-ray selected galaxy clusters that have been constructed using the first three years of data from the Dark Energy Survey (DES-Y3; see Abbott et al., 2018, for discussion of the data release) and the ROSAT All Sky Survey 2RXS faint source catalog (RASS; Boller et al., 2016).
Our study primarily employs statistical background subtraction to correct for those radio AGN that are not physically associated with the clusters. However, we also use DES-Y3 survey data to identify the optical counterparts of cluster radio AGN and to directly select those AGN whose redshifts are consistent with the cluster redshifts. This also allows us to perform Spectral Energy Distribution (SED) analyses of these radio source counterparts to obtain constraints on the stellar mass and spectral type of these sources. This information then allows us to probe the relationship between stellar mass and radio luminosity for radio AGN, which provides direct constraints on the redshift evolution of cluster radio AGN. We use this information together with the LF to jointly constrain number density and luminosity evolution for the cluster radio AGN population. With measurements of the radio AGN LF and its dependence on cluster mass and redshift, we then estimate mass and redshift trends in the radio mode feedback and its relationship to the X-ray radiative losses within cluster cores.
The plan of the paper is as follows: In Section 2, we discuss the observations and the data used in this work. We describe the SED analysis and the cross-matching of radio to optical sources in Section 2.4. Section 3 is dedicated to the studies of surface density profiles, luminosity evolution, halo occupation numbers and LFs. Section 4 contains a discussion of the implications of our measured mass and redshift trends for the physical drivers of radio mode feedback and the balance of AGN feedback and X-ray radiative losses in the cluster cores. We summarize our results in Section 5. Throughout this paper we assume a flat CDM cosmology with matter density parameter and Hubble constant = 70 . We take the normalization of the matter power spectrum to be .
2 Data
We study the overdensity of radio point sources toward X-ray and optically selected galaxy clusters selected using RASS and DES-Y3 observations. We focus on high luminosity radio AGN > 23 that are selected from the SUMSS catalog observed at 843 MHz. A part of our analysis is supported through the identification of the optical counterparts of these sources using the DES-Y3 observations (see Section 3.2), but the rest of our results employ statistical background subtraction.
2.1 SUMSS catalog
The Sydney University Molonglo Sky Survey (SUMSS; Bock et al., 1999; Mauch et al., 2003; Murphy et al., 2007) imaged the southern radio sky at 843 MHz with a characteristic angular resolution of using the Molonglo Observatory Synthesis Telescope (MOST, Mills, 1981; Robertson, 1991). The survey was completed in early 2007 and covers 8,100 of sky with and . The catalog contains 210,412 radio sources to a limiting peak brightness of 6 mJy beam-1 at and 10 mJy beam-1 at . At the SUMSS selection frequency, we expect nearly all sources above the flux selection threshold to be synchrotron dominated (de Zotti et al., 2005). The positional uncertainties given in the catalogue are a combination of fitting uncertainties and calibration uncertainties of the MOST and for sources with peak brightness 20 mJy beam-1, the accuracy is in the range 1′′ to 2′′ (see section 5.1 of Murphy et al., 2007). The flux measurements are accurate to within 3 percent. The catalog is complete to 8 mJy at and to 18 mJy at , and we restrict our analysis to these complete subsamples. At the SUMSS frequency, approximately 10 percent of the sources exhibit extent along one axis (Mauch et al., 2003).
2.2 DES-Y3 data
We make use of the DES Y3 GOLD-release multiwalength catalog in its version 2.2, which covers of the southern celestial hemisphere and has about 60 percent overlap ( ) with the SUMSS survey. The GOLD catalog is intended to be the basis for cosmology analyses with the Dark Energy Survey data. The GOLD catalog consists of a validated object catalog with a set of quality control flags and additional auxiliary data such as photometric redshift information based both on neural networks and Bayesian template fitting. Specifically, for each object in the DES catalog we make use of total magnitudes with relative uncertainties (MAG_AUTO from SExtractor; Bertin & Arnouts, 1996) in the grizy bands and DES derived photometric redshifts (DNF_MEAN) alongside further information present in the catalog such as that derived from SPREAD_MODEL, which allows for object star–galaxy classification (Desai et al., 2012), flagging of bad areas or band specific photometric measurement issues (for additional details on the catalogs, see discussion in Morganson et al., 2018; Abbott et al., 2018).
2.3 Galaxy Cluster Catalogs
For this analysis we adopt the RM-Y3 catalog of 19,795 optically selected clusters and the MARD-Y3 catalog of 2,171 X-ray selected clusters. The two cluster samples are described briefly in the following subsections.
2.3.1 Optically selected RM-Y3 catalog
We use optically selected galaxy clusters identified with the red-sequence Matched-filter Probabilistic Percolation algorithm (redMaPPer; Rykoff et al., 2014) from the Dark Energy Survey first three years of data (RM-Y3). As the name suggests, redMaPPer (RM) can be used to identify clusters as over-densities of red-sequence galaxies. Precisely, the algorithm estimates the probability () of a red galaxy to be a cluster member given as
| (1) |
where is a vector that describes the observable properties of a galaxy (e.g., multiple galaxy colors, i-band magnitude, and position), is the density profile of cluster normalized to unity, is the density of background galaxies and the richness () is estimated by summing up the membership probabilities of galaxies in the cluster region satisfying the constraint equation. RM has been shown to provide excellent photometric redshifts as well as richness estimates. For instance, the catalogs have been shown to have high completeness and purity (Rozo & Rykoff, 2014; Rozo et al., 2014a, b) when the RM algorithm is applied to the Sloan Digital Sky Survey (SDSS) Stripe 82 data (Annis et al., 2014), to the eighth SDSS data release (DR8 Aihara et al., 2011) and to the DES-Y1 and science verification (DES-SV) data (Rykoff et al., 2016; Soergel et al., 2016).
The RM-Y3 catalog (Rykoff et al., in prep) adopts a brighter luminosity threshold of 0.4 rather than the minimum scatter luminosity threshold of 0.2 (Rykoff et al., 2012) to get a clean sample of clusters above a richness threshold. The center of the cluster is taken to be the position of the brightest cluster galaxy (BCG). There are 19,795 galaxy clusters with in the redshift range of 0.10.8 with a median redshift of 0.47.
To estimate masses from the measured richnesses, we adopt an externally calibrated –mass relation. As discussed elsewhere (e.g. Capasso et al., 2019b), the –mass relation for SZE (Saro et al., 2015) and X-ray (Capasso et al., 2019b) selected cluster samples differs from that of optically selected RM clusters (McClintock et al., 2019). The SZE analysis relies on SPT derived cluster masses, which have been shown to be consistent with those derived through weak lensing analyses (Dietrich et al., 2019; Stern et al., 2019; Bocquet et al., 2019). The X-ray analysis relies on masses derived through a dynamical analysis whose systematics have been studied with simulations (Mamon et al., 2013) and through cross-comparisons of weak lensing and dynamical masses (Capasso et al., 2019a). One clear difference is that the RM sample analysis relies on stacked weak lensing information, measuring the mean mass within bins of richness and redshift, whereas the other studies mentioned infer the underlying mass-observable relation using scatter in the observable at fixed mass and applying corrections for the Eddington bias. However, the scale of the Eddington bias correction is too small to explain the differences, and thus it may be that the differences are driven by residual contamination in the optically selected RM sample that is not present in the SZE and X-ray selected samples.
Further study is warranted, but because we are employing an optically selected RM sample to study the radio galaxy population, we adopt the McClintock et al. (2019) calibration here when computing cluster masses,
| (2) |
with , and . The pivot richness () and redshift () are given as 40 and 0.35, respectively. We further correct from to using a model of the concentration-mass relation (Diemer & Kravtsov, 2015), where and are defined as the masses of the cluster within a sphere where the mean density is 200 times the mean and the critical density of the Universe, respectively.
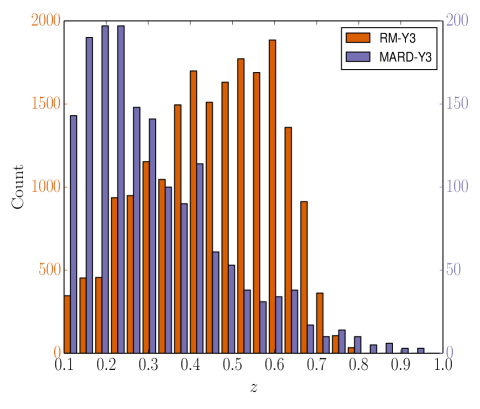
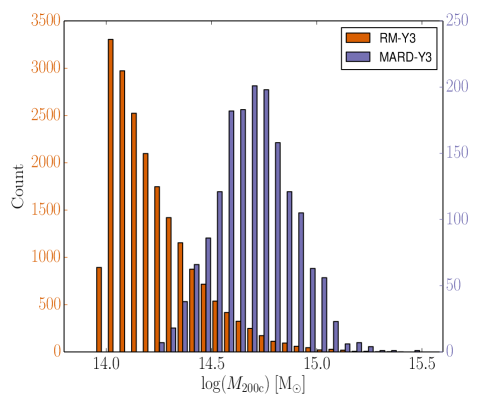
For the RM-Y3 sample, we find that is in the range of to with a median value of . There are 11,800 clusters within in the SUMSS region. Fig. 1 shows the mass and redshift distributions of the clusters.
2.3.2 X-ray selected MARD-Y3 catalog
We use the X-ray selected RASS cluster catalog confirmed and de-contaminated with the multi-component matched filter (MCMF) applied to DES-Y3 data to compare with radio source properties in RM-Y3 clusters. This X-ray selected cluster catalog (MARD-Y3; Klein et al., 2019) contains galaxy clusters confirmed using a multi-component matched filter (Klein et al., 2018, MCMF) follow up in 5,000 deg2 of the DES-Y3 optical data of the sources from the second ROSAT All-Sky Survey source catalog (2RXS) presented in Boller et al. (2016). The MCMF tool is designed for use on large scale imaging surveys such as the DES to do automated confirmation, redshift estimation and suppression of random superpositions of X-ray/ SZE cluster candidates and physically unassociated optical systems. MCMF is used to identify optical counterparts as peaks in galaxy richness as a function of redshift along the line of sight toward each 2RXS source within a search region informed by an X-ray prior. All peaks are assigned a probability of being a random superposition and is extracted from the galaxy richness distributions along large numbers of random lines of sight. In this work, we present radio properties using a catalog with containing 2,171 galaxy clusters. The catalog covers a redshift range of with more than 100 clusters at , and it has residual contamination of 9.6 percent.
The X-ray luminosity of clusters in the catalog is estimated from the source count rate in the 0.1-2.4 keV band within a aperture radius around each 2RXS source. This simplified luminosity has been shown to be simply related to , the luminosity within a radius within which the mean density is 500 times the critical density of the universe at the assumed cluster redshift (Klein et al., 2019). The mass in the catalog is derived using the estimated luminosity at that redshift and an –mass scaling relation from the analysis of Bulbul et al. (2019), which uses SZE based mass constraints from the cosmological analysis of the SPT-SZ cluster sample (de Haan et al., 2016) together with deep XMM-Newton observations of a subset of those clusters to consistently derive multiple observable to mass relations. These SPT-SZ masses have since been shown to be consistent with weak lensing (Dietrich et al., 2019; Stern et al., 2019; Bocquet et al., 2019) and dynamical masses (Capasso et al., 2019a). The scaling relation has the following form
| (3) |
Here, , and are the parameters with best fit values of erg s-1, 1.91 and , respectively (Bulbul et al., 2019, table 5 solution II for ). The pivot mass and redshift are and 0.45, respectively. The function which gives the ratio between the Hubble parameter and its present-day value, and is defined as the mass of the cluster within a sphere where the mean density is 500 times the critical density of the Universe. We account for Eddington bias following the description in Mortonson et al. (2011) and using log-normal scatter in the -mass relation (Bulbul et al., 2019). Further, we correct from to again using a model of the concentration-mass relation (Diemer & Kravtsov, 2015).
The median mass and redshift of the MARD-Y3 sample are and 0.28, respectively, and the distributions are shown in Fig 1. A mass versus redshift plot for the MARD-Y3 sample is presented in Klein et al. (2019, figure 9 grey and black circles). Approximately 1,000 MARD-Y3 clusters between lie within the SUMSS region and are used for this analysis. This sample is significantly smaller than the RM-Y3 sample, however, the unique mass and redshift range as well as the selection of MARD-Y3 sample in X-ray band provides an interesting complement to the RM-Y3 sample.
The cluster centers in the MARD-Y3 catalog are identified from optical data (see section 3.9; Klein et al., 2019) as the position of the rBCG, the brightest galaxy within 1.5 Mpc of the X–ray centroid that has all colors within 3- of red sequence at the redshift of cluster, as long as that position is within 1′ of the peak of the red galaxy distribution of the cluster. If the rBCG is too offset from the red galaxy population, the cluster center is defined to be that of the red galaxy population.
2.4 Optical counterpart identification
Our core analysis focuses on the statistical overdensity of radio AGN toward galaxy clusters to constrain the properties of cluster radio AGN. However, this analysis is complemented by an analysis of a subset of radio AGN whose optical counterparts we have identified in the DES-Y3 dataset. Here we describe the counterpart identification and stellar mass estimation needed to undertake that analysis.
A complete description of the derivation and accuracy of galaxy stellar masses as well as the cross-matching technique used to uniquely associate a DES counterpart to each SUMSS radio source will be provided in a forthcoming work (Pannella et al., in prep.). Here, we briefly summarize the main steps of our procedure: 1) for each radio source above the nominal SUMSS survey completeness limit in radio flux density, we select all DES catalog entries lying within 20′′; 2) the catalog of plausible DES counterparts is trimmed down by applying a cut in i AB magnitudes, and by removing unresolved sources from the catalog by imposing that the EXTEND_CLASS flag is greater than 0, and, finally, by removing all galaxies for which the DES photometric redshift was not constrained.
We derive stellar masses for all the objects in our sample with fastpp111Publicly available at https:// github.com/cschreib/fastpp (a C++ version of the SED fitting code FAST; Kriek et al., 2009) on the total magnitudes. We use Bruzual & Charlot (2003) with delayed exponentially declining star formation histories (SFHs, ) with 0.0110 Gyr, solar metallicities (Z⊙ = 0.02), the Salpeter initial mass function (Salpeter, 1955), and the Calzetti et al. (2000) reddening law with a range of extinction AV up to 4 magnitudes.
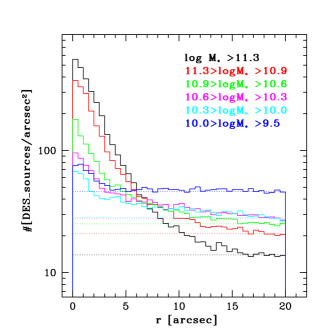
We then examine the surface density on the sky of DES sources as a function of their distance from the SUMSS radio AGN for different bins of stellar mass. This is shown in the left panel of Fig. 2 with solid lines in six different colors, corresponding to different ranges of stellar mass. These surface density profiles exhibit a peak at small separation, which corresponds to actual physical counterparts dropping away to a flat surface density that corresponds to a region dominated by physically unassociated galaxies projected at random near the radio AGN. It is evident that for higher stellar mass the central peak has a higher contrast with respect to the flat background, which is an indication that for these stellar mass ranges a larger fraction of galaxies correspond to physical counterparts of the radio AGN. This is not surprising, because AGN powered radio sources are typically hosted by passive, massive and bulge-dominated galaxies (Best et al., 2007; Lin & Mohr, 2007; Kauffmann et al., 2008; Lin et al., 2010; Best & Heckman, 2012).
By fitting for the level of the flat surface density from random (i.e., non–physical) cross-matches (see dotted lines in the left panel of Fig. 2), we can then estimate for any given matching radius the resulting contamination of the sample. In addition, we can integrate over the portion of the central peak extending beyond the matching radius to estimate the incompleteness within each mass bin for a given matching radius. For the purposes of this analysis, we adopt a simple matching criteria that produces a sample with no more than 15 percent contamination. Practically, this means that we define the cross–matched host for each radio AGN to be the nearest DES galaxy with that has stellar mass in one of the top two bins ( and ), within a maximum offset distance of 10′′ or 6′′, respectively. Within the lower mass bins it is not possible to define a sensible maximum offset distance where the contamination is as low as 15 percent. The estimated completeness of this cross–matched sample is 60 percent.
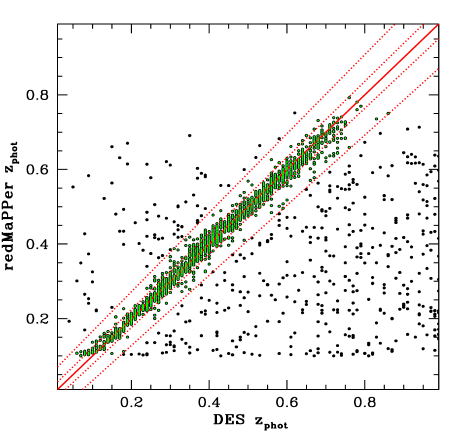
This host identification procedure produces a catalog of 24,998 unique associations of SUMSS detected radio AGN to a DES galaxy host. In this work we specifically concentrate on the 2,264 candidate cluster radio AGN that lie within the radius of a RM-Y3 cluster. Among this latter sub-sample, only 1,643 (73 percent) have photometric redshifts that place them within a cluster (see the right panel of Fig. 2). To assign cluster membership to the radio AGN, we compare the DES photometric redshift (DNF_MEAN) of each source to the redshift of the RM-Y3 cluster. If a source deviates from the cluster redshift by less than 3 times the normalized median absolute deviation (NMAD) ( 0.02), we consider it to be a cluster member and therefore a confirmed cluster radio AGN. We do not carry out separate cross-matching in the MARD-Y3 sample, because the sample is an order of magnitude smaller than the RM-Y3 sample.
3 Cluster radio AGN properties
We present measurements of the radial distribution of AGN around clusters in Section 3.1, and present new constraints on the radio luminosity and color evolution of radio AGN using the sample of matched optical counterparts in Section 3.2. Leveraging these results, we then present the cluster radio AGN luminosity function in Section 3.3 and the halo occupation number in Section 3.4.
3.1 Radial distribution
We study the radial distribution of radio AGN in the cluster region by stacking the flux limited and complete samples of radio AGN overlapping the RM-Y3 and MARD-Y3 samples. To do this we adopt the optical centers for both samples, described in detail in separate references (Rykoff et al., 2014; Klein et al., 2019).
Following G17, we use the projected NFW profile (Navarro et al., 1997; Bartelmann, 1996) as a fitting function for the radial distribution. Here and , where is the concentration parameter and is equivalent to for . The total surface density of the radio AGN () as a function of around the cluster has both cluster and background components () and is written as
| (4) |
and to reduce the covariance between the central amplitude and concentration, we write this in terms of the total number of galaxies in the cluster sample as
| (5) |
where is the solid angle of the annulus or bin and the total number of background subtracted galaxies for . We fit our stacked distribution of radio AGN to a model with three parameters: , and (see G17, ). We stack radio AGN out to to allow for a good constraint on the effective background density . We refer to as the effective background density, because our stacks are constructed using sources down to the flux limit of the SUMSS survey, and as described in Section 2.1 this flux limit has two different values, depending on the declination of the cluster.
In the fit we employ the Cash (1979) statistic
| (6) |
where is the total number of galaxies from the model as in equation (5) and is the total number of galaxies in the observed data in the angular bin. We use the Markov Chain Monte Carlo (MCMC) code, emcee (a Python implementation of an affine invariant ensemble sampler; Foreman-Mackey et al., 2013) to fit the model to the data throughout this work. In the fitting we adopt a bin size corresponding to and fit over the region extending to . The concentration parameter is sampled in space during the fit and the profile is centrally concentrated with and for the RM-Y3 and MARD-Y3 cluster samples, respectively.
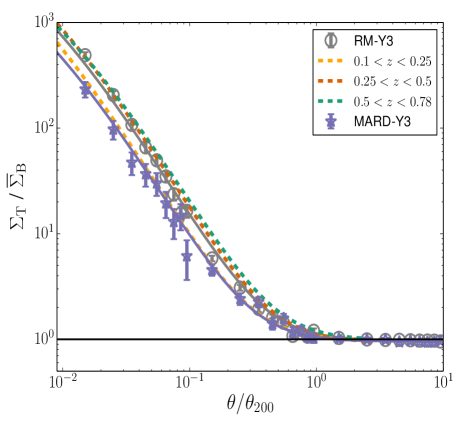
We use this model of the radial distribution of radio AGN in the next section to correct the projected LF to the LF within the cluster virial region defined by (following Lin et al., 2004). We measure the surface density profiles by dividing RM-Y3 and MARD-Y3 catalogs in three redshift bins and see a clear tendency for higher concentration at lower redshifts in both catalogs. The best fit NFW parameters are presented in Table 1. We use the flux limited sample rather than a luminosity limited sample for this measurement because of the larger number of available systems. This does not affect the trends in concentration seen here.
We test the reliability of trends in concentration for mis-centring in the RM-Y3 sample. We select clusters for which the probability that each of the alternate cluster centres is the correct centre (Rykoff et al., 2014). We find that this sub-sample of clusters show similar concentration trends with , and for low to high redshift bin in Table 1.
High central concentrations of radio sources in galaxy clusters have been observed in previous studies. Lin & Mohr (2007) studied radial distribution of cluster radio AGN observed at 1.4 GHz with W Hz-1 in a sample of X-ray selected galaxy clusters with , finding . G17 studied radial profiles of cluster radio AGN at 150 GHz in the Meta-Catalog of X-ray detected Clusters of galaxies (MCXC) with median and found . The results presented here indicate that centrally concentrated cluster radio AGN are present over a broad range of cluster mass and out to redshift .
In Fig. 3 we show the best fit surface density profiles and data. To create these plots we combine many bins to reduce the noise in the measured radial profiles. Following G17, we normalize the vertical axes of this plot with the mean number density of background sources (). Fig. 3 shows that is a good estimation of the background number density of the clusters, as / is consistent with 1 outside the cluster.
| Cluster sample | [] | ||
|---|---|---|---|
| RM-Y3 (all) | |||
| MARD-Y3 (all) | |||
3.2 Host properties of the cross–matched sample
In the RM-Y3 cluster sample there are 1,643 cluster radio AGN with identified optical counterparts. This cross–matched sample has an estimated contamination of 15 percent and an estimated completeness of 60 percent (see Section 2.4). Of the 11,800 RM-Y3 clusters lying within the SUMSS region, 1,579 (13 percent) host at least one confirmed cluster radio AGN associated with the cluster by its redshift. The vast majority of these (95 percent) contain a single cluster radio AGN, 87 contain two radio AGN, one cluster contains three and one other contains four radio AGN all consistent with their cluster redshift. Finally, 1,044 (63 percent) of the total sample of 1,643 cross–matched AGN are projected to lie within , consistent with the centrally concentrated radial profile for the statistically defined complete sample in Section 3.1.
In the subsections below we describe the radio power to stellar mass relation of this sample (Section 3.2.1) and then examine the typical broad band colors as a function of redshift (Section 3.2.2).
3.2.1 Radio luminosity evolution at fixed host mass
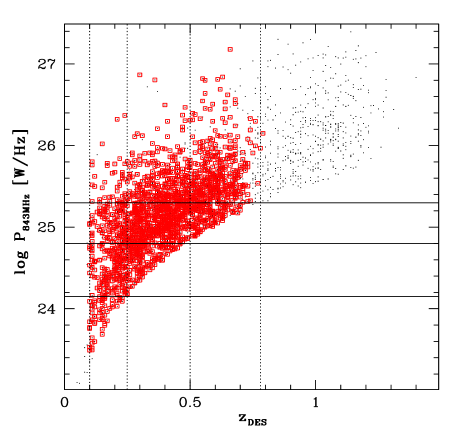
To constrain the evolution of the radio luminosity with redshift at fixed stellar mass, we use the ensemble of SUMSS sources with DES-Y3 counterparts. In particular, we take the high luminosity sample of radio sources with in the whole redshift range of DES-Y3 RM clusters, corresponding to 510 cluster radio AGN. This choice of luminosity cut is justified in Fig. 4, where we show the relation between the 843 MHz luminosity and the redshift of radio AGN. Above this luminosity cut, we have a sample of sources that can be studied over the full redshift range of our cluster samples, whereas if we were to push to lower radio luminosities we would only expect to find those sources in our flux limited sample over a narrower range of lower redshifts.
We fit a power law relation of the following form to constrain a relation between 843 MHz radio power (, calculated using the redshift of each radio source) and the stellar mass () of radio sources obtained from the SED fitting analysis described in Section 2.4
| (7) |
where and are the median stellar mass and redshift of the subsample. The best fit parameters are , and . Along with these parameters we also vary the log normal scatter in radio luminosity at fixed stellar mass in the relation, finding a best fit value .
These results make it clear that, unlike X-ray AGN, cluster high power radio AGN exhibit no correlation () between their radio luminosity and their stellar mass (which is a predictor of the underlying supermassive black hole mass) at all redshifts probed by our sample. This characteristic of radio mode feedback has previously been noted (Best et al., 2007; Lin & Mohr, 2007).
The relation has a scatter of , and the population we are studying exhibits a weak trend for the radio luminosity at fixed stellar mass to increase with redshift . Along with this weak luminosity evolution with redshift, it has been noted that the mechanical feedback in comparison to the radio luminosity is also approximately constant with redshift to (Hlavacek-Larrondo et al., 2012). This provides an indication that individual radio galaxies are only moderately more radio luminous at high redshift and that the feedback events driving radio emission and radio mode feedback are not changing dramatically with redshift. We will use this new constraint on cluster radio AGN evolution to disentangle density evolution and luminosity evolution in the cluster radio AGN luminosity function in Section 3.3.
3.2.2 SED evolution
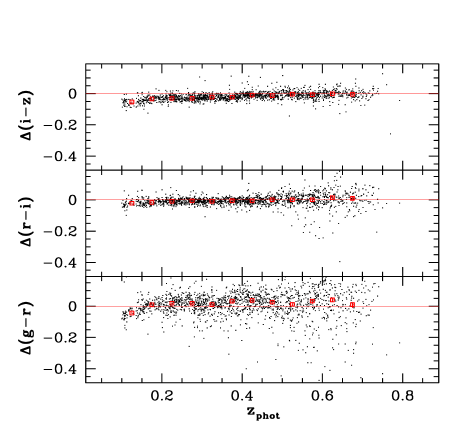
Broad band colors constrain the SED of the cluster radio AGN hosts and provide insights into the presence of ongoing star formation or optical AGN emission. In Fig. 5 we plot the broad band color offsets of the radio AGN hosts from the mean red sequence (RS) color as a function of redshift. The RS colors are defined using a sample of 103 clusters with spectroscopic redshifts studied within DES as part of the calibration of an optical counterpart and redshift estimation code called MCMF (Klein et al., 2018, 2019). Because the RS color model makes use of single object fitting (SOF) magnitudes present in the DES catalog (see Klein et al. 2019 and references therein for more details), for this purpose we use the SOF magnitudes for the SUMSS source counterparts.
It is apparent that the hosts of radio AGN tend to have integrated colors very close to the RS at all redshifts. This is consistent with the established picture that radio AGN are mostly hosted in massive galaxies with very little or no ongoing star formation over the explored redshift range.
The redshift evolution of observed colors does not suggest any clear change in the stellar population properties of the host galaxies over time. When comparing rest-frame properties, e.g., the - at z0.4 and the - at z0.7— both approximately tracing the rest-frame - color— one finds only a weak (-0.03 mag) signature for color evolution that is very likely driven by the intrinsic uncertainties and scatter of the RS model itself. The notably higher scatter in - beyond and in - beyond , while reflecting both higher measurement uncertainties and that these bands are tracing rest frame portions of the SED that are most sensitive to recent star formation, could be an indication that a minority population of “bluer" hosts are actually entering the cross-matched sample.
In summary, our analysis does not suggest any major shift happening as a function of redshift in the stellar population properties of the radio loud AGN host galaxies out to . This places limits on the suggested transition in the cluster radio AGN from a Low Excitation Radio Galaxy (LERG) dominated to a High Excitation Radio Galaxy (HERG) dominated population (Bîrzan et al., 2017). A direct classification as HERG or LERG would require spectra, which are currently not available for significant numbers of the AGN hosts we study here.
| RM-Y3 | |||
| MARD-Y3 | |||
3.3 Luminosity function
We construct radio LFs by counting the excess of radio AGN toward RM-Y3 and MARD-Y3 galaxy clusters to study their evolution to . In addition, we construct the LF from the cross–matched sample for the purpose of cross-comparison with the LF of the complete sample. In all cases we apply the redshift dependent -correction with a spectral index of -0.7 to estimate the luminosity at the same rest frame frequency for all redshifts.
In the following subsections we describe the LF construction in detail (Sections 3.3.1 and 3.3.2), present the modeling (Section 3.3.3) and best fit parameters (Section 3.3.4), compare the LF of the complete sample with that of the cross–matched sample (Section 3.3.5) and then finally discuss how our results compare to those from previous studies (Section 3.3.6).
3.3.1 Statistical LF construction
This adopted method to construct cluster galaxy LFs using statistical background subtraction is described in detail in previous works (Lin et al., 2004; Lin & Mohr, 2007, G17). Briefly, we adopt the cluster redshift to estimate the radio source luminosities for individual sources that lie within an angular distance of the cluster center. We combine the point sources lying within of all clusters in logarithmic luminosity bins. This then produces a combination of the luminosity function of the true cluster radio AGN together with the contamination from foreground or background radio AGN that are randomly superposed on the cluster. We then build a model of the contamination using the extracted for the full SUMSS population, cycling through the cluster list using the cluster redshift to transform from radio source flux density to luminosity and scaling by the associated solid angle of the virial region for each cluster. For the reasons discussed in G17, we then subtract the contamination model and divide the resulting LFs by the sum of the virial masses of the clusters that contribute to each of the luminosity bins. In doing this we are normalizing the LF in units of , which is a convenient proxy for volume in the case of collapsed objects like clusters and groups. In Section 3.4 we study the halo occupation number or HON of radio AGN using the LF redshift evolution derived here and show that the number of radio galaxies scales approximately linearly with the cluster halo mass.
For the RM-Y3 catalog there are 3601 (1449, 2152) total (background, background subtracted) radio AGN observed above the previously discussed flux limits. In the MARD-Y3 case the corresponding numbers are 910 (455, 455). The total number of AGN in the RM-Y3 cluster sample allow us to estimate the incompleteness in the cross–matched sample, and this indicates that the percent completeness estimated from the surface density profiles for our matching criteria is reasonably accurate (see Section 2.4).
We validate our LF construction code and our method by analyzing simulated samples that are 10 times the size of our radio source catalogs and that are created using the best fit LFs reported in Table 2 (for density evolution). We recover the input parameters to within the statistical uncertainties.
3.3.2 Construction of LF for cross–matched sample
Although the cross–matched sample is estimated to be only percent complete and to have contamination of 15 percent, we nevertheless construct the LF to allow for comparison to the statistically derived LF. For this purpose, we use the subset of SUMSS sources with identified optical counterparts whose redshifts and sky locations place them within a RM-Y3 cluster (as noted earlier, we do not do cross–matching for the radio AGN in the much smaller MARD-Y3 cluster sample). In this case we adopt the cluster redshift for all SUMSS sources from that cluster, convert from flux to luminosity and build up a vector in logarithmic luminosity space that contains the sum of all identified sources. We divide this vector by the sum of the virial masses of all the clusters that could have contributed to each luminosity bin (whether they actually contain a radio AGN or not), using the minimum luminosity probed by the cluster given the SUMSS flux limit and the cluster redshift.
This method is attractive in that there is no need to subtract off contamination from randomly superposed radio AGN. This reduces the Poisson noise in the final LF and is helpful in better defining the behavior of the rare, most luminous radio AGN. However, given the incompleteness and contamination in the cross–matched sample, we do not expect perfect agreement with the estimates of the LF extracted statistically using the method described in the previous section. Comparisons are presented in Section 3.3.5 below.
3.3.3 LF modeling
We fit our LFs using the functional form from Condon et al. (2002), given as
| (8) |
where the parameters , and , control the shape of the LF and is its amplitude.
Assuming that the overall shape of the LFs remains constant, the only changes can be in the density and luminosity of the sources (Machalski & Godlowski, 2000). The density evolution corresponds to a vertical shift in the LFs and can be quantified as
| (9) |
similarly, the luminosity evolution corresponds to a horizontal shift in the LFs because of the evolving luminosities of the sources
| (10) |
where corresponds to the median redshift of the RM-Y3 cluster sample and for comparison we take the same for the MARD-Y3 cluster sample. and correspond to the power law index for density and luminosity evolution, respectively, of the LFs.
We again perform an MCMC analysis with the Cash statistic to fit the LFs. Following G17, we fit for the AGN part of the LF, fix the values of the two shape parameters and to those determined in Condon et al. (2002) and vary and along with the density or luminosity evolution power law index. As reported in a previous study using X-ray selected clusters (G17), we find consistent results when and are fixed to either Condon et al. (2002) or Best & Heckman (2012) best fit values. We evaluate the likelihood of a given model by scaling the LF model with the total cluster mass contributing to each luminosity bin and then adding the statistically determined background number of galaxies to the corresponding luminosity bin.
We correct our LF amplitudes by scaling them with a deprojection factor () that accounts for the cylindrical to spherical projection bias of radio AGN. This correction is very small because the radio AGN in clusters have a high NFW concentration; we find .
3.3.4 Best fit LF parameters and uncertainties
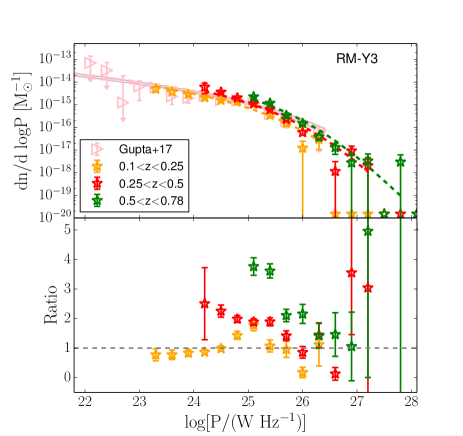
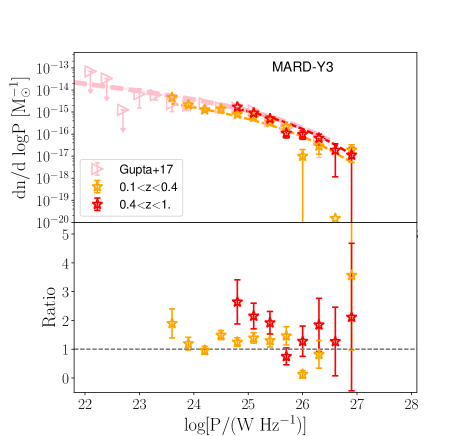
LFs for the full sample constructed statistically (Section 3.3.1) are shown in the upper panels of Fig. 6 for RM- Y3 (left) and MARD-Y3 (right) catalogs. We choose all sources to construct the LF with a flux limit at the 100 percent completeness of the SUMSS catalog as described in Section 2.1. In this figure, we plot the background subtracted observed counts in larger luminosity bins and in three redshift bins. However, this figure does not represent the fitting method, where the observed counts are divided into much finer luminosity bins and in 15 redshift bins (with similar numbers of clusters in each bin) to get the model parameters. We also show the best fit model and model uncertainties from G17 in pink, where the median redshift of that sample is .
The bottom panels of Fig. 6 show the ratios of the measured LFs for both cluster samples and at different redshift bins to the best fit model in the lowest redshift bin in this work. It is visually apparent that the optically selected RM-Y3 and X-ray selected MARD-Y3 samples provide similar radio AGN LFs over this redshift range. Because the MARD-Y3 cluster sample is smaller, we show only two redshift ranges.
In the lower panels one can see some evidence of a change in LF shape with increasing redshift. For instance, there is a larger increase in the LF amplitude at lower luminosities but for luminosity , no evolution with redshift is evident. We have not attempted independent fits within each redshift range where all parameters are free to vary, simply because of the limited sizes of our AGN samples. However, with future samples it should be possible to further examine whether there is more evolution at lower radio power than at higher.
Table 2 contains the best fit parameters for the LFs for the scenarios where either pure density evolution or pure luminosity evolution is taken into account. As expected, we find that the measured LFs alone are insufficient to simultaneously constrain density and luminosity evolution in the MCMC analysis.
The parameter uncertainties shown in Table 2 are marginalized over uncertainties in the -mass relation when RM-Y3 catalog is used and the -mass relation when the MARD-Y3 sample is used. As an example, we marginalize over the uncertainties in the -mass relation described in Section 2.3.1 by first measuring the luminosity functions under single parameter excursions of 2- for the -mass parameters , and . We then extract the derivatives of the LF parameters , and with respect to each of the -mass parameters and finally propagate the uncertainties in the -mass relation to the luminosity function parameters using Gaussian error propagation, further assuming no parameter covariance in the -mass relation parameters. This is a good approximation as there are negligible degeneracies between the parameters of the -mass relation (McClintock et al., 2019). We find that the contributions to the LF parameter uncertainties from the remaining uncertainties in the -mass relation are smaller than the statistical or sample size contributions to the uncertainties. Nevertheless, we present overall combined constraints (including the systematics from uncertainties in -mass) in Table 2.
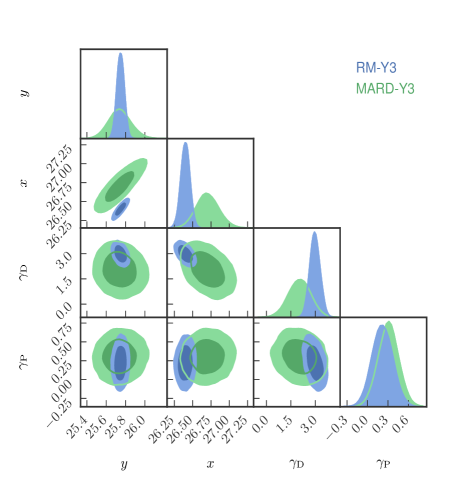
We also use the constraints on the radio luminosity evolution with redshift at fixed stellar mass (Section 3.2.1), to simultaneously constrain density and luminosity evolution. These results are shown in the third set of results for each sample in Table 2. Adopting the best fit value and uncertainty in as a prior on the luminosity evolution, we estimate joint parameter constraints on luminosity and density evolution parameters of the LF. Fig. 7 shows the 2-D marginalized 1- MCMC constraints for luminosity function parameters and it reveals the significant parameter covariance between the shape and amplitude parameters and , which is boosting the fully marginalized uncertainties on each parameter.
There is a statistically significant shift in the joint space of shape and amplitude parameters between the RM-Y3 and MARD-Y3 samples. This shift is apparent as a 2 offset in the fully marginalized posterior of the shape parameter in Table 2. We expect that this difference is driven by a steeper fall–off of the RM-Y3 sample at highest radio powers, which then drives corresponding changes in the amplitude due to the correlation between the shape and amplitude parameters. The MARD-Y3 sample is smaller, and the highest luminosity portion of the LF with is more poorly probed than in the RM-Y3 sample, and for that reason we restrict the fit for the smaller sample to lower power AGN. Thus, the portion of the LF causing this apparent difference between the radio AGN LF of these two samples is only probed in one of the two samples. With future, larger X-ray selected samples from eROSITA (Predehl et al., 2010; Merloni et al., 2012) it should be possible to probe these highest luminosity, rarest radio AGN more precisely and better understand any possible differences between X-ray and optically selected cluster samples.
The best fit density evolution parameters for the X-ray and optically selected cluster samples are statistically consistent, but the RM-Y3 sample suggests a more rapid evolution. In the combined density and luminosity evolution models, the density evolution parameter for the MARD-Y3 is and for the optically selected RM-Y3 is . Again, these uncertainties include the underlying uncertainties in the observable mass relations for each cluster sample.
3.3.5 Comparison with the cross–matched sample
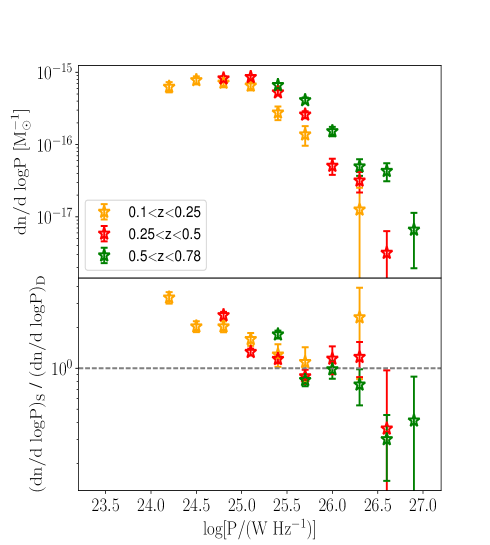
In Fig. 8, we present the 843 MHz LFs (top panel) in different redshift bins, constructed using the sample of optically cross–matched radio AGN as described in Section 3.3.2. We compare these LFs with those produced using statistical background subtraction and for which the sample is complete, as described in Section 3.3.1 and shown in Fig. 6.
On the luminous end, the LFs are in good agreement, but at radio power , the LFs from the cross–matched sample are systematically lower in amplitude than the statistically reconstructed LFs. Given the estimated completeness ( percent) and contamination ( percent) in the cross–matched sample (discussed in Section 2.4), some differences are expected. As described in Section 2.4, only the two most massive sub-classes of galaxies () are used in this cross matching so that the sample contamination can be kept at or below the 15 percent level.
The fact that the LF of the cross–matched sample underestimates the statistical LF mostly at the lowest radio luminosities in each bin may well be an indication of higher contamination and incompleteness in the lowest flux radio bins, where sources have the largest positional uncertainties and are therefore more likely to be cross–matched to the wrong counterpart. Another effect that may be playing a role is that double tail radio sources may be resolved more effectively at lower redshift. Resolving such sources would create two radio sources and increase the chances that both would be cross–matched to the wrong counterpart.
The differences between the LFs calculated using the cross–matched and the complete sample pose challenges for field LF studies with the SUMSS sample where cross-matching is required, but as described in Section 3.3.1 above, for the cluster radio AGN LF one need not use a cross–matched sample.
3.3.6 Comparison of LF redshift trends to previous results
Similar trends with redshift have been seen in previous studies of field radio AGN LFs. LFs of optically selected Quasi- Stellar Objects (QSOs) at showed a luminosity evolution with (Boyle et al., 1988). Machalski & Godlowski (2000) and Brown et al. (2001) studied a sample of 1.4 GHz radio sources at low and intermediate redshifts and suggested a luminosity evolution of and , respectively. In a recent study, Pracy et al. (2016) derived 1.4 GHz LFs for radio AGN separated into LERGs and HERGs. They found that the LERG population displays little or no evolution, while the HERG population evolves more rapidly as or . HERGs have bluer color and a weaker 4000 Å break, which are indications of ongoing star formation activity. LERGs, however, appear to be preferentially located at the centers of groups or clusters and are fueled by feedback from their hot gas haloes (Lin & Mohr, 2007; Kauffmann et al., 2008; Lin et al., 2010; Best & Heckman, 2012). As presented in Section 3.2.2 above, our sample of cross–matched hosts of cluster radio AGN show no significant shifts in color out to , and so presumably the population we are studying with our cluster radio AGN LF is a LERG population.
Smolčić et al. (2009) explored the cosmic evolution of AGN with low radio powers () out to and found pure density evolution and pure luminosity evolution . Strazzullo et al. (2010) carried out a multi-wavelength analysis of Deep Spitzer Wide-area InfraRed Extragalactic Legacy Surveys’ Very Large Array field (SWIRE VLA) and found and for AGN and starforming populations, respectively. Similarly, McAlpine et al. (2013) studied pure density and luminosity evolution for a combined dataset of 900 VLA observed galaxies in the field, finding and for AGN and star forming galaxies, respectively. Janssen et al. (2012) demonstrated that in the local Universe a sub-population of LERGs are hosted in blue star forming galaxies, with these blue LERGs becoming increasingly important at higher radio power. Thus, it is possible that the contribution of such blue LERGs increases towards higher redshifts, rendering the initial assumption that all AGN are hosted by red passive galaxies invalid. Smolčić et al. (2017) studied a COSMOS sample of radio AGN at 3 GHz out to and constrained pure density evolution and pure luminosity evolution .
Also for clusters, Green et al. (2016) have shown that at least 14 percent of BCGs show a significant color offset from passivity in a population of 980 X-ray detected clusters (). In their table 2 and figure 16, they show the offset to passivity as a function of X-ray luminosity of host clusters, and they find larger fractions of galaxies with offset from passivity in high luminosity clusters, which in their sample are preferentially at higher redshift. For samples of X-ray and optically selected galaxy clusters, Sommer et al. (2011), show and , respectively using 1.4 GHz detected radio AGN from the FIRST survey in a redshift range of 0.1 to 0.3. They also find a steep pure density evolution with for an X-ray selected sample of galaxy clusters. In a recent work, Bîrzan et al. (2017) investigated AGN feedback in a large sample of SZE selected clusters from SPT and ACT surveys and found times more SUMSS sources in clusters than in the sample, which they suggest may be due to the differences in the feedback mechanisms onto the super massive black holes (SMBHs) in the low and high luminosity sources. In another recent work, Lin et al. (2017) constructed the radio LFs for 1.4 GHz sources in clusters out to and found an over-abundance of radio AGN in clusters compared to the field population (see also Lin & Mohr, 2007; Best et al., 2007). They find that cluster galaxies at are about 1.5 to 2 times more likely to be active in the radio compared to those in lower redshift clusters. In comparison to these previous studies, the current work is based on a large cluster sample that allows us to push to higher redshifts and more importantly we present a first analysis to constrain both density and luminosity evolution of LFs simultaneously.
3.4 Halo occupation number (HON)
We define the halo occupation number (HON) as the average number of background subtracted radio AGN per cluster with . We estimate the HON in a stack of RM-Y3 and MARD-Y3 clusters in various mass bins to study the mass trends for observed cluster radio sources. We account for the redshift trends estimated for combined density and luminosity evolution in the previous section and solve for the mass trends with the pivot redshift .
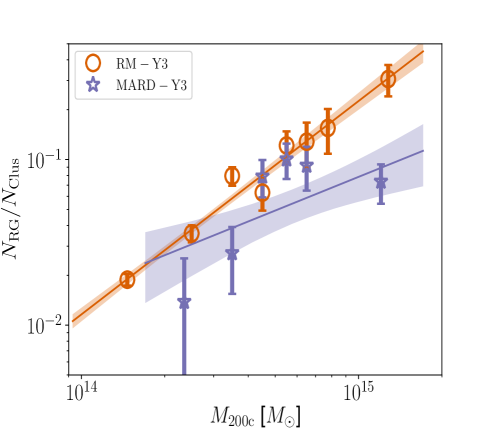
Fig. 9 shows the HON of radio sources in RM-Y3 and MARD-Y3 clusters, where we also show the best fit power law of the form
| (11) |
where describes the average number of radio AGN in a cluster with and and are the normalization and mass trend of the power law best constrained to and , respectively for RM-Y3 sample. For the MARD-Y3 sample, we find and , which is consistent with the mass trend (at 1.5) for the RM-Y3 sample, but also only 2 away from . The two datasets together suggest a trend . In fitting the relation, we adopt the mean mass of the clusters within each mass bin, and we have adopted the best fit density evolution presented for the combined density and luminosity evolution model in Table 2 for each cluster sample.
In Fig. 9, we show the data points in finer mass bins for the RM-Y3 sample and broader mass bins for the MARD- Y3 sample along with best fit model and 1- model uncertainties as the shaded region around the models. The HON for the MARD-Y3 sample tends to lie below that of the RM-Y3 sample, but it is the number of radio AGN in the highest mass bin that most strongly suggests differences between the samples. We have examined this and see that if we choose a higher luminosity cut the uncertainties increase but the two samples also show more similar behavior. The two mass trends are statistically consistent, suggesting a mass trend . This motivates our choice of normalizing the LFs by the mass of the galaxy clusters. Such a scaling has been suggested before (Lin & Mohr, 2007), but never with such a large sample of clusters where the sample alone could demonstrate that the probability of a cluster containing a radio AGN above a threshold luminosity scales roughly linearly with the cluster halo mass. We discuss this result further within the context of our other measurements in the following section.
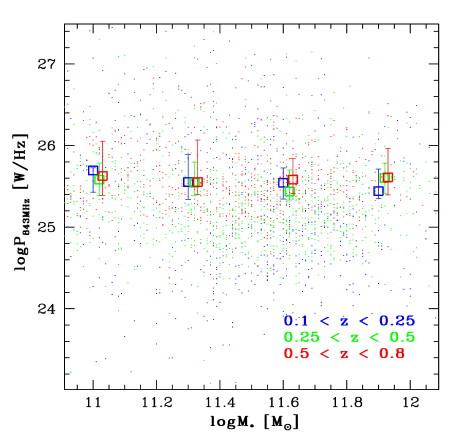
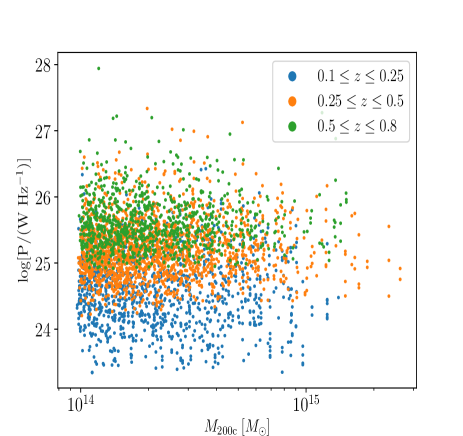
We have further examined whether there is a trend in radio AGN luminosity as a function of cluster mass. In Fig. 10 we plot the radio AGN sample separated into three different redshift ranges in the space of radio luminosity versus cluster halo mass. The data provide no clear evidence for a cluster halo mass dependence of the radio AGN luminosity. Thus, the approximately linear cluster halo mass dependence of the HON of radio AGN with (see Fig. 9) cannot be explained by radio AGN being more luminous in higher mass clusters.
4 Discussion
In this section we use the measurements of the cluster radio AGN properties and their evolution to presented in the previous section to discuss environmental influences on radio AGN and also to examine the radio mode feedback as a function of mass and redshift within galaxy clusters.
4.1 Environmental influences on radio AGN
We discuss the key results of our study within the context of past studies and then turn to possible scenarios that could explain the trends in the cluster radio AGN we have presented.
4.1.1 Cluster Radio AGN Properties in Context
The mass trend in the radio AGN HON presented in Section 3.4 ( for RM-Y3 and for MARD-Y3) is similar to that reported for cluster galaxies as a whole. In an analysis of the near-infrared (NIR) K-band properties of galaxies within 93 galaxy clusters and groups using data from the Two Micron All Sky Survey (2MASS), Lin et al. (2004) reported a mass trend parameter , indicating that in high mass galaxy clusters there are fewer galaxies per unit mass as compared to low mass clusters. This trend is seen to remain largely unchanged to in a sample of SPT SZE selected galaxy clusters (Hennig et al., 2017). The number of radio AGN per unit cluster mass, on the other hand, increases strongly with redshift for both of the samples studied here ( and for RM-Y3 and MARD-Y3, respectively).
The HON mass scaling and normalization taken together with the centrally concentrated radial distribution presented in Section 3.1, provides a picture of a cluster radio AGN population within a cluster that is dominated by a single, radio luminous AGN lying in or near the cluster core. These galaxies are preferentially giant, passive ellipticals, and their probability of being radio loud increases with their stellar mass (Lin & Mohr, 2007; Best et al., 2007). In Fig. 9 we can see that, as a population, these galaxies exhibit a 10 percent probability of exceeding our adopted, nominal radio luminosity of if they lie in a cluster at . The fact that the probability of exceeding this threshold luminosity increases with cluster mass suggests a relationship between the conditions required for radio mode feedback and the cluster halo mass.
One could argue that given the number of potential galaxy hosts for a radio loud AGN scales approximately with cluster mass (; Lin et al., 2004), it may simply be that the probability of a radio AGN scales approximately with the number of potential hosts. However, given that the radio AGN lie preferentially in centrally located giant ellipticals (e.g., the BCG), this argument is not fully satisfying. There is only one BCG in each cluster, regardless of the cluster mass. Post-merger scenarios where there are multiple, similar mass BCG candidates that are on their way to merging through the action of dynamical friction occur both in low and high mass clusters and would therefore not seem to explain the cluster halo mass trend we observe.
It has been previously shown that the most massive BCGs lie in the most massive galaxy clusters, although the mass trend is very weak as (Lin & Mohr, 2004, note that these BCG stellar masses do not include the intracluster light), (Zhang et al., 2016) and (Kravtsov et al., 2018). The halo mass trend in the HON is much steeper, suggesting that either (1) the galaxy mass dependence of a galaxy being radio loud is extremely steep, e.g., with , which would be inconsistent with the findings in Von Der Linden et al. (2007, figure 8) and Lin et al. (2017, figure 16), or (2) that the radio AGN HON mass trend is not driven by the mass of the central galaxy alone.
The redshift trend in the HON and the density evolution of the LF provides another interesting clue to environmental influences on radio AGN. The host galaxy described above in a cluster at with a 10 percent chance of hosting a radio AGN that exceeds our adopted radio luminosity threshold would have a corresponding probability of 25 percent at (equation 11). Because we know that the HON of the full galaxy population within the cluster virial region does not evolve with redshift (or evolves very weakly) to (Hennig et al., 2017) and we know that BCG mass growth is rather slow over this redshift range (1.8 to 1.2 times mass increase from to the present; e.g,. Lidman et al., 2012; Burke et al., 2015), it would be difficult to argue that the radio AGN population trends we are seeing are related to either galaxy number or galaxy host mass. A strong possibility is that there is an environmentally driven effect that is connected to the cluster halo mass and that is more efficient at higher redshift.
Another important clue is that the typical radio luminosity at fixed host stellar mass increases only modestly with redshift as (Section 3.2.1). This suggests that the radio mode events at high and low redshift are similar (see also Galametz et al., 2009; Hlavacek-Larrondo et al., 2012, and references therein), but that they are simply more frequent within cluster halos at higher redshift. Moreover, our samples provides no evidence that radio AGN luminosity depends on the cluster halo mass.
4.1.2 Confining Pressure of the ICM
Of course, the cooling gas from the ICM could affect the radio activity. The radio-loud fraction increases for BCGs closest to the peak in the ICM emission. This suggests that the availability of a fuel supply of cooling gas from the halo environment impacts or enhances AGN activity in the most massive galaxies (e.g. Stott et al., 2012). The emission lines from BCGs (principally H) indicate the presence of a strong cooling cluster core that has been shown to generally host more powerful radio sources. For BCGs in line emitting clusters, the X-ray cavity power correlates with both the extended and core radio emission, suggestive of steady fueling of the AGN in these clusters (Hogan et al., 2015). However, there is no clear mass or redshift dependence of the fraction of clusters with cool cores (Semler et al., 2012; McDonald et al., 2013), so it seems unlikely that central cooling of the ICM is responsible for the strong cluster halo mass and redshift trends that we observe in the cluster radio AGN population.
In a recent work, Lin et al. (2018) studied a sample of 2300 radio AGN at to investigate the likely sources of AGN activity in massive galaxies. They found that for triggering the radio emission, both the stellar mass and the dark matter halo mass play an important role in both central and satellite galaxies. On the other hand, they found no convincing evidence linking the elevated radio activity in massive halos to the higher galaxy density therein. They also found that ICM entropy, cooling time and pressure are playing roles in triggering radio mode feedback. Their working hypothesis is that stellar mass loss from evolved stars is the source of the material accreted, and that the ICM pressure plays a role in confining that fuel within the host galaxy, making it more likely to be accreted.
This scenario is interesting within the context of our results, because the ICM pressure increases strongly with cluster mass and redshift. Moreover, central galaxies would be preferred because the ram pressure stripping by the ICM of the stellar mass lost from evolved stars would be much lower or even absent in central giant ellipticals that have small peculiar velocities. Recent ICM studies of cluster samples spanning a similar redshift range to that of our radio AGN study have examined ICM mass fraction, ICM temperature, X-ray luminosity and an integrated ICM pressure (e.g. Chiu et al., 2016, 2018; Bulbul et al., 2019, and references therein). In these studies the ICM mass fraction is observed to increase with cluster mass and, at a fixed mass, to remain roughly constant with redshift. The ICM density profiles outside the central core regions have been shown to evolve approximately self-similarly with redshift (McDonald et al., 2013). ICM temperature increases with cluster mass and evolves with redshift roughly self-similarly, implying higher ICM temperatures at higher redshift for a cluster of a given mass. Taken together, these results imply a confining pressure around the central giant elliptical that scales with mass as and with redshift as . Without a model that connects the confining pressure to the radio mode feedback it is not possible to comment on whether these similarly strong mass and redshift dependences in central confining pressure and the probability of a centrally located giant elliptical being radio loud are pure coincidence or indicative of a physical link.
4.1.3 Mergers of Infalling Gas Rich Galaxies with BCG
Another possible scenario that appears to be consistent with the observations would be the interaction or merger of an infalling galaxy that has residual star formation with a central, giant elliptical. Such an infalling galaxy would have to be on an approximately radial orbit, and so such events would be expected to be rare. But the population of potential gas rich, infalling galaxies would scale roughly as the mass of the cluster and would also increase with redshift. Specifically, clusters with have blue fractions that are approximately constant as a function of cluster mass, but the blue fractions increase with cluster redshift from 20 percent at to 50 percent at (Hennig et al., 2017). Thus, the number of potential merging, gas rich, infalling galaxies increases with the cluster virial mass and also increases with redshift, providing a potential explanation for the trends we report here in the cluster radio AGN.
Studies of BCG growth and the stellar mass–size relation for quiescent galaxies over this same redshift range have suggested that the dominant mode of growth for central giant ellipticals is through merging with low mass galaxies (Burke et al., 2015). Another study of BCGs in 14 galaxy clusters between and indicates that 3 of the 14 BCGs are likely to experience a major merger within 600 Myr, suggesting that mergers with giant ellipticals are the primary mode for BCG growth; however, the results from this small sample do not exclude the possibility that minor mergers could play an important role in shaping how central giant ellipticals appear today (Lidman et al., 2013). In the process of merging, the gas rich infalling galaxy would deliver its gas to the BCG. Central cluster galaxies are known to have reservoirs of molecular gas that are detected through their CO line emission at low redshifts (e.g. Edge, 2001; McNamara et al., 2014; Temi et al., 2018; Vantyghem et al., 2019; Rose et al., 2019) and at redshifts as high as (Webb et al., 2017). These molecular gas clouds are observed to have line of sight velocities of the order of 200 to 300 , which would support a chaotic cold accretion type model in BCGs (e.g., David et al., 2014; Tremblay et al., 2016). However, stronger evidence that mergers of infalling, gas rich galaxies with central giant ellipticals are responsible for feeding and triggering the AGN accretion that leads eventually to radio mode feedback is needed to build confidence that this is a driver of the cluster AGN mass and redshift trends observed in the current work.
We note here also that ram pressure stripping will remove gas from any infalling, gas rich galaxies, and this low entropy gas will naturally sink toward the cluster center. The supply of this low entropy, sinking gas would increase with cluster mass because there are more infalling, gas rich galaxies in higher mass clusters. Moreover, it would increase with redshift, because cluster galaxy populations within the virial region have higher blue fractions– and therefore higher gas content– at higher redshift (e.g., Hennig et al., 2017). As with the previous scenario of merging, this scenario deserves further study.
4.2 Radio AGN feedback
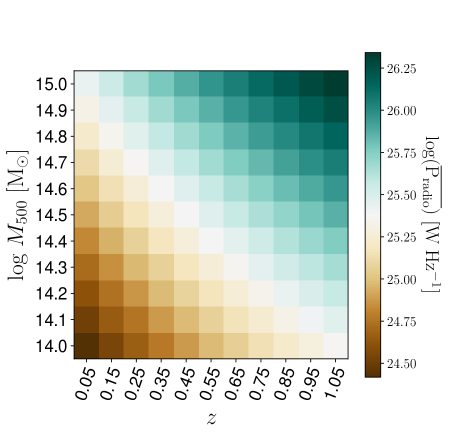
To make an estimate of the radio mode feedback from AGN in clusters, we first calculate the mean total cluster radio AGN power using our measured LF extracted from the analysis of the RM-Y3 cluster sample (the case with a combination of luminosity and number density evolution presented in Table 2). We multiply the LF at a given redshift with the mass of the cluster of interest and integrate the product of the radio power and the LF in the radio power range of to to get the expected average radio power at the rest frame frequency of 843 MHz. This range of power is selected, because it is comparable to the minimum and maximum radio powers of the radio AGN observed in our sample of clusters. Moreover, this radio power lower limit is close to that marking the transition from a star forming dominated to an AGN dominated radio LF.
In Fig. 11, we show the mean total radio power (in colorbar) as a function of cluster mass and redshift. There are roughly two orders of magnitude in dynamic range of the mean radio power over the mass and redshift range explored here. The mean radio power is approximately 10 higher for 10 clusters than for 10, consistent with what we would expect given the mass dependence of the halo occupation number (Section 3.4). Moreover, there is a strong redshift dependence that leads to a similar 10 increase in mean radio power for a cluster of a given mass at in comparison to . This behavior follows from the measured redshift trends in the density evolution of the radio LF (Table 2).
Studies of ICM cavities in ensembles of clusters containing radio galaxies (Cavagnolo et al., 2010; Hlavacek-Larrondo et al., 2012; Hlavacek-Larrondo et al., 2015) have demonstrated correlations between the radio power and the amount of work done to create the cavities in the ICM. Thus, to estimate the typical radio mode feedback in clusters as a function of redshift, we use the mean total radio power calculated above together with the correlation between radio power and cavity power from Cavagnolo et al. (2010). Specifically, we take our estimated 843 MHz radio power and convert it to an expected 1.4 GHz radio power using the spectral index at all redshifts. Further, we change units from W to erg s-1 and estimate the total radio luminosity by scaling the estimated radio power by 1.4 GHz. We then use the Cavagnolo et al. (2010) relation to estimate the cavity power
| (12) |
This cavity power represents an estimate of the minimum mechanical feedback into the ICM. We calculate this estimate of the radio mode feedback as a function of mass and redshift as for the mean total radio power before.
The bulk of this radio mode feedback is concentrated in the cluster core ( of the cluster radio AGN in our sample lie within , corresponding to the central 0.1 percent of the cluster virial volume). To place this feedback energy in context, we compare it to the X-ray radiative losses from the core region. Specifically, we measure the core X-ray luminosities within using and ensemble of SZE selected galaxy clusters that have been observed with the XMM-Newton X-ray observatory. This sample of 59 clusters with has been studied extensively in Bulbul et al. (2019), where both core included and core excluded quantities have been presented.
We use the measurements of the core luminosities from that analysis together with mass and redshift measurements for the subset of the galaxy cluster sample where the core region of interest is larger than the XMM-Newton point spread function (PSF). The best fit core () X-ray luminosity to mass relation that we find is
| (13) |
where and are and 0.45, respectively. In addition, we find a log normal intrinsic scatter of in this relation, which is considerably larger than the scatter of the total cluster X-ray luminosity to mass relations presented for the same sample (). This is not surprising, because it has been long established that variations in the structure of cluster cores are the primary driver of the scatter in the X-ray luminosity at fixed temperature (Fabian, 1994; Mohr & Evrard, 1997) or mass.
We note here that this X-ray core luminosity to mass scaling relation is constrained using clusters in the mass range above and over the bulk of the redshift range of interest. In the following analysis we extrapolate this relation to to make estimates over the full mass range where we study the cluster radio AGN LF. Moreover, we emphasize that this is the average central X-ray luminosity within a region that is a fraction of the virial region. It is not the luminosity within a cooling radius where the ICM is estimated to be radiatively unstable. Our goal here is to examine typical radio mode feedback in the cluster core to the typical X-ray radiative losses in the core.
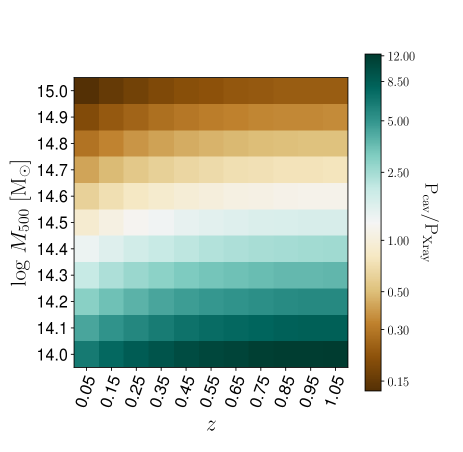
In the right panel of Fig. 11, we show the ratio between the estimated mean radio mode feedback and the mean X-ray radiative losses. We find that the ratio between the radio cavity power and the core X-ray luminosity is correlated with the redshift of the clusters and is anti-correlated with its mass. For instance, the ratio of the radio feedback to X-ray radiative losses for a galaxy cluster is times larger at as compared to the ratio at . On the other hand the ratio is times larger for a galaxy cluster as compare to a cluster with mass .
While these mass and redshift trends are interesting, the absolute value of the ratio suffers from several uncertainties. For example, it could be shifted up or down simply by changing the radius within which we estimate the X-ray radiative losses. Moreover, we have used the estimated from the entire radio AGN population, whereas only percent of that population lies at . Finally, our estimate of the mechanical feedback is derived using the energy required to evacuate the cavities in the ICM observed around a sizeable number of clusters. serves as a kind of lower limit to the actual mechanical feedback, with some authors arguing the total feedback could be a factor of 4 to 16 times higher (e.g., Cavagnolo et al., 2010).
Our current estimates indicate that the average radio mode feedback within clusters is comparable to or smaller than the average central radiative losses within for clusters with at redshifts up to that we probe here. It is within this core region where one can identify cool core structures within the ICM and where it is posited that the feedback from radio AGN may be playing a crucial role in replacing the radiative losses from X-ray emission and preventing a cooling instability or cooling flow (e.g. Fabian, 2012). Thus, in this mass range one might expect it to be more likely for cool core structures to emerge and for there to be no strong redshift trends. Indeed, in SZE selected cluster samples where the selection is unaffected by the presence or absence of cool core structures, it has been demonstrated that there is no significant evolution in the cool core fraction with redshift for clusters with masses (Semler et al., 2012; McDonald et al., 2012).
At lower masses the mean mechanical feedback from radio mode feedback is many times larger than the core radiative cooling, and one might expect it to be less likely for cool core structures to emerge. We note that cool core systems in groups and low mass clusters have been identified in the nearby universe (Panagoulia et al., 2014), but it is not yet clear whether this represents a lower fraction of systems than is observed at higher masses. Moreover, in this low mass range one might expect the excess of feedback energy to increase the entropy within the cluster core and beyond, perhaps even redistributing the ICM mass and leading to a reduction in the ICM mass fraction within the virial region . In other words, the mass trend in the ratio of radio mode feedback and X-ray radiative losses implies a mass dependent ICM mass fraction for clusters over the mass range investigated here. Moreover, this is true over the entire redshift range studied here. In the local universe this trend for lower mass clusters to exhibit lower ICM fractions was first reported for a large cluster ensemble by Mohr et al. (1999) (using emission weighted mean X-ray temperatures as a mass proxy). More recently, this mass trend has been demonstrated in a study from group to cluster mass scales using the HIFLUGCS sample (see figure 2; Main et al., 2017) and in the SPT selected cluster sample, where there is no clear redshift trend over the full redshift range studied here using clusters with masses (Chiu et al., 2016, 2018; Bulbul et al., 2019). Thus, the measured mass and redshift trends in the ICM mass fraction are qualitatively consistent with the expectations, given the measured mass and redshift trends of the ratio of radio mode feedback and X-ray radiative losses.
Thus, the radio LFs for clusters with and extending to redshift that we present here imply significant mean radio mode mechanical feedback that offsets or dominates the mean core X-ray radiative losses for all but the most massive clusters studied here (). If the estimated radio mode feedback underestimates the true radio feedback by a factor of 4 to 16, then at no mass scale would the typical, observed radiative losses within be important. We emphasize that there is significant scatter in the X-ray radiative losses at fixed mass and redshift, and that the radio galaxy population is rare and therefore there is significant stochasticity in the radio mode feedback as well. We use the measured LFs and trends with mass and redshift to examine the stochasticity, finding that the standard deviation in the log of the mean radio luminosity varies from for the clusters at (where radio AGN are most abundant) to for groups at (where radio AGN are least abundant). These variations in both feedback and radiative losses would lead to the emergence of systems where cooling would dominate over feedback and the cool cores we observe could form. Once the cool core starts to form there is evidence of enhanced radio mode feedback, suggesting that the cooling ICM could itself drive new radio mode feedback (Fabian, 2012, see figure 5).
5 Conclusions
We report measurements of the properties of cluster radio AGN to employing the largest cluster ensembles extending to high redshift ever used. These properties of radio AGN include their radial distribution within the cluster, radio luminosity evolution at fixed stellar mass, luminosity functions (LFs) and halo occupation number (HON) above a luminosity threshold. These measurements are made using SUMSS selected sources observed at 843 MHz within optically selected RM-Y3 and X-ray selected MARD-Y3 cluster catalogs that have been produced using the first three years of DES observations and the RASS X-ray survey.
We focus on the excess population of radio sources associated with the virial regions of these clusters. The median redshifts of RM-Y3 and MARD-Y3 clusters are 0.47 and 0.28, respectively, and the catalogs extend to and beyond. The mass of RM-Y3 (Rykoff et al., in prep) and MARD-Y3 (Klein et al., 2019) clusters is estimated using the richness-mass relation from McClintock et al. (2019) and the –mass relation from Bulbul et al. (2019), respectively, where the mass ranges correspond to and , respectively.
We find that the radial profile of the sources in RM-Y3 and MARD-Y3 catalogs is highly concentrated at the center of the cluster over the whole redshift range and is consistent with an NFW model with concentration . With this concentration, approximately of the cluster radio AGN lie within of the cluster centers, which are defined using the cluster galaxies.
A study of the cross–matched hosts of the cluster radio AGN indicates that the AGN radio luminosity at fixed stellar mass is constant or increases only modestly as with redshift. The broad band colors of these hosts are consistent with the cluster red sequence color and remain so without any major changes over the full redshift range (see Section 3.2). We use the luminosity evolution constraint to break the degeneracy in density and luminosity evolution for the cluster radio AGN LF.
We construct the LFs assuming that the overdensity of radio AGN toward a cluster is at the redshift of the cluster, and we correct for the non-cluster sources by employing a statistical background correction (see Section 3.3). We find that at fixed cluster halo mass, the cluster radio galaxies are more numerous at higher redshift. We find best fit redshift trends in combined density and luminosity evolution of and , respectively for the RM-Y3 sample. Evolution is statistically consistent but more gradual for the X-ray selected MARD-Y3 sample: and . The uncertainties on the luminosity function parameters are marginalized over the uncertainties in the cluster observable-mass relations. Our results provide a clear indication that density evolution with redshift dominates over luminosity evolution with redshift in cluster radio AGN populations.
Furthermore, we estimate the halo occupation number for radio AGN above a fixed luminosity threshold in a stack of RM-Y3 and MARD-Y3 clusters using the LF evolution identified above. We show that the number of radio AGN above a luminosity threshold scales with the cluster mass as with for the RM-Y3 sample and with for the MARD-Y3 sample, indicating a relationship between the probability of a cluster containing a radio loud AGN and the cluster halo mass. Furthermore, we show that there is no compelling evidence for a dependence of radio AGN luminosity on cluster halo mass (see Section 3.4).
We use these measurements to inform a discussion of the environmental influences on radio mode feedback (see Section 4.1). We consider two scenarios, one where the confining pressure of the ICM around the central giant ellipticals is responsible for the observed radio feedback mode and another where the merger of infalling, gas rich galaxies with centrally located giant ellipticals could also lead to the mass and redshift trends we measure in the radio AGN population. We note also that even in the absence of merging, gas rich galaxies will lose their gas through ram pressure stripping, and this low entropy gas will sink to the cluster center, potentially providing fuel for radio mode accretion.
We go on in Section 4.2 to use the radio AGN LF to estimate the radio mode feedback as a function of mass and redshift out to and compare that to the mean core X-ray radiative losses from the ICM at each mass and redshift. The radio mode feedback dominates the core radiative losses in low mass systems and is comparable to or smaller than those radiative losses for systems with over the full redshift range. We note the imbalance of radio mode feedback and X-ray radiative losses is qualitatively consistent with what one would expect to explain the absence of redshift evolution of the cool core population and the trend of increasing ICM mass fraction with mass observed within clusters over the same mass and redshift range.
Acknowledgements
We thank Jeremy Sanders for helpful discussions. The Melbourne group acknowledges support from the Australian Research Council’s Discovery Projects scheme (DP150103208). The Munich group acknowledges the support of the International Max Planck Research School on Astrophysics of the Ludwig-Maximilians-Universität, the Max-Planck-Gesellschaft Faculty Fellowship program at the Max Planck Institute for Extraterrestrial Physics, the DFG Cluster of Excellence “Origin and Structure of the Universe”, the Verbundforschung ’D-MeerKAT’ award 05A2017 and the Ludwig-Maximilians-Universität. AS is supported by the ERC-StG ’ClustersXCosmo’ grant agreement 71676, and by the FARE-MIUR grant ’ClustersXEuclid’ R165SBKTMA.
SPT is supported by the National Science Foundation through grant PLR-1248097. Partial support is also provided by the NSF Physics Frontier Center grant PHY-1125897 to the Kavli Institute of Cosmological Physics at the University of Chicago, the Kavli Foundation and the Gordon and Betty Moore Foundation grant GBMF 947. This research used resources of the National Energy Research Scientific Computing Center (NERSC), a DOE Office of Science User Facility supported by the Office of Science of the U.S. Department of Energy under Contract No. DE-AC02-05CH11231.
Funding for the DES Projects has been provided by the U.S. Department of Energy, the U.S. National Science Foundation, the Ministry of Science and Education of Spain, the Science and Technology Facilities Council of the United Kingdom, the Higher Education Funding Council for England, the National Center for Supercomputing Applications at the University of Illinois at Urbana-Champaign, the Kavli Institute of Cosmological Physics at the University of Chicago, the Center for Cosmology and Astro-Particle Physics at the Ohio State University, the Mitchell Institute for Fundamental Physics and Astronomy at Texas A&M University, Financiadora de Estudos e Projetos, Fundação Carlos Chagas Filho de Amparo à Pesquisa do Estado do Rio de Janeiro, Conselho Nacional de Desenvolvimento Científico e Tecnológico and the Ministério da Ciência, Tecnologia e Inovação, the Deutsche Forschungsgemeinschaft and the Collaborating Institutions in the Dark Energy Survey.
The Collaborating Institutions are Argonne National Laboratory, the University of California at Santa Cruz, the University of Cambridge, Centro de Investigaciones Energéticas, Medioambientales y Tecnológicas-Madrid, the University of Chicago, University College London, the DES-Brazil Consortium, the University of Edinburgh, the Eidgenössische Technische Hochschule (ETH) Zürich, Fermi National Accelerator Laboratory, the University of Illinois at Urbana-Champaign, the Institut de Ciències de l’Espai (IEEC/CSIC), the Institut de Física d’Altes Energies, Lawrence Berkeley National Laboratory, the Ludwig-Maximilians Universität München and the associated Excellence Cluster Universe, the University of Michigan, the National Optical Astronomy Observatory, the University of Nottingham, The Ohio State University, the University of Pennsylvania, the University of Portsmouth, SLAC National Accelerator Laboratory, Stanford University, the University of Sussex, Texas A&M University, and the OzDES Membership Consortium.
Based in part on observations at Cerro Tololo Inter-American Observatory, National Optical Astronomy Observatory, which is operated by the Association of Universities for Research in Astronomy (AURA) under a cooperative agreement with the National Science Foundation.
The DES data management system is supported by the National Science Foundation under Grant Numbers AST-1138766 and AST-1536171. The DES participants from Spanish institutions are partially supported by MINECO under grants AYA2015-71825, ESP2015-66861, FPA2015-68048, SEV-2016-0588, SEV-2016-0597, and MDM-2015-0509, some of which include ERDF funds from the European Union. IFAE is partially funded by the CERCA program of the Generalitat de Catalunya. Research leading to these results has received funding from the European Research Council under the European Union’s Seventh Framework Program (FP7/2007-2013) including ERC grant agreements 240672, 291329, and 306478. We acknowledge support from the Brazilian Instituto Nacional de Ciência e Tecnologia (INCT) e-Universe (CNPq grant 465376/2014-2).
This manuscript has been authored by Fermi Research Alliance, LLC under Contract No. DE-AC02-07CH11359 with the U.S. Department of Energy, Office of Science, Office of High Energy Physics. The United States Government retains and the publisher, by accepting the article for publication, acknowledges that the United States Government retains a non-exclusive, paid-up, irrevocable, world-wide license to publish or reproduce the published form of this manuscript, or allow others to do so, for United States Government purposes. This manuscript has been authored by Fermi Research Alliance, LLC under Contract No. DE-AC02-07CH11359 with the U.S. Department of Energy, Office of Science, Office of High Energy Physics. The United States Government retains and the publisher, by accepting the article for publication, acknowledges that the United States Government retains a non-exclusive, paid-up, irrevocable, world-wide license to publish or reproduce the published form of this manuscript, or allow others to do so, for United States Government purposes.
References
- Abbott et al. (2018) Abbott T. M. C., et al., 2018, ApJS, 239, 18
- Aihara et al. (2011) Aihara H., et al., 2011, ApJS, 193, 29
- Annis et al. (2014) Annis J., et al., 2014, ApJ, 794, 120
- Bartelmann (1996) Bartelmann M., 1996, A&A, 313, 697
- Bertin & Arnouts (1996) Bertin E., Arnouts S., 1996, A&AS, 117, 393
- Best & Heckman (2012) Best P. N., Heckman T. M., 2012, MNRAS, 421, 1569
- Best et al. (2007) Best P. N., von der Linden A., Kauffmann G., Heckman T. M., Kaiser C. R., 2007, MNRAS, 379, 894
- Bharadwaj et al. (2014) Bharadwaj V., Reiprich T. H., Schellenberger G., Eckmiller H. J., Mittal R., Israel H., 2014, A&A, 572, A46
- Bîrzan et al. (2012) Bîrzan L., Rafferty D. A., Nulsen P. E. J., McNamara B. R., Röttgering H. J. A., Wise M. W., Mittal R., 2012, MNRAS, 427, 3468
- Bîrzan et al. (2017) Bîrzan L., Rafferty D. A., Brüggen M., Intema H. T., 2017, MNRAS, 471, 1766
- Blanton et al. (2010) Blanton E. L., Clarke T. E., Sarazin C. L., Randall S. W., McNamara B. R., 2010, Proceedings of the National Academy of Science, 107, 7174
- Bock et al. (1999) Bock D. C.-J., Large M. I., Sadler E. M., 1999, AJ, 117, 1578
- Bocquet et al. (2019) Bocquet S., et al., 2019, ApJ, 878, 55
- Boller et al. (2016) Boller T., Freyberg M. J., Trümper J., Haberl F., Voges W., Nandra K., 2016, A&A, 588, A103
- Boyle et al. (1988) Boyle B. J., Shanks T., Peterson B. A., 1988, MNRAS, 235, 935
- Brown et al. (2001) Brown M. J. I., Webster R. L., Boyle B. J., 2001, AJ, 121, 2381
- Bruzual & Charlot (2003) Bruzual G., Charlot S., 2003, MNRAS, 344, 1000
- Bulbul et al. (2019) Bulbul E., et al., 2019, ApJ, 871, 50
- Burke et al. (2015) Burke C., Hilton M., Collins C., 2015, MNRAS, 449, 2353
- Calzetti et al. (2000) Calzetti D., Armus L., Bohlin R. C., Kinney A. L., Koornneef J., Storchi-Bergmann T., 2000, ApJ, 533, 682
- Capasso et al. (2019a) Capasso R., et al., 2019a, MNRAS, 482, 1043
- Capasso et al. (2019b) Capasso R., et al., 2019b, MNRAS, 486, 1594
- Cash (1979) Cash W., 1979, ApJ, 228, 939
- Cavagnolo et al. (2010) Cavagnolo K. W., McNamara B. R., Nulsen P. E. J., Carilli C. L., Jones C., Bîrzan L., 2010, ApJ, 720, 1066
- Chiu et al. (2016) Chiu I., et al., 2016, MNRAS, 455, 258
- Chiu et al. (2018) Chiu I., et al., 2018, MNRAS, 478, 3072
- Condon et al. (2002) Condon J. J., Cotton W. D., Broderick J. J., 2002, AJ, 124, 675
- David et al. (2014) David L. P., et al., 2014, ApJ, 792, 94
- Desai et al. (2012) Desai S., et al., 2012, ApJ, 757, 83
- Diemer & Kravtsov (2015) Diemer B., Kravtsov A. V., 2015, ApJ, 799, 108
- Dietrich et al. (2019) Dietrich J. P., et al., 2019, MNRAS, 483, 2871
- Edge (2001) Edge A. C., 2001, MNRAS, 328, 762
- Ehlert et al. (2011) Ehlert S., et al., 2011, MNRAS, 411, 1641
- Fabian (1994) Fabian A. C., 1994, ARA&A, 32, 277
- Fabian (2012) Fabian A. C., 2012, ARA&A, 50, 455
- Foreman-Mackey et al. (2013) Foreman-Mackey D., Hogg D. W., Lang D., Goodman J., 2013, PASP, 125, 306
- Galametz et al. (2009) Galametz A., et al., 2009, ApJ, 694, 1309
- Gaspari et al. (2020) Gaspari M., Tombesi F., Cappi M., 2020, Nature Astronomy, 4, 10
- Gitti et al. (2012) Gitti M., Brighenti F., McNamara B. R., 2012, Advances in Astronomy, 2012, 950641
- Green et al. (2016) Green T. S., et al., 2016, MNRAS, 461, 560
- Gupta et al. (2017) Gupta N., et al., 2017, MNRAS, 467, 3737
- Hennig et al. (2017) Hennig C., et al., 2017, MNRAS, 467, 4015
- Hlavacek-Larrondo et al. (2012) Hlavacek-Larrondo J., Fabian A. C., Edge A. C., Ebeling H., Sanders J. S., Hogan M. T., Taylor G. B., 2012, MNRAS, 421, 1360
- Hlavacek-Larrondo et al. (2013) Hlavacek-Larrondo J., Fabian A. C., Edge A. C., Ebeling H., Allen S. W., Sanders J. S., Taylor G. B., 2013, MNRAS, 431, 1638
- Hlavacek-Larrondo et al. (2015) Hlavacek-Larrondo J., et al., 2015, ApJ, 805, 35
- Hogan et al. (2015) Hogan M. T., et al., 2015, MNRAS, 453, 1201
- Janssen et al. (2012) Janssen R. M. J., Röttgering H. J. A., Best P. N., Brinchmann J., 2012, A&A, 541, A62
- Kauffmann et al. (2008) Kauffmann G., Heckman T. M., Best P. N., 2008, MNRAS, 384, 953
- Klein et al. (2018) Klein M., et al., 2018, MNRAS, 474, 3324
- Klein et al. (2019) Klein M., et al., 2019, MNRAS, p. 1397
- Kravtsov et al. (2018) Kravtsov A. V., Vikhlinin A. A., Meshcheryakov A. V., 2018, Astronomy Letters, 44, 8
- Kriek et al. (2009) Kriek M., van Dokkum P. G., Labbé I., Franx M., Illingworth G. D., Marchesini D., Quadri R. F., 2009, ApJ, 700, 221
- Lidman et al. (2012) Lidman C., et al., 2012, MNRAS, 427, 550
- Lidman et al. (2013) Lidman C., et al., 2013, MNRAS, 433, 825
- Lin & Mohr (2004) Lin Y.-T., Mohr J. J., 2004, ApJ, 617, 879
- Lin & Mohr (2007) Lin Y.-T., Mohr J. J., 2007, ApJS, 170, 71
- Lin et al. (2004) Lin Y., Mohr J. J., Stanford S. A., 2004, ApJ, 610, 745
- Lin et al. (2009) Lin Y., Partridge B., Pober J. C., Bouchefry K. E., Burke S., Klein J. N., Coish J. W., Huffenberger K. M., 2009, ApJ, 694, 992
- Lin et al. (2010) Lin Y.-T., Shen Y., Strauss M. A., Richards G. T., Lunnan R., 2010, ApJ, 723, 1119
- Lin et al. (2015) Lin H. W., McDonald M., Benson B., Miller E., 2015, ApJ, 802, 34
- Lin et al. (2017) Lin Y.-T., et al., 2017, ApJ, 851, 139
- Lin et al. (2018) Lin Y.-T., Huang H.-J., Chen Y.-C., 2018, AJ, 155, 188
- Machalski & Godlowski (2000) Machalski J., Godlowski W., 2000, A&A, 360, 463
- Main et al. (2017) Main R. A., McNamara B. R., Nulsen P. E. J., Russell H. R., Vantyghem A. N., 2017, MNRAS, 464, 4360
- Mamon et al. (2013) Mamon G. A., Biviano A., Boué G., 2013, MNRAS, 429, 3079
- Mauch et al. (2003) Mauch T., Murphy T., Buttery H. J., Curran J., Hunstead R. W., Piestrzynski B., Robertson J. G., Sadler E. M., 2003, MNRAS, 342, 1117
- McAlpine et al. (2013) McAlpine K., Jarvis M. J., Bonfield D. G., 2013, MNRAS, 436, 1084
- McClintock et al. (2019) McClintock T., et al., 2019, MNRAS, 482, 1352
- McDonald et al. (2012) McDonald M., et al., 2012, Nature, 488, 349
- McDonald et al. (2013) McDonald M., et al., 2013, ApJ, 774, 23
- McNamara et al. (2005) McNamara B. R., Nulsen P. E. J., Wise M. W., Rafferty D. A., Carilli C., Sarazin C. L., Blanton E. L., 2005, Nature, 433, 45
- McNamara et al. (2014) McNamara B. R., et al., 2014, ApJ, 785, 44
- Merloni et al. (2012) Merloni A., et al., 2012, preprint, (arXiv:1209.3114)
- Mills (1981) Mills B. Y., 1981, Proceedings of the Astronomical Society of Australia, 4, 156
- Mohr & Evrard (1997) Mohr J. J., Evrard A. E., 1997, ApJ, 491, 38
- Mohr et al. (1999) Mohr J. J., Mathiesen B., Evrard A. E., 1999, ApJ, 517, 627
- Morganson et al. (2018) Morganson E., et al., 2018, PASP, 130, 074501
- Mortonson et al. (2011) Mortonson M. J., Hu W., Huterer D., 2011, Phys. Rev. D, 83, 023015
- Murphy et al. (2007) Murphy T., Mauch T., Green A., Hunstead R. W., Piestrzynska B., Kels A. P., Sztajer P., 2007, MNRAS, 382, 382
- Navarro et al. (1997) Navarro J. F., Frenk C. S., White S. D. M., 1997, ApJ, 490, 493
- Ogrean et al. (2010) Ogrean G. A., Hatch N. A., Simionescu A., Böhringer H., Brüggen M., Fabian A. C., Werner N., 2010, MNRAS, 406, 354
- Panagoulia et al. (2014) Panagoulia E. K., Fabian A. C., Sanders J. S., 2014, MNRAS, 438, 2341
- Pracy et al. (2016) Pracy M. B., et al., 2016, MNRAS, 460, 2
- Predehl et al. (2010) Predehl P., et al., 2010, in Society of Photo-Optical Instrumentation Engineers (SPIE) Conference Series. (arXiv:1001.2502), doi:10.1117/12.856577
- Rafferty et al. (2006) Rafferty D. A., McNamara B. R., Nulsen P. E. J., Wise M. W., 2006, ApJ, 652, 216
- Robertson (1991) Robertson J. G., 1991, Australian Journal of Physics, 44, 729
- Rose et al. (2019) Rose T., et al., 2019, MNRAS, 485, 229
- Rozo & Rykoff (2014) Rozo E., Rykoff E. S., 2014, ApJ, 783, 80
- Rozo et al. (2014a) Rozo E., Rykoff E. S., Bartlett J. G., Evrard A., 2014a, MNRAS, 438, 49
- Rozo et al. (2014b) Rozo E., Evrard A. E., Rykoff E. S., Bartlett J. G., 2014b, MNRAS, 438, 62
- Rykoff et al. (2012) Rykoff E. S., et al., 2012, ApJ, 746, 178
- Rykoff et al. (2014) Rykoff E. S., et al., 2014, ApJ, 785, 104
- Rykoff et al. (2016) Rykoff E. S., et al., 2016, ApJS, 224, 1
- Salpeter (1955) Salpeter E. E., 1955, ApJ, 121, 161
- Saro et al. (2015) Saro A., et al., 2015, MNRAS, 454, 2305
- Sehgal et al. (2010) Sehgal N., Bode P., Das S., Hernandez-Monteagudo C., Huffenberger K., Lin Y., Ostriker J. P., Trac H., 2010, ApJ, 709, 920
- Semler et al. (2012) Semler D. R., et al., 2012, ApJ, 761, 183
- Simpson et al. (2013) Simpson C., Westoby P., Arumugam V., Ivison R., Hartley W., Almaini O., 2013, MNRAS, 433, 2647
- Smolčić et al. (2009) Smolčić V., et al., 2009, ApJ, 696, 24
- Smolčić et al. (2017) Smolčić V., et al., 2017, A&A, 602, A6
- Soergel et al. (2016) Soergel B., et al., 2016, MNRAS, 461, 3172
- Sommer et al. (2011) Sommer M. W., Basu K., Pacaud F., Bertoldi F., Andernach H., 2011, A&A, 529, A124
- Stern et al. (2019) Stern C., et al., 2019, MNRAS, 485, 69
- Stott et al. (2012) Stott J. P., et al., 2012, MNRAS, 422, 2213
- Strazzullo et al. (2010) Strazzullo V., Pannella M., Owen F. N., Bender R., Morrison G. E., Wang W.-H., Shupe D. L., 2010, ApJ, 714, 1305
- Sunyaev & Zel’dovich (1972) Sunyaev R. A., Zel’dovich Y. B., 1972, Comments on Astrophysics and Space Physics, 4, 173
- Temi et al. (2018) Temi P., Amblard A., Gitti M., Brighenti F., Gaspari M., Mathews W. G., David L., 2018, ApJ, 858, 17
- Tremblay et al. (2016) Tremblay G. R., et al., 2016, Nature, 534, 218
- Vantyghem et al. (2019) Vantyghem A. N., et al., 2019, ApJ, 870, 57
- Voit et al. (2015) Voit G. M., Donahue M., Bryan G. L., McDonald M., 2015, Nature, 519, 203
- Von Der Linden et al. (2007) Von Der Linden A., Best P. N., Kauffmann G., White S. D. M., 2007, MNRAS, 379, 867
- Webb et al. (2017) Webb T. M. A., et al., 2017, ApJ, 844, L17
- Yang et al. (2018) Yang L., Tozzi P., Yu H., Lusso E., Gaspari M., Gilli R., Nardini E., Risaliti G., 2018, ApJ, 859, 65
- Zhang et al. (2016) Zhang Y., et al., 2016, ApJ, 816, 98
- de Haan et al. (2016) de Haan T., et al., 2016, ApJ, 832, 95
- de Zotti et al. (2005) de Zotti G., Ricci R., Mesa D., Silva L., Mazzotta P., Toffolatti L., González-Nuevo J., 2005, A&A, 431, 893
Author Affiliations
1School of Physics, University of Melbourne, Parkville, VIC 3010, Australia
2Faculty of Physics, Ludwig-Maximilians-Universität, Scheinerstr. 1, 81679 Munich, Germany
3Excellence Cluster Origins, Boltzmannstr. 2, 85748 Garching, Germany
4Max Planck Institute for Extraterrestrial Physics, Giessenbachstr. 85748 Garching, Germany
5Kavli Institute for Particle Astrophysics & Cosmology, P. O. Box 2450, Stanford University, Stanford, CA 94305, USA
6SLAC National Accelerator Laboratory, Menlo Park, CA 94025, USA
7Fermi National Accelerator Laboratory, P. O. Box 500, Batavia, IL 60510, USA
8Instituto de Fisica Teorica UAM/CSIC, Universidad Autonoma de Madrid, 28049 Madrid, Spain
9Department of Physics & Astronomy, University College London, Gower Street, London, WC1E 6BT, UK
10Center for Astrophysics Harvard & Smithsonian, 60 Garden Street, Cambridge, MA 02138, USA
11Kavli Institute for Astrophysics and Space Research, Massachusetts Institute of Technology, 77 Massachusetts Avenue, Cambridge, MA 02139
12Centro de Investigaciones Energéticas, Medioambientales y Tecnológicas (CIEMAT), Madrid, Spain
13Laboratório Interinstitucional de e-Astronomia - LIneA, Rua Gal. José Cristino 77, Rio de Janeiro, RJ - 20921-400, Brazil
14Department of Astronomy, University of Illinois at Urbana-Champaign, 1002 W. Green Street, Urbana, IL 61801, USA
15National Center for Supercomputing Applications, 1205 West Clark St., Urbana, IL 61801, USA
16Institut de Física d’Altes Energies (IFAE), The Barcelona Institute of Science and Technology, Campus UAB, 08193 Bellaterra (Barcelona) Spain
17Academia Sinica Institute of Astronomy and Astrophysics, 11F of AS/NTU Astronomy-Mathematics Building, No.1, Sec. 4, Roosevelt Rd, Taipei 10617, Taiwan
18Observatório Nacional, Rua Gal. José Cristino 77, Rio de Janeiro, RJ - 20921-400, Brazil
19Department of Physics, IIT Hyderabad, Kandi, Telangana 502285, India
20Santa Cruz Institute for Particle Physics, Santa Cruz, CA 95064, USA
21Department of Astronomy, University of Michigan, Ann Arbor, MI 48109, USA
22Department of Physics, University of Michigan, Ann Arbor, MI 48109, USA
23Institut d’Estudis Espacials de Catalunya (IEEC), 08034 Barcelona, Spain
24Institute of Space Sciences (ICE, CSIC), Campus UAB, Carrer de Can Magrans, s/n, 08193 Barcelona, Spain
25Department of Physics, Stanford University, 382 Via Pueblo Mall, Stanford, CA 94305, USA
26Department of Physics, The Ohio State University, Columbus, OH 43210, USA
27Australian Astronomical Optics, Macquarie University, North Ryde, NSW 2113, Australia
28The Research School of Astronomy and Astrophysics, Australian National University, ACT 2601, Australia
29Departamento de Física Matemática, Instituto de Física, Universidade de São Paulo, CP 66318, São Paulo, SP, 05314-970, Brazil
30George P. and Cynthia Woods Mitchell Institute for Fundamental Physics and Astronomy, and Department of Physics and Astronomy, Texas A&M University, College Station, TX 77843, USA
31Institució Catalana de Recerca i Estudis Avançats, E-08010 Barcelona, Spain
32Department of Astrophysical Sciences, Princeton University, Peyton Hall, Princeton, NJ 08544, USA
33Instituto de Física, UFRGS, Caixa Postal 15051, Porto Alegre, RS - 91501-970, Brazil
34INAF-Osservatorio Astronomico di Trieste, via Tiepolo 11, I-34143 Trieste, Italy
35IFPU - Institute for Fundamental Physics of the Universe, Via Beirut 2, 34014 Trieste, Italy
36INAF-Osservatorio Astronomico di Trieste, via G. B. Tiepolo 11, I-34143 Trieste, Italy
37School of Physics and Astronomy, University of Southampton, Southampton, SO17 1BJ, UK
38Department of Physics, Lancaster University, Lancaster, LA1 4YB, UK
39Computer Science and Mathematics Division, Oak Ridge National Laboratory, Oak Ridge, TN 37831
40Argonne National Laboratory, 9700 South Cass Avenue, Lemont, IL 60439, USA
41Cerro Tololo Inter-American Observatory, Casilla 603, La Serena, Chile