Dragonfly imaging of the galaxy NGC 5907: a different view of the iconic stellar stream
Abstract
In 2008 it was reported that the stellar stream of the edge-on spiral NGC 5907 loops twice around the galaxy, enveloping it in a giant corkscrew-like structure. Here we present imaging of this iconic object with the Dragonfly Telephoto Array, reaching a surface brightness level of mag arcsec-2 on spatial scales of (the approximate width of the stream). We find a qualitatively different morphology from that reported in the 2008 study. The Dragonfly data do not show two loops but a single curved stream with a total length of (220 kpc). The surface brightness of the stream ranges from mag arcsec-2 to mag arcsec-2, and it extends significantly beyond the region where tidal features had previously been detected. We find a density enhancement near the luminosity-weighted midpoint of the stream which we identify as the likely remnant of a nearly-disrupted progenitor galaxy. A restricted N-body simulation provides a qualitative match to the detected features. In terms of its spatial extent and stellar mass the stream is similar to Sagittarius, and our results demonstrate the efficacy of low surface brightness-optimized telescopes for obtaining maps of such large streams outside the Local Group. The census of these rare, relatively high mass events complements the census of common, low mass ones that is provided by studies of streams in the Milky Way halo.
1. Introduction
Stellar streams, the debris of tidally-disrupted globular clusters or galaxies, provide information on the frequency of the accretion of small objects onto larger ones (see, e.g., Bullock & Johnston 2005). As their morphologies reflect their orbits they are also probes of the gravitational potential, and they have been used as a tool to constrain the mass and structure of dark matter halos (Moore et al. 1999; Ibata et al. 2002; Helmi 2004; Law & Majewski 2010; Bovy, Erkal, & Sanders 2017; Bonaca & Hogg 2018).
In the Milky Way dozens of stellar streams have been identified (see Grillmair & Carlin 2016; Shipp et al. 2018), with Sagittarius (Ibata et al. 1997), Palomar 5 (Odenkirchen et al. 2001), Monoceros (Newberg et al. 2002), and the “orphan stream” (Belokurov et al. 2007) among the most prominent examples. The number of confirmed and candidate streams is increasing rapidly, thanks to the increased contrast attainable with Gaia and deep star count maps (see, e.g., Malhan, Ibata, & Martin 2018; Bonaca et al. 2019). Likewise, M31 is home to many tidally-disrupting satellite objects, ranging from low mass “stretched” objects such as Andromeda XIX (McConnachie et al. 2008) to the major event, or events, that were responsible for shaping the complex structure of the M31 halo (D’Souza & Bell 2018, and references therein).
At distances Mpc streams can be identified by the smooth integrated light of their stellar populations (e.g., Arp 1966; Malin & Hadley 1997; Mihos et al. 2005; van Dokkum 2005; Bell et al. 2006; Martínez-Delgado et al. 2010; Atkinson, Abraham, & Ferguson 2013). Such integrated-light measurements typically do not reach the same stellar density limits as star count surveys but probe a much greater volume of the Universe (see Danieli, van Dokkum, & Conroy 2018, for a quantitative discussion). The combination of studies of frequent, low mass accretion events in the Local Group with systematic integrated-light surveys of rare, high mass events around other galaxies should ultimately provide a complete census of present-day accretion-driven galaxy growth.
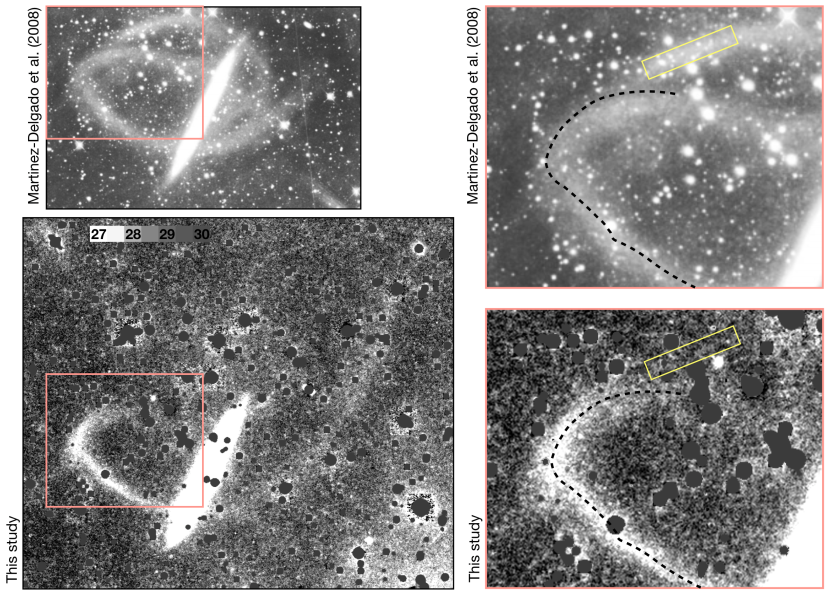
One of the best-known tidal features outside of the Local Group is the stellar stream associated with NGC 5907, an edge-on spiral galaxy with a stellar mass of M⊙ (Laine et al. 2016) at a distance of 17 Mpc (Tully, Courtois, & Sorce 2016). The stream was discovered by Shang et al. (1998) and Zheng et al. (1999), who detected sections of a loop around the disk of NGC 5907 using the Beijing Astronomical Observatory 0.6/0.9 m Schmidt telescope. This was a remarkable discovery, as previous deep optical and Hi searches had not uncovered any tidal features associated with NGC 5907 (see Sancisi 1976; Sasaki 1987; Sackett et al. 1994). The galaxy was subsequently imaged by Martínez-Delgado et al. (2008) [hereafter M08], using a 0.5 m Ritchey-Chrétien telescope. M08 report that the stream exhibits not one but two complete loops, enveloping NGC 5907 in a giant corkscrew-like structure. Their evocative image, whose main features could be reproduced with an N-body model, has taken on an iconic status, serving as a powerful demonstration of the shredding of a small galaxy.111We note that Wang et al. (2012) interpret the M08 data as evidence of a major merger. Some years later NGC 5907 was also observed by Laine et al. (2016), who combined data from the Spitzer Space Telescope with optical Subaru images. These authors studied the part of the stream that was detected by Shang et al. (1998) and do not comment on the second loop that was reported by M08.
Here we report on new low surface brightness imaging of NGC 5907 over a wide field, as part of an imaging campaign of nearby galaxies with the Dragonfly Telephoto Array (Abraham & van Dokkum 2014). We are conducting two surveys, the Dragonfly Nearby Galaxies Survey (Merritt et al. 2016) and the Dragonfly Edge-on Galaxies Survey (C. Gilhuly et al., in preparation); NGC 5907 was one of the first targets of the edge-on survey.
2. Data
2.1. Observations and reduction
The observations were obtained with the Dragonfly Telephoto Array, a low surface brightness-optimized telescope consisting of 48 Canon 400 mm f/2.8 II telephoto lenses. Its basic design is described in Abraham & van Dokkum (2014), Merritt et al. (2016), and Zhang et al. (2018). The current 48-lens array is described in S. Danieli et al., in preparation. Briefly, each lens is coupled to an SBIG STT-8300M camera offering a instantaneous field of view with native pixels and a FWHM spatial resolution of . The lenses are intentionally offset from one another by % of the field of view, giving 48 independent sightlines. Data are taken with large () dithers between exposures, providing further redundancy. As the data are sky-limited in our 600 s integrations the telescope behaves optically like a 1.0 m f/0.4 refractor with superb optical surfaces and near-perfect baffling. Twenty-four lenses are equipped with SDSS filters and 24 with SDSS filters.
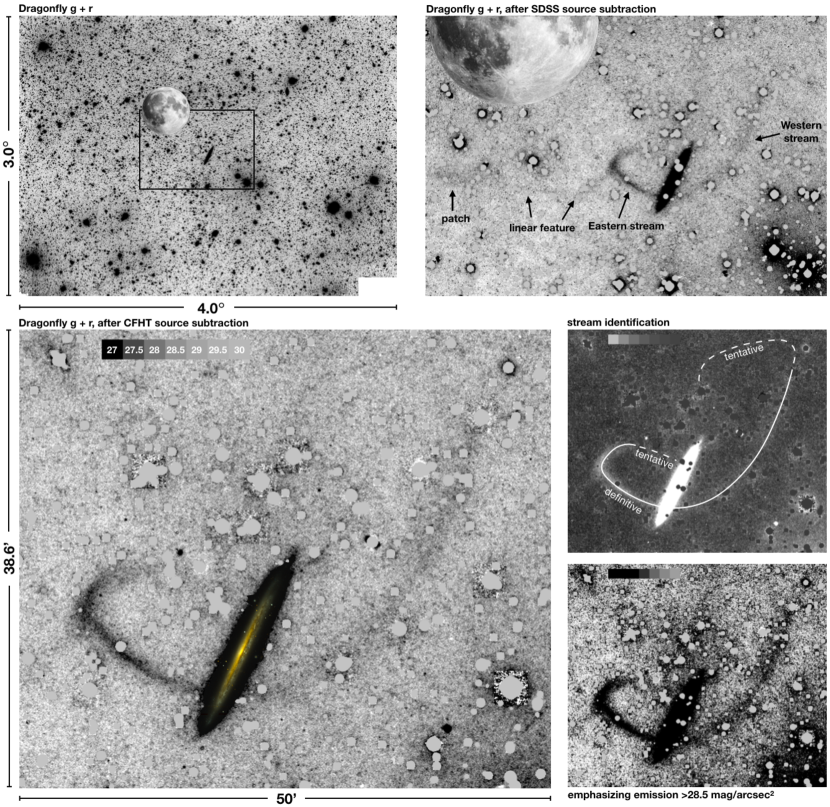
The data reduction is gate-based, executing multiple quality tests on each frame as it progresses through the pipeline. The background modeling is done in two stages. After the first stage a mask is generated containing all detected emission in the co-added image. This is used in the second stage to mask all emission sources from the individual raw frames prior to fitting the background with a two-dimensional 3d-order polynomial. In this step variation on scales exceeding is removed; features that are smaller in at least one dimension (such as the stellar stream, which has a width of ) remain unaffected. The pipeline is described in detail in Jielai Zhang’s PhD thesis222https://jielaizhang.github.io/files/Zhang_Jielai_201811_PhD_Thesis_excludech4.pdf and in S. Danieli et al., in preparation. The total number of frames that went into the final NGC 5907 stacks is 618 in and 762 in ; this is the equivalent of 4.8 hr with the full 48 lens array. The summed image is shown in the top left of Fig. 1; owing to the dithering it covers 12 degree2, with reduced effective exposure time near the edges of the field.
2.2. Multi-resolution filtering
The Dragonfly data have excellent low surface brightness sensitivity and are essentially free of ghosts, reflections, and other artifacts. However, they suffer from crowding due to the relatively low spatial resolution. We subtracted compact emission sources from the data using multi-resolution filtering (MRF). Details are given in P. van Dokkum et al., in preparation. Briefly, a flux model is created by multiplying an image of higher resolution (such as archival CFHT data) by a SExtractor (Bertin & Arnouts 1996) object map of that image. Any detected low surface brightness features in the high resolution data can be removed from the model at this stage. The model is then convolved with a kernel to match the Dragonfly resolution and subtracted. Remaining halos around bright stars are removed following a similar process as described in van Dokkum, Abraham, & Merritt (2014). The PSF is modeled in a box; this is generally sufficient but we note that the very brightest stars have detected light at larger radii in the residual image.
The results are shown in Fig. 1. For the image at top right the high resolution model was created from SDSS and images. These are shallow but have few artifacts and enable a wide field subtraction. The images in the bottom panels were filtered using a combination of Canada France Hawaii Telescope (CFHT) and Beijing-Arizona All Sky Survey (BASS; Zou et al. 2018) imaging. The BASS data are only used to identify and remove artifacts and missing data in the CFHT images. We carefully checked that no low surface brightness emission is contained in the high resolution model. The only low surface brightness object that we removed from the model is a previously-uncataloged dwarf galaxy.
3. Observational Results
3.1. Morphology and photometry of the stream
The Dragonfly images show a relatively straightforward stream morphology. We confirm the existence of the strongly curved Eastern stream that was discovered by Shang et al. (1998) (see top right panel of Fig. 1). We find that the stream continues on the West side of NGC 5907 at lower surface brightness. This Western stream reaches more than twice the length of the Eastern stream. This stream morphology is qualitatively different from the double loop structure reported by M08; we return to this in § 5. We also detect a thin feature extending from the brightest part of the stream to the East and a faint patch about due East of NGC 5907. These faint features are not artifacts and are seen in both and ; their nature is unclear. Finally, we tentatively detect continuations of the stream at both ends: there may be a thin extension of the Western stream toward the Northeast, looping back South toward the disk, and there is a likely continuation of the Eastern stream toward the disk. Both these extensions are labeled “tentative” in Fig. 1, and they are not included in our analysis.
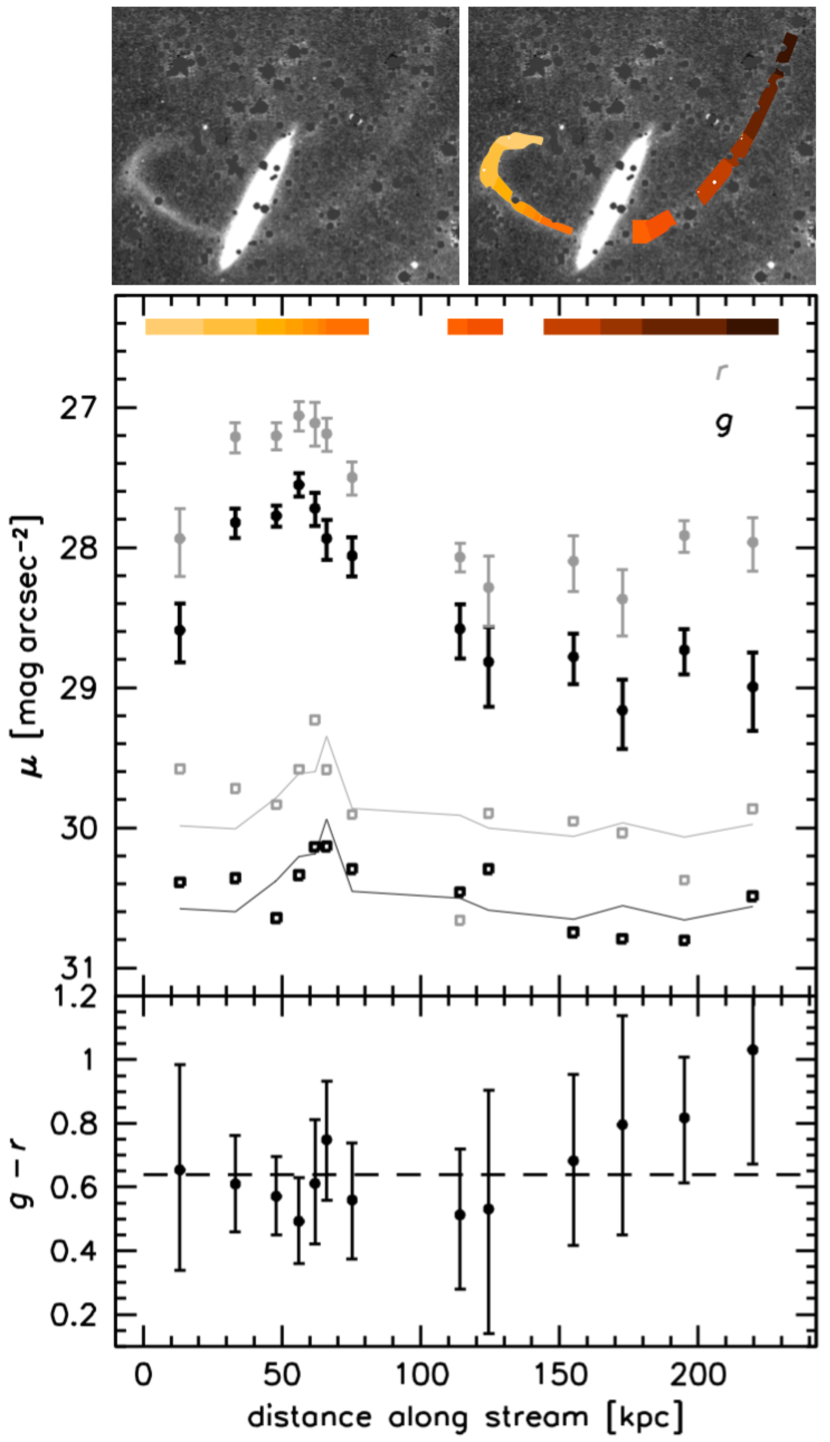
The surface brightness along the stream in and is quantified using aperture photometry. The apertures aim to include most of the width of the stream. As shown in Fig. 2 the surface brightness reaches a peak of mag arcsec-2 on the East side of the galaxy. On the West side the surface brightness is lower at mag arcsec-2. The uncertainties in the data points are determined by moving the apertures off of the actual stream and then obtaining fluxes in these “empty” locations. The apertures retain their position relative to each other, with the entire set of stream apertures moved to 52 different positions. In 13 of these positions the stream has the same orientation as the actual stream; in the other sets of positions it is flipped in , , and both and . The variation in these measurements is taken as the uncertainty (open symbols in Fig. 2). These uncertainties are not constant along the stream, as they depend on the size of the photometric aperture: for the larger apertures on the Western side the uncertainties are smaller than for the smaller apertures on the Eastern side. From a fit to the empirically-determined uncertainties we find that
| (1) |
and
| (2) |
with the aperture size in arcmin2 (thin lines). The color along the stream is shown in the bottom panel. The data are consistent with a constant color along the stream of mag (where the errorbar is the combination of random and mag systematic uncertainty). These results are broadly consistent with Shang et al. (1998) and Laine et al. (2016), who obtained photometry for the relatively bright Eastern part of the stream only.
The total magnitudes integrated over all apertures are and . There are two gaps in the photometric apertures: one coinciding with the disk and another with a bright star (see top right panel of Fig. 2). Interpolating over these apertures suggests these regions contain % of the light of the stream. Assuming another 10 % is missed in regions that are fainter than our detection limit, we estimate that the total magnitudes of the stream are and . For Mpc this corresponds to L⊙. For an analysis of the stellar population of the stream we refer the reader to Laine et al. (2016).
3.2. Probable identification of the progenitor galaxy
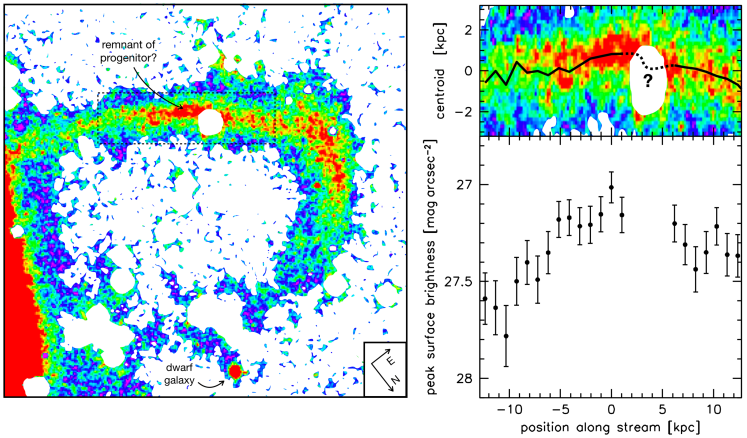
Stellar streams are generated by mass loss from a progenitor object along its orbit. Generally the progenitor object is within the densest part of the stream, is near the luminosity-weighted midpoint of the stream, and coincides with a displacement (as the leading and trailing streams come from stars that became unbound at opposite Lagrange points, toward the center and anti-center of the potential). These are not absolutes, as the orbital geometry, the superposition of successive passages, and projection effects complicate the observed morphology.
We identify the likely remnant of the progenitor object within the region highlighted in the left panel of Fig. 3. In the right panel we show the centroid of the emission and the peak brightness as a function of the position along this stream segment. These values are determined by fitting Gaussians to the stream profile (i.e., in the vertical direction in Fig. 3), averaging the emission in sections along the stream. There is a peak in the surface brightness close to the luminosity-weighted midpoint of the stream: % of the luminosity is to the East and % to the West. Furthermore, the centroid shows several kpc-sized offsets that could indicate the characteristic displacement of the leading and trailing streams. A possible location is indicated with the broken line and the question mark; unfortunately it coincides with a bright foreground star.
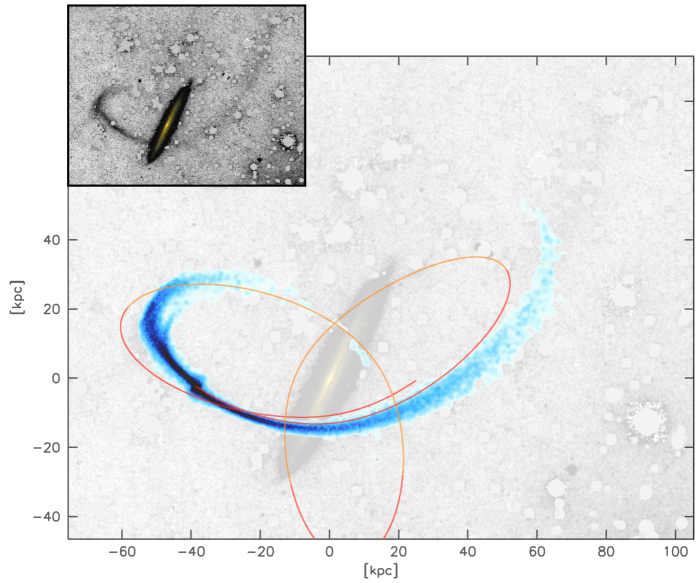
4. Dynamical stream model
In this section we show that a tidally disrupting satellite reproduces the overall stream morphology and the identified location of the progenitor. We followed the methodology developed for modeling streams in the Milky Way (e.g., Price-Whelan & Bonaca 2018), and started by rotating the coordinate system such that the galaxy is aligned with the -axis, is perpendicular to the disk plane and is the radial direction. The gravitational potential is set up with the same assumptions as M08 used for the disk (mass: M⊙, scale-length: 6.24 kpc, scale-height: 0.26 kpc) and bulge (mass: M⊙, scale-radius: 0.6 kpc). We used a more massive halo than M08 (mass: M⊙, scale-radius: 26 kpc, and axis flattening of 1.1) to better match the recent rotation curve measurement of Posti et al. (2019); we tested that the M08 halo also leads to a good match to the observed stream.
With the potential in place, we searched for the 6D location of the progenitor until we obtained an orbit that approximately matches the detected stream positions. The progenitor is assumed to be at the approximate position determined in § 3.2, and for simplicity we set . The velocity is tweaked in the positive direction, as the morphology suggests that the Eastern stream is the leading tail. In our model, the progenitor is currently at , . Due to projection effects and the lack of kinematic data this solution is not unique, but we leave a full exploration of the parameter space to future work.
With the orbit determined, we created a mock stream using the Fardal, Huang, & Weinberg (2015) method implemented in the gala package (Price-Whelan 2017). During the most recent 2.5 Gyr of the orbit we released tracer particles from the progenitor, tuning the spatial and kinematic offsets of the escaping stars to best represent the shape of the observed stream close to the progenitor. The progenitor initially had a stellar mass of M⊙.
The orbit and mock stream are shown in Fig. 4. There are discrepancies on small scales; however, the model reproduces the overall path, the higher density of the leading (Eastern) tail, and the asymmetric broadening of the leading tail where it curves back toward NGC 5907.
5. Discussion
In this Letter we present Dragonfly imaging of the NGC 5907 system, focusing on its well-known stellar stream. We find a relatively straightforward system composed of the remnant of a progenitor galaxy, a leading tail, and a long faint trailing tail. This overall morphology can be reproduced with a dynamical model without much fine-tuning. In terms of its spatial extent and stellar mass the stream is similar to the Sagittarius stream (see Sesar et al. 2017). The Milky Way and NGC 5907 are also quite similar, which means that the entire system offers an interesting analog to this accretion event.
We now turn to the most puzzling aspect of our study. As shown in Fig. 5 the morphology of the stream in our data is qualitatively different from that reported by M08. First, we do not confirm the presence of a second (Northern) loop, even though it contains the brightest part of the entire M08 tidal stream system. This stream segment is indicated by the yellow box in Fig. 5. From Eq. 1 we determine a upper limit of mag arcsec-2 for this region. Second, the first loop is in a different place: the location in the Dragonfly image falls in between the two loops identified in M08 (see Fig. 5). Other discrepancies are a greater length of the Western stream in our data; the presence of a density enhancement in the first loop (which we identify as the location of the progenitor); and the much smaller ratio of the apparent width of the stream to the apparent width of the NGC 5907 disk.
It is unlikely that these discrepancies are caused by a difference in depth or by color variation along the stream. The M08 image was obtained by an amateur astronomer in close coordination with professional astronomers, using a 0.5 m telescope located on the same site as Dragonfly. The limiting surface brightness of the M08 image should approach that of the Dragonfly image when the size of the telescope, the exposure time (5.8 hrs in white light and 5.6 hrs in red, green, and blue filters), and the throughput of the filters are taken into account. Furthermore, neither a difference in depth nor a color gradient can explain the different locations of the first loop and the other qualitative discrepancies between the two datasets. We note that other images of NGC 5907 in the literature appear to show only one loop in the same location as in the Dragonfly data (see Shang et al. 1998; Miskolczi et al. 2011; Lang, Hogg, & Scholkopf 2014; Laine et al. 2016). We provide our data on a web page so that others can assess them.333See https://www.pietervandokkum.com/ngc5907.
There are several routes to make further progress. Deeper data can verify the reality of the tentative sections of the stream and better quantify its substructure. We will also search for streams around other galaxies, both in targeted surveys (Merritt et al. 2016; C. Gilhuly et al., in preparation) and in blank field surveys (S. Danieli et al., in preparation). More generally, this study follows previous work in demonstrating the power of the combination of low surface brightness imaging with dynamical modeling (see also, e.g., Foster et al. 2014; Amorisco, Martinez-Delgado, & Schedler 2015; Pearson et al. 2019). Systematic surveys of accretion events across the nearby Universe are providing complementary information to the extensive work in the Local Group.
References
- (1)
- (2) Abraham, R. G. & van Dokkum, P. G. 2014, PASP, 126, 55
- (3)
- (4) Amorisco, N. C., Martinez-Delgado, D., & Schedler, J. 2015, arXiv e-prints, arXiv:1504.03697
- (5)
- (6) Arp, H. 1966, ApJS, 14, 1
- (7)
- (8) Atkinson, A. M., Abraham, R. G., & Ferguson, A. M. N. 2013, ApJ, 765, 28
- (9)
- (10) Bell, E. F., Naab, T., McIntosh, D. H., Somerville, R. S., Caldwell, J. A. R., Barden, M., Wolf, C., Rix, H.-W., et al. 2006, ApJ, 640, 241
- (11)
- (12) Belokurov, V., Evans, N. W., Irwin, M. J., Lynden-Bell, D., Yanny, B., Vidrih, S., Gilmore, G., Seabroke, G., et al. 2007, ApJ, 658, 337
- (13)
- (14) Bertin, E. & Arnouts, S. 1996, A&AS, 117, 393
- (15)
- (16) Bonaca, A., Conroy, C., Price-Whelan, A. M., & Hogg, D. W. 2019, arXiv e-prints, arXiv:1906.02748
- (17)
- (18) Bonaca, A. & Hogg, D. W. 2018, ApJ, 867, 101
- (19)
- (20) Bovy, J., Erkal, D., & Sanders, J. L. 2017, MNRAS, 466, 628
- (21)
- (22) Bullock, J. S. & Johnston, K. V. 2005, ApJ, 635, 931
- (23)
- (24) Danieli, S., van Dokkum, P., & Conroy, C. 2018, ApJ, 856, 69
- (25)
- (26) D’Souza, R., & Bell, E. F. 2018, Nature Astronomy, 2, 737
- (27)
- (28) Fardal, M. A., Huang, S., & Weinberg, M. D. 2015, MNRAS, 452, 301
- (29)
- (30) Foster, C., Lux, H., Romanowsky, A. J., Martínez-Delgado, D., Zibetti, S., Arnold, J. A., Brodie, J. P., Ciardullo, R., et al. 2014, MNRAS, 442, 3544
- (31)
- (32) Grillmair, C. J. & Carlin, J. L. 2016, in Astrophysics and Space Science Library, Vol. 420, Tidal Streams in the Local Group and Beyond, ed. H. J. Newberg & J. L. Carlin, 87
- (33)
- (34) Helmi, A. 2004, ApJ, 610, L97
- (35)
- (36) Ibata, R. A., Lewis, G. F., Irwin, M. J., & Quinn, T. 2002, MNRAS, 332, 915
- (37)
- (38) Ibata, R. A., Wyse, R. F. G., Gilmore, G., Irwin, M. J., & Suntzeff, N. B. 1997, AJ, 113, 634
- (39)
- (40) Laine, S., Grillmair, C. J., Capak, P., Arendt, R. G., Romanowsky, A. J., Martínez-Delgado, D., Ashby, M. L. N., Davies, J. E., et al. 2016, AJ, 152, 72
- (41)
- (42) Lang, D., Hogg, D. W., & Scholkopf, B. 2014, JMLR Workshop and Conference Proceedings, 33, 549 (arXiv:1406.1528)
- (43)
- (44) Law, D. R. & Majewski, S. R. 2010, ApJ, 714, 229
- (45)
- (46) Malhan, K., Ibata, R. A., & Martin, N. F. 2018, MNRAS, 481, 3442
- (47)
- (48) Malin, D. & Hadley, B. 1997, PASA, 14, 52
- (49)
- (50) Martínez-Delgado, D., Gabany, R. J., Crawford, K., Zibetti, S., Majewski, S. R., Rix, H.-W., Fliri, J., Carballo-Bello, J. A., et al. 2010, AJ, 140, 962
- (51)
- (52) Martínez-Delgado, D., Peñarrubia, J., Gabany, R. J., Trujillo, I., Majewski, S. R., & Pohlen, M. 2008, ApJ, 689, 184
- (53)
- (54) McConnachie, A. W., Huxor, A., Martin, N. F., Irwin, M. J., Chapman, S. C., Fahlman, G., Ferguson, A. M. N., Ibata, R. A., et al. 2008, ApJ, 688, 1009
- (55)
- (56) Merritt, A., van Dokkum, P., Abraham, R., & Zhang, J. 2016, ApJ, 830, 62
- (57)
- (58) Mihos, J. C., Harding, P., Feldmeier, J., & Morrison, H. 2005, ApJ, 631, L41
- (59)
- (60) Miskolczi, A., Bomans, D. J., & Dettmar, R. J. 2011, A&A, 536, 66
- (61)
- (62) Moore, B., Ghigna, S., Governato, F., Lake, G., Quinn, T., Stadel, J., & Tozzi, P. 1999, ApJ, 524, L19
- (63)
- (64) Newberg, H. J., Yanny, B., Rockosi, C., Grebel, E. K., Rix, H.-W., Brinkmann, J., Csabai, I., Hennessy, G., et al. 2002, ApJ, 569, 245
- (65)
- (66) Odenkirchen, M., Grebel, E. K., Rockosi, C. M., Dehnen, W., Ibata, R., Rix, H.-W., Stolte, A., Wolf, C., et al. 2001, ApJ, 548, L165
- (67)
- (68) Pearson, S., Starkenburg, T. K., Johnston, K. V., Williams, B. F., & Ibata, R. A. 2019, arXiv e-prints, arXiv:1906.03264
- (69)
- (70) Posti, L., Fraternali, F., & Marasco, A. 2019, A&A, 626, 56
- (71)
- (72) Price-Whelan, A. M. 2017, The Journal of Open Source Software, 2, 388
- (73)
- (74) Price-Whelan, A. M. & Bonaca, A. 2018, ApJ, 863, L20
- (75)
- (76) Sackett, P. D., Morrison, H. L., Harding, P., & Boroson, T. A. 1994, Nature, 370, 441
- (77)
- (78) Sancisi, R. 1976, A&A, 53, 159
- (79)
- (80) Sasaki, T. 1987, PASJ, 39, 849
- (81)
- (82) Sesar, B., Hernitschek, N., Dierickx, M. I. P., Fardal, M. A., & Rix, H.-W. 2017, ApJ, 844, L4
- (83)
- (84) Shang, Z., Zheng, Z., Brinks, E., Chen, J., Burstein, D., Su, H., Byun, Y.-i., Deng, L., et al. 1998, ApJ, 504, L23
- (85)
- (86) Shipp, N., Drlica-Wagner, A., Balbinot, E., Ferguson, P., Erkal, D., Li, T. S., Bechtol, K., Belokurov, V., et al. 2018, ApJ, 862, 114
- (87)
- (88) Tully, R. B., Courtois, H. M., & Sorce, J. G. 2016, AJ, 152, 50
- (89)
- (90) van Dokkum, P. G. 2005, AJ, 130, 2647
- (91)
- (92) van Dokkum, P. G., Abraham, R., & Merritt, A. 2014, ApJ, 782, L24
- (93)
- (94) Wang, J., Hammer, F., Athanassoula, E., Puech, M., Yang, Y., & Flores, H. 2012, A&A, 538, A121
- (95)
- (96) Zhang, J., Abraham, R., van Dokkum, P., Merritt, A., & Janssens, S. 2018, ApJ, 855, 78
- (97)
- (98) Zheng, Z., Shang, Z., Su, H., Burstein, D., Chen, J., Deng, Z., Byun, Y.-I., Chen, R., et al. 1999, AJ, 117, 2757
- (99)
- (100) Zou, H., Zhang, T., Zhou, Z., Peng, X., Nie, J., Zhou, X., Fan, X., Jiang, L., et al. 2018, ApJS, 237, 37
- (101)