Interplay between electron band-anticrossing and charge-density-wave instabilities
Abstract
Our measurements of the Hall coefficient in rare-earth tritelluride compounds reveal a strong hysteresis between cooling and warming in the low temperature range where a second unidirectional charge density wave (CDW) occurs. We show that this effect results from the interplay between two instabilities: band crossing of the Te and orbitals at the Fermi level and CDW, which have a close energy gain and compete. Calculation of the electron susceptibility at the CDW wave vector with and without band anticrossing reconstruction of the electron spectrum yields a satisfactory estimation of the temperature range of the hysteresis in Hall effect measurements.
pacs:
71.45.Lr, 72.15.G-d, 71.18.+yCrossing of electron energy bands near the Fermi level, resulting in the degeneracy and anticrossing of energy levels, always leads to amazing physical properties. The anticrossing of spin-split energy bands with spin-orbit coupling produces non-trivial topologically-protected electron states in Weyl and Dirac semimetals, which is a subject of extensive research last decade HasanRMP2010 ; ZhangRMP2011 ; YanAnnuRev2017 ; ArmitageRMP2018 . Even without spin effects, the band anticrossing near the Fermi level modifies the electron spectrum and the Fermi surface (FS). This affects various electronic instabilities such as, superconductivity in high-temperature cuprate superconductors LSCO17 ; LSCO18 ; LSCO98 and spin- or charge-density waves Ru08 ; Brouet08 ; EuTe4 . In this paper we unveil the competition of band anticrossing and the charge-density wave (CDW) in the family of rare-earth tritelluride compounds. We show, both theoretically and experimentally, that this interplay leads to the hysteretic electronic phase transition with the change of FS topology and of Hall coefficient.
Layered compounds of Te3 family (=rare earth atom) have a weakly orthorhombic crystal structure (space group ). These systems exhibit an incommensurate CDW through the whole series Ru08 ; Lavagnini10R ; Moore2010 , with a wave vector and a Peierls transition temperature above 300 K for the light atoms (La, Ce, Nd). For the heavier (Tb, Dy, Ho, Er, Tm) a second CDW occurs at low temperature with the wave vector perpendicular to .
For our study we chose three compounds from the Te3 family: two compounds, ErTe3 and HoTe3, demonstrating bidirectional CDW ordering at and K and and K correspondingly, and TbTe3 revealing an unidirectional CDW at K. Single crystals of these compounds were grown by a self-flux technique under purified argon atmosphere as described previously SinchPRB12 . Thin samples with a typical thickness 1-3 m having a rectangular shape were prepared by micromechanical exfoliation of relatively thick crystals glued on a sapphire substrate.
The magnetic field was applied parallel to the axis. The Hall resistance was recorded using the van der Pauw method Pauw61 , sweeping the field between and T at fixed temperature with a step K first by cooling from down to 4.2 K and after that by warming back.
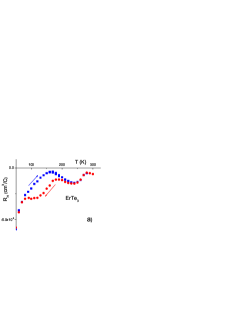
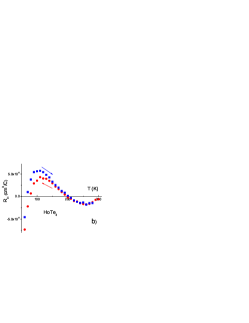

For all measured compounds is a linear function of at least for temperatures K (see Supplementary Materials (SM)). So, the Hall constant, , where is the crystal thickness, is indeed a field-independent quantity. Its temperature dependencies for ErTe3, HoTe3 and TbTe3 are shown in Fig. 1 (a), (b) and (c) correspondingly. One can see that for ErTe3 and HoTe3 demonstrates a strong hysteresis between cooling and warming in the temperature range around the second Peierls transition while is completely reversible for TbTe3 revealing only a single transition to the CDW state in the studied range of temperature. When measured under cooling and warming the temperature dependence of the resistance of all three compounds was reversible (see SM). It means that the total number of charge carriers remains near the same under cooling and warming. We see only one explanation of this effect: there are two types of carriers, and the hysteresis observed is attributed to the change in electron-hole balance as a result of the second CDW formation. Such scenario is confirmed by the change of the sign of Hall constant at a certain temperature in HoTe3 and TbTe3.
One can naturally attribute the observed effect to the hysteresis of the CDW wave vector due to its pinning by crystal imperfections. However, our preliminary x-ray diffraction studies of ErTe3, performed at ID28 ESRF beamline Girard19 , showed a completely reversible evolution of all structural parameters in the temperature range 100-300 K (see SM). Therefore, we consider another possible origin of this hysteresis, based on the interplay of CDW2 with another type of electronic instability. As a possible candidate of such electronic ordering competing with CDW2, we suggest the one due to the electron band-crossing at the Fermi level.
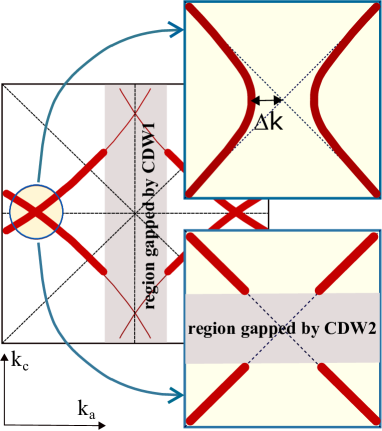
Consider two electron bands with electron dispersion and . Two corresponding Fermi surfaces, given by equations and , intersect along the lines in the momentum space. In RTe3 compounds in the plane below there are two such crossing points ,CommentCP highlighted by filled yellow circles in Fig. 2. At each degeneracy point , any small interband coupling , even at zero momentum transfer , leads to the band anticrossing and to the reconstruction of FS (see right upper inset in Fig. 2). This FS anticrossing has been observed in various RTe3 compounds by ARPES measurements Moore2010 ; ARPES2008 . The interband coupling may originate, e.g., from the electron-electron (e-e) interaction. Usually, decreases with the increase of momentum transfer , and may considerably exceed .

First consider the toy model with the interband coupling (off-diagonal terms) only at . In this model the different momenta are not coupled, and the Hamiltonian writes down as a sum over electron momenta , , where in the basis of two branches of electron spectrum each term is given by a matrixNoteH
| (1) |
with two eigenvalues
| (2) |
representing two new branches of electron spectrum. The total electron energy is given by the sum of quasiparticle energies over their quantum numbers:
| (3) |
where is the Fermi-Dirac distribution function. Without band anticrossing the total energy is given by the same Eq. (3) with the replacement . The difference comes mainly from the vicinity of the crossing points , where two conditions are satisfied: (i) , so that the electron spectrum changes considerably, and (ii) , so that the change of electron spectrum is close to the Fermi level. Near the crossing point one may linearize each branch of electron spectrum:
| (4) |
where is the Fermi velocity of branch . Then , and the contributing momentum area in the vicinity of the crossing point is estimated as . Then the energy difference per unit area per one spin component but including two cross points is
| (5) |
where is the in-plane lattice constant and is the quasi-1D density of states (DoS) at the Fermi level per one branch and spin component. Our calculation of by the numerical integration according to Eq. (3) confirms the estimate in Eq. (5), giving the value % less than in Eq. (5).
The CDW energy gain isGruner ; CommentE
| (6) |
where is the CDW energy gap, given by the off-diagonal matrix element of the Hamiltonian, similar to in Eq. (1). The extra small parameter in the band-crossing energy gain in Eq. (5) as compared to Eq. (6) comes from the small momentum region of contributing electrons, while in a CDW a considerable part of electrons on the Fermi level participate in the Peierls instability, so that a similar small factor does not appear. Hence, the CDW2 energy gain may be larger than the energy gain from band anticrossing, although its energy gap .
We estimate the value of from the FS distortion at the crossing point observed in ARPES. This FS distortion along the -axis is about % of the Brillouin zone width ,Moore2010 ; ARPES2008 where the lattice constant in ErTe3. This corresponds to the condition , giving the boundary of electron states with a gap on the Fermi level according to Eq. (2). In RTe3 compounds the FS of two bands cross at almost right angle, as shown in Fig. 2. Substituting the electron dispersion (4) with , we obtain in ErTe3 compounds . For comparison, in ErTe3 the CDW1 energy gap , and the CDW2 energy gap is .CDWGap The parameter is indeed , and the ratio of energy gains from the band anticrossing and from CDW2 is , i.e. slightly less than unity. This means a strong temperature-dependent interplay of these two electronic instabilities, making CDW2 slightly more energetically favorable at low . However, since , the band anticrossing appears at much higher temperature than , even higher than .
The band anticrossing and CDW2 hinder each other, because each of them change the electron spectrum. The CDW2 creates an energy gap on the Fermi level just at the spots of FS intersection (see lower right inset in Fig. 2), thus suppressing or making irrelevant the band anticrossing. The influence of band anticrossing on CDW2 is less obvious, because the FS has an approximate nesting property both with and without the band anticrossing. Moreover, our calculation of the DoS with and without band anticrossing gives nearly the same result in both cases. Hence, to substantiate that band anticrossing hinders the CDW2 instability, we need to compare the electronic susceptibility at the CDW2 wave vector in both cases: with and without band anticrossing reconstruction of electron spectrum. The CDW2 transition temperature is given by the equationGruner , where is the wave vector where the susceptibility takes a maximum value. The larger is the susceptibility , the higher is the CDW transtition temperature, because susceptibility increases with the decrease of temperature.
For calculation we use the well-known formula for the static susceptibility of free-electron gas at finite wave vector . Electron spin only leads to a factor in susceptibility, but the summation over band index must be retained. Then the real part of electron susceptibility is
| (7) |
where is the dimension of space. In Te3 compounds under study there are two bands crossing the Fermi level, , and we may take because the dispersion in the -direction is weak. Eq. (7) differs only by the summation over and from the common expression, e.g., given in Eq. (1.7) of Ref. Gruner .
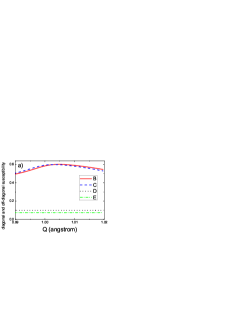
Taking the tight-binding bare electron dispersion commonly usedBrouet08 ; Sinchenko2014 for Te3 compounds and given by Eqs. (2) of Ref. Sinchenko2014 , we calculate the susceptibility in Eq. (7) as a function of the wave vector and temperature for two cases: without band-crossing effect, i.e. for bare electron dispersion , and for reconstructed dispersion given by Eq. (2). The results are shown in Fig. 3. The integration over momentum in Eq. (7) is performed only at , because in the momentum region the electron spectrum at the Fermi level has a large gap due to the CDW1. The summation over and in Eq. (7) gives four terms: two intraband terms with and two interband terms with . The intraband ”diagonal” terms, enhanced by a rather good FS nesting, are much larger than the ”off-diagonal” interband terms, because the latter correspond to almost perpendicular FS sheets and do not have such nesting enhancement (see Fig. 3a). Hence, the intraband contribution, shown by upper blue and red curves in Fig. 3a, have a maximum at the CDW2 wave vector , resulting to a similar maximum on the total susceptibility in Fig. 3b, while the interband contribution, shown by lower green and black curves in Fig. 3a, depends weakly on . Nevertheless, the interband contribution is considerable, being about 20% of the intraband susceptibility. While the maximum values of ”diagonal” intraband susceptibility terms are weakly affected by the band anticrossing, the ”off-diagonal” interband terms are suppressed by the band anticrossing reconstruction by more than 20% (see Fig. 3a). This can be easily understood by looking at the FS with and without band anticrossing, shown in Fig. 2. The DoS and the nesting property is not violated by the band anticrossing, hence, the intraband terms remain almost the same (only the optimal CDW2 wave vector slightly shifts). On the contrary, after the band anticrossing reconstruction, the FS of different bands become separated by % of the Brillouin zone. Two FS sheets even do not intersect as was without the band anticrossing. Hence, the interband susceptibility decreases considerably.
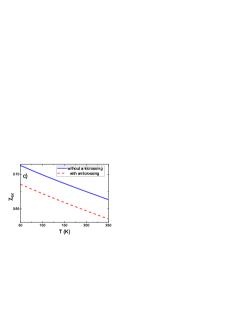
We have shown that the band anticrossing and CDW2 interfere, suppressing each other. With temperature decrease the band anticrossing appears first (at higher temperature) and reduces the CDW2 transition temperature to its observed value . At lower temperature, when CDW2 develops and the increases, since , the band anticrossing shrinks in favor of CDW2. This may happen as a first-order phase transition, accompanied by a hysteresis. When the temperature increases again, the CDW2 disappears at temperature , because of the changed band-crossing energy spectrum. This results to a hysteresis seen by the Hall coefficient sensitive to the FS reconstruction due to . We can estimate how strong is this hysteresis by looking at the calculated temperature dependence of susceptibility , shown in Fig. 3c. The calculated optimal wave vector of the instability, i.e. of the susceptibility maximum shown in Fig. 3b, very slightly increases with temperature from at K to at K. Therefore, this change was not observed in X-ray experiment(see SM). In Fig. 3c we plot the maximum value of as a function of temperature without (solid blue line) and with (dashed red line) band-crossing reconstruction. They differ by only, but since the temperature dependence of susceptibility is also quite weak, the susceptibility value , which the red curve reaches only at , the blue curve has already at . Thus, the expected temperature hysteresis is rather large: .
The proposed interplay between band-crossing and CDW is rather general and is expected in many other compounds with FS intersection at the nested parts. For example, similar effect is expected in Te4 family of compounds, where a large temperature hysteresis of resistance has also been observed recentlyEuTe4 .
The bilayer splitting of electron spectrum smears the nesting condition.CDWGap The exact bare electron dispersion are unknown. The coupling between two CDWs in the above analysis is taken into account only by neglecting the contribution from the states gapped by CDW1. These and other factors make the interplay of CDW2 with other instabilities more complicated, but we expect that the main features of the proposed model remain valid.
To summarize, we observed a strong hysteresis of the Hall coefficient in the rare-earth triteluride compounds ErTe3 and HoTe3, having two CDW phase transitions. We explain this effect by a strong interplay of the low temperature CDW and the band-anticrossing change of electron spectrum. We estimate of the temperature range of this hysteresis by calculating the electron susceptibility at the CDW2 wave vector with and without band anticrossing. The interplay between these two instabilities is proposed and investigated for the first time and may be relevant to other compounds where two electron bands cross at the Fermi level.
Acknowledgements.
The authors are grateful to the staff of the ID 28 beam line ESRF. The work was partially supported by joint grant CNRS and Russian State Fund for the Basic Research (No. 17-52-150007) and by the Foundation for Advancement of Theoretical Physics and Mathematics ”BASIS”. P.V. thanks RFBR grant No. 19-02-01000. P.G. thanks State assignment 0033-2019-0001 ”The development of condensed-matter theory”. A.S. thanks State assignment IRE RAS.References
- (1) M.Z. Hasan and C.L. Kane, Rev. Mod. Phys. 82, 3045 (2010).
- (2) Xiao-Liang Qi and Shou-Cheng Zhang, Rev. Mod. Phys. 83, 1057 (2011).
- (3) Binghai Yan and Claudia Felser, Annu. Rev. Condens. Matter Phys. 8, 337 (2017).
- (4) N.P. Armitage, E.J. Mele, and Ashvin Vishwanath, Rev. Mod. Phys. 90, 015001 (2018).
- (5) E. Razzoli, C. E. Matt, Y. Sassa, M. Mansson, O. Tjernberg, G. Drachuck, M. Monomo, M. Oda, T. Kurosawa, Y. Huang, N.C. Plumb, M. Radovic, A. Keren, L. Patthey, J. Mesot, and M. Shi, Phys. Rev. B 95, 224504 (2017).
- (6) M. Horio, K. Hauser, Y. Sassa, Z. Mingazheva, D. Sutter, K. Kramer, A. Cook, E. Nocerino, O. K. Forslund, O. Tjernberg, M. Kobayashi, A. Chikina, N. B. M. Schroeter, J. A. Krieger, T. Schmitt, V. N. Strocov, S. Pyon, T. Takayama, H. Takagi, O. J. Lipscombe, S. M. Hayden, M. Ishikado, H. Eisaki, T. Neupert, M. Mansson, C. E. Matt, and J. Chang, Phys. Rev. Lett 121, 077004 (2018).
- (7) Jason K. Perry and Jamil Tahir-Kheli, Phys. Rev. B 58, 12323 (1998).
- (8) N. Ru, C. L. Condron, G. Y. Margulis, K. Y. Shin, J. Laverock, S. B. Dugdale, M. F. Toney, and I. R. Fisher, Phys. Rev. B 77, 035114 (2008).
- (9) V. Brouet, W. L. Yang, X. J. Zhou, Z. Hussain, R. G. Moore, R. He, D. H. Lu, Z. X. Shen, J. Laverock, S. B. Dugdale, N. Ru, and I. R. Fisher, Phys. Rev. B 77, 235104 (2008).
- (10) D.Wu, Q.M. Liu, S.L. Chen, G.Y. Zhong, J. Su, L.Y. Shi, L. Tong, G. Xu, P. Gao, and N.L. Wang, Phys. Rev. Materials 3 024002 (2019).
- (11) M. Lavagnini, H.-M. Eiter, L. Tassini, B. Muschler, R. Hackl, R. Monnier, J.-H. Chu, I. R. Fisher, and L. Degiorgi, Phys. Rev. B 81, 081101(R) (2010).
- (12) R. G. Moore, V. Brouet, R. He, D. H. Lu, N. Ru, J.-H. Chu, I. R. Fisher, and Z.-X. Shen, Phys. Rev. B 81, 073102 (2010).
- (13) A.A. Sinchenko, P. Lejay, and P. Monceau, Phys. Rev. B 85, 241104(R) (2012).
- (14) A. Girard, T. Nguyen-Thanh, S. M. Souliou, M. Stekiel, W. Morgenroth, L. Paolasini, A. Minelli, D. Gambetti, B. Winkler and A. Bosak, Journal of Synchrotron Radiation 26, 272 (2019)
- (15) G. Grüner, Density waves in Solids Perseus Publishing; 1st edition (January 15, 2000).
- (16) F. Schmitt et al., Science 321, 1649 (2008).
- (17) L.J. van der Pauw, Philips Res. Repts. 16, 187 (1961).
- (18) Above there are 4 crossing points, but two of them disappear after the CDW1 energy gap opens.
- (19) In the second-quantization formalism this Hamiltonian writes down as
- (20) B. F. Hu, B. Cheng, R. H. Yuan, T. Dong, and N. L. Wang, Phys. Rev. B 90, 085105 (2014).
- (21) L. D. Landau and E. M. Lifshitz, Course of Theoretical Physics, Vol. 5: Statistical Physics, 3rd ed. (Nauka, Moscow, 1976; Pergamon Press, Oxford, 1980).
- (22) A.A. Sinchenko, P.D. Grigoriev , P. Lejay and P. Monceau, Phys. Rev. Lett. 112 036601 (2014).
- (23) The extra factor comes from the summation over two bands.