Broadband spectral analysis of MXB 1659-298 in its soft and hard state
Abstract
The X-ray transient eclipsing source MXB 1659-298 went in outburst in 1999 and 2015, respectively, during which it was observed by XMM-Newton, NuSTAR and Swift. Using these observations we studied the broadband spectrum of the source to constrain the continuum components and to verify the presence of a reflection component. We analysed the soft and hard state of the source, finding that the soft state can be modelled with a thermal component associated with the inner accretion disc plus a Comptonised component. A smeared reflection component and the presence of an ionised absorber are also requested in the best-fit model. On the other hand, the direct continuum emission in the hard state can be described by a Comptonised component with a temperature larger than 150 keV. Also in this case a reflection component and a ionised absorber are observed.
keywords:
stars: neutron – stars: individual (MXB 1659-298) – X-rays: binaries – accretion, accretion disks1 Introduction
MXB 1659-298 is a low mass X-ray binary (LMXB) harbouring a neutron star (NS). The source was observed in outburst three times: from 1976 up to 1978 (Cominsky et al. 1983; Cominsky & Wood 1984, 1989), from 1999 up to 2001 with BeppoSAX, Rossi-XTE and XMM-Newton (see e.g. in ’t Zand et al. 1999; Wachter et al. 2000; Oosterbroek et al. 2001) and from 2015 up to 2017 with Swift (Bahramian et al. 2016) and NuSTAR (Sharma et al. 2018).
| ObsId | Instrument | Start Time (UTC) | Exposure time (ks) |
|---|---|---|---|
| 0008610701 | XMM-Newton | 2001-02-20 8:28:27 | 31.5 |
| 0748391601 | XMM-Newton | 2015-09-26 19:53:05 | 42.9 |
| 90101013002 | NuSTAR | 2015-09-28 21:51:08 | 51.5 |
| 90201017002 | NuSTAR | 2016-04-21 14:41:08 | 26.8 |
| 00034002036_roll1 | Swift | 2016-04-20 01:47:54 | 0.67 |
| 00034002036_roll2 | Swift | 2016-04-20 01:47:54 | 0.13 |
| 00081918001 | Swift | 2016-04-21 20:39:01 | 0.70 |
Studying the XMM-Newton spectrum of MXB 1659-298, Sidoli et al. (2001) detected two absorption lines at 6.64 and 6.90 keV associated with the presence of highly ionised iron (Fe xxv and Fe xxvi ions) as well as absorption lines associated with highly ionised oxygen and neon. Furthermore, the authors detected the presence of a broad emission line centred at 6.47 keV and with a FWHM of 1.4 keV. Recently, Iaria et al. (2018) and Jain et al. (2017), studying the eclipse arrival times of the source, suggested the presence of a third body orbiting around the binary system.
Here, we report the broadband spectral analysis of the persistent emission of MXB 1659-298 using XMM-Newton (including the observation studied by Sidoli et al. 2001), NuSTAR and Swift/XRT data. We analysed the spectrum of the source in soft state (SS) and hard state (HS) finding that a relativistic reflection component is necessary to describe the spectra.
2 Observations and Data Analysis
We were interested in the spectral analysis of the persistent emission, then we extracted the XMM-Newton/EPN, XMM-Newton/RGS and NuSTAR events excluding the times in which the dips, the eclipses and the type-I X-ray bursts occurred. The analysed observations are summarised in Table 1.
| Model | Component | Soft State | Hard State | ||
|---|---|---|---|---|---|
| XMM-Newton | Swift-NuSTAR | XMM-Newton | NuSTAR | ||
| Edge | E (kev) | 0.538 (frozen) | 0.538 (frozen) | ||
| zxipcf | (10 atoms cm-2) | ||||
| 1 (frozen) | |||||
| TBabs | (10 atoms cm-2) | ||||
| diskbb | (keV) | - | |||
| (km) | - | ||||
| rdblur | Betor10 | ||||
| () | |||||
| rfxconv | rel_refl | ||||
| NthComp | |||||
| (keV) | |||||
| (kev) | |||||
| Norm | |||||
| (d.o.f) | 3124(2795) | 2321(2269) | |||
Analysing the RXTE/ASM and MAXI/GSC light curves of the source, we observe that the source shows a flux of 30 mCrab during the XMM-Newton obs. 0008610701, the Swift observations and the NuSTAR obs. 90101017002. On the other hand, the XMM-Newton obs. 0748391601 and the NuSTAR obs. 90101013002 were taken while the source flux was less than 5 mCrab. These evidences led us to fit together the persistent spectra obtained with XMM-Newton obs. 0748391601 and NuSTAR obs. 90101013002 (hereafter HS spectrum), while the persistent spectra obtained from the XMM-Newton obs. 0008610701, the NuSTAR obs. 90101017002 and the Swift observations are fitted together even if they were taken during two different outbursts (hereafter SS spectrum). We will show that they describe the hard and the soft state of MXB 1659-298, respectively.
The adopted energy ranges for the SS are 0.4-2 keV, 0.6-12 keV, 3-35 keV and 0.5-9 keV, for RGS12, EPN, NuSTAR and Swift spectra, respectively; while the adopted energy range for the HS are 0.45-2 keV, 0.6-12 keV and 3-55 keV for RGS12, EPN and NuSTAR spectra.
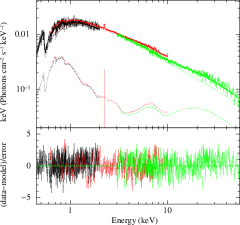
After fitting the SS spectrum with several models, we found that the best-fit one was composed of a disc-blackbody component (diskbb in XSPEC) plus a thermally Comptonised component (nthComp in XSPEC, see Życki et al. 1999) to fit the continuum emission, plus a convolution component which takes into account the reflection continuum also (rxfconv, see Done & Gierliński 2006; Kolehmainen et al. 2011, for details). Furthermore, we added an absorption edge with threshold energy fixed at 0.538 keV and a multiplicative component that takes into account a partial covering of ionised absorbing material (zxipcf, see Reeves et al. 2008; Miller et al. 2007). We kept fixed the value of the redshift to zero, the iron abundance to the solar one, the outer radius of the accretion disc Rout to 2800 gravitational radii () and the cosine of the inclination angle of MXB 1659-298 (that we assume to be 72∘, Iaria et al. 2018). The other parameters were left free to vary.
For the HS spectrum, the best-fit model was the same described above without any thermal component, which resulted unnecessary to fit the spectrum. In this case, the outer radius Rout was kept fixed to 290 .
3 Discussion

We have analysed several spectra of MXB 1659-298 collected during the 1999 and 2015 outbursts, observing two different spectral state of the source. We find that the SS spectrum has a 0.1-100 keV unabsorbed flux of erg cm-2 s-1 and it shows a soft Comptonised component with a value of the electron temperature lower than 4 keV. Furthermore, a multicolour disc component is present at low energies with an inner temperature of 0.27 keV and an inner radius of the disc R km . On the other hand, the HS spectrum shows a hard Comptonised component with a value of the electron temperature larger than 150 keV; the addition of a thermal component is not statistically significant. It is necessary to take into account a smeared reflection component to model the Fe-K region of both the spectra, where a broad emission line is observed. We find that the width of the emission line cannot be explained considering only the Compton scattering but we have to include the relativistic smearing in order to obtain a good fit. In the SS, the reflecting region of the accretion disc is between 39 and 2800 and it is between 6 and 290 in HS. Besides, the ionisation parameter is and in SS and HS, respectively. By analysing both the spectra we obtain that the values of the equivalent hydrogen column density are compatible with each other within 90% c.l. with a value of cm-2. Furthermore, we observed that the source is covered by ionised absorbing matter, at least partially in the case of HS spectrum.
We estimated also the optical depth of the Comptonised cloud using the relation between the power-law photon index and the electron temperature obtained by Zdziarski et al. (1996), finding that it is optically thick in the SS (i.e ) whilst it is optically thin in the hard state (). Finally, we obtained a value of the relative reflection normalisation of in SS, compatible with a spherical corona in the inner part of the accretion disc (see Dove et al. 1997); while the value of obtained for the HS suggests a larger superposition of the corona to the disc.
Acknowledgements
We acknowledge financial contribution from the agreement ASI-INAF I/037/12/0.
References
- Bahramian et al. (2016) Bahramian, A., Heinke, C. O., Wijnands, R., & Degenaar, N. 2016, The Astronomer’s Telegram, 8699
- Cominsky et al. (1983) Cominsky, L., Ossmann, W., & Lewin, W. H. G. 1983, ApJ, 270, 226
- Cominsky & Wood (1984) Cominsky, L. R. & Wood, K. S. 1984, ApJ, 283, 765
- Cominsky & Wood (1989) Cominsky, L. R. & Wood, K. S. 1989, ApJ, 337, 485
- Done & Gierliński (2006) Done, C. & Gierliński, M. 2006, MNRAS, 367, 659
- Dove et al. (1997) Dove, J. B., Wilms, J., Maisack, M., & Begelman, M. C. 1997, ApJ, 487, 759
- Iaria et al. (2018) Iaria, R., Gambino, A. F., Di Salvo, T., et al. 2018, MNRAS, 473, 3490
- in ’t Zand et al. (1999) in ’t Zand, J., Heise, J., Smith, M. J. S., et al. 1999, IAU Circ., 7138
- Jain et al. (2017) Jain, C., Paul, B., Sharma, R., Jaleel, A., & Dutta, A. 2017, MNRAS, 468, L118
- Kolehmainen et al. (2011) Kolehmainen, M., Done, C., & Díaz Trigo, M. 2011, MNRAS, 416, 311
- Miller et al. (2007) Miller, L., Turner, T. J., Reeves, J. N., et al. 2007, A&A, 463, 131
- Oosterbroek et al. (2001) Oosterbroek, T., Parmar, A. N., Sidoli, L., in’t Zand, J. J. M., & Heise, J. 2001, A&A, 376, 532
- Reeves et al. (2008) Reeves, J., Done, C., Pounds, K., et al. 2008, MNRAS, 385, L108
- Sharma et al. (2018) Sharma, R., Jaleel, A., Jain, C., et al. 2018, MNRAS, 481, 5560
- Sidoli et al. (2001) Sidoli, L., Oosterbroek, T., Parmar, A. N., Lumb, D., & Erd, C. 2001, A&A, 379, 540
- Wachter et al. (2000) Wachter, S., Smale, A. P., & Bailyn, C. 2000, ApJ, 534, 367
- Zdziarski et al. (1996) Zdziarski, A. A., Johnson, W. N., & Magdziarz, P. 1996, MNRAS, 283, 193
- Życki et al. (1999) Życki, P. T., Done, C., & Smith, D. A. 1999, MNRAS, 309, 561