Spectro-timing analysis of MAXI J1535571 using AstroSat
Abstract
We report the results of the analysis of an AstroSat observation of the Black Hole candidate MAXI J1535571 during its Hard Intermediate state. We studied the evolution of the spectral and timing parameters of the source during the observation. The observation covered a period of 5 days and consisted of 66 continuous segments, corresponding to individual spacecraft orbits. Each segment was analysed independently. The source count rate increased roughly linearly by 30%. We modelled the spectra as a combination of radiation from a thermal disk component and a power-law. The timing analysis revealed the presence of strong Quasi Periodic Oscillations with centroid frequency fluctuating in the range 1.7–3.0 Hz. We found a tight correlation between the QPO centroid frequency and the power-law spectral index , while appeared not to be correlated with the linearly-increasing flux itself. We discuss the implications of these results on physical models of accretion.
keywords:
accretion, accretion disks – black hole physics – X-rays: binaries1 Introduction
Black-Hole Binaries (BHBs) are stellar systems in which one of the objects is a stellar-mass black hole and the companion star is typically a low-mass star that fills its Roche lobe, leading to accretion of matter onto the black hole, or a high-mass star feeding the black hole through its stellar wind. The majority of these systems are transient, with only a few known persistent sources. The evolution of their properties, in particular during transient outbursts when the accretion rate swing is large, is characterised by a series of source states, defined through the spectral and fast-variability properties (see Done et al., 2007; Belloni, 2010; Belloni et al., 2011).
The black hole binaries typically follow a hysteresis loop in the Hardness-Intensity diagram and different positions on this diagram correspond to different states of the system. The Low Hard state (LHS) of the system is characterised by a hard spectrum and high fractional rms variability (30%, Belloni, 2005). As the source evolves into a Hard-Intermediate State (HIMS) the spectrum of the source softens and indicates the presence of a thermalised disk. Low frequency Quasi Periodic Oscillations (QPOs) of type C are also detected in these states (Casella et al., 2005). The source can then evolve into a Soft-Intermediate state (SIMS) which is characterised by a softer spectrum with the disk component dominating the flux. Transient QPOs of Type A and B are also seen in the power spectrum from this state (Casella et al., 2005). The source then typically evolves into a High Soft state (HSS) in which the spectrum is strongly dominated by a thermalised disk. The power spectrum can be fitted with a flat power law. The source typically fades and returns to the LHS.
QPOs are ubiquitous features in the variability pattern of BH binary systems (see Belloni & Stella, 2014, and references therein). Low frequency QPOs (0.1–30 Hz) are associated with oscillations in the inner regions of the accretion disk. They are observed in the hard states, LHS and HIMS. Their energy spectrum indicates that their origin is connected to the high-energy component and not the thermal disk component. As their frequency is too low to be directly associated to Keplerian motion in the inner region of the accretion flow, models have concentrated on other physical time scales. The RPM model (Stella & Vietri, 1998; Stella et al., 1999) associates these oscillations to the Lense-Thirring precession frequency at a certain radius of the accretion flow. A more complex model connected to accretion has been proposed, which takes into account a broader precessing region surrounded by a thermal disk (Ingram & Done, 2011; Ingram, 2016, and references therein), as in the truncated-disk paradigm (see Done et al., 2007).
The study of the correlation between spectral and timing properties can help in constraining the theoretical models of accretion disks around a BH. In particular the dependence of the QPO centroid frequency on spectral parameters is a crucial observable. A deep study of the correlation between QPO centroid frequency () and slope of the high-energy power law () for the peculiar system GRS 1915+105 was conducted by Vignarca et al. (2003). In this work the authors extract and present this correlation also for other systems (GRO J1655-40, XTE J1550-564, XTE J1748-288 and 4U 1630-47), showing that it is a general property for BH binaries. The correlation is a positive one: higher QPO frequencies are associated to steeper energy spectra and a turnoff at high frequencies is observed. This work and subsequent works by Shaposhnikov & Titarchuk (2007) and Shaposhnikov & Titarchuk (2009) sample two different regimes of variations in the parameters: for GRS 1915+105 fast variations, within an hour, are considered, while for the other more conventional transient systems like Cygnus X-1 the values come from observations spread throughout an outburst, i.e. months.
MAXI J1535571 was \colorblackdiscovered independently by MAXI and Swift-BAT on September 02, 2017 (Negoro et al., 2017a; Markwardt et al., 2017). \colorblack Kennea et al. (2017) provided a more accurate position of the source using Swift-UVOT and Swift-XRT observations. Scaringi & ASTR211 Students (2017) reported the detection of an optical counterpart to MAXI J1535571, followed by the detection of near infrared radiation by Dincer (2017). Radio detection from ATCA (Russell et al., 2017) \colorblackand further brightening in the X-ray flux (Negoro et al., 2017b) suggested the nature of the compact object as a black hole. Mereminskiy & Grebenev (2017) detected low frequency QPOs at 1.9 Hz in Swift XRT observations conducted on September 11, 2018, indicating that the source was in the Hard-Intermediate state, i.e. in transition from the hard to the soft state. \colorblackMereminskiy et al. (2018) and Stiele & Kong (2018) discuss the evolution of the QPO frequency and observe a positive correlation between the QPO centroid frequency and the power law index of the spectrum, relating the QPO centroid frequency to the inner truncation radius of the disk, Mereminskiy et al. (2018) derive self-consistent results for the physical parameters of the inner Comptonising cloud. Xu et al. (2018) analyse the NuSTAR spectrum and constrain the spin of the black hole to and inner truncation radius to RISCO. \colorblackSreehari et al. (2019) and Sridhar et al. (2019) analyse the spectral properties of the source using the data from the AstroSat observation and constrain the mass of the source to 5.14–7.83 M⊙ and M⊙ respectively. Sreehari et al. (2019) also present the evolution of the timing parameters using Swift-XRT and LAXPC observations and classify the states of the source using the QPOs detected in in the power spectra.
In this paper, we report the result of the spectral-timing analysis of the AstroSat SXT+LAXPC data of MAXI J1535571 obtained over a period of five days and concentrate on the - correlation.
2 Observation and Data analysis
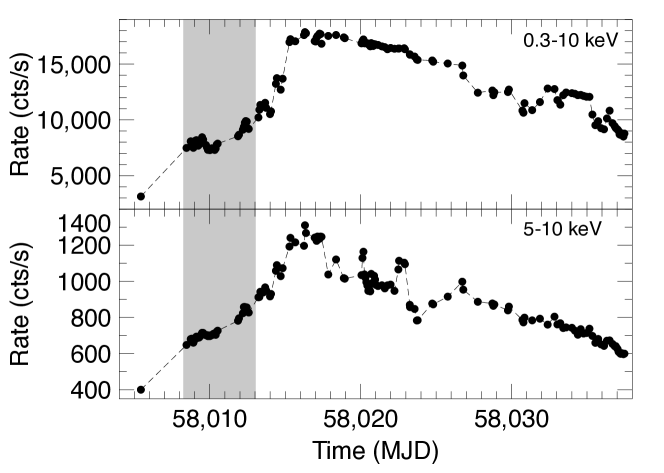
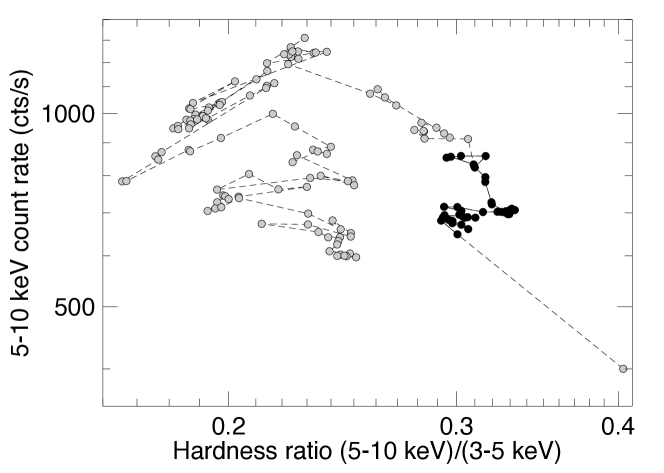
Based on a trigger from Negoro et al. (2017a), AstroSat (Singh et al., 2014) triggered a Target of Opportunity (ToO) observation (Observation ID: 01536) of MAXI J1535571 from September 12, 2017 (MJD 58008.2309) to September 17 2017 (MJD 58013.1545). The source was observed in the rising part of the outburst. In order to place the AstroSat data in the context of the outburst, we analyzed data from the Neutron star Interior Composition Explorer (NICER) mission on board the International Space Station (Gendreau et al., 2017a), which observed the target regularly over the period September 9 to October 11 2017 and provided a good picture of the overall evolution of the first part of the outburst. We extracted the NICER count rates from all detectors without background subtraction since the source is very bright and produced light curves in different energy bands as well as hardness ratios. In Figure 1, we show the NICER light curves in the full 0.3–10 keV energy band (top panel) and in the 5–10 keV energy band, closest to the LAXPC coverage. The grey band in the figure represents the time interval of the AstroSat observation. It is clear that AstroSat observed during an interval of roughly monotonic rise of flux in the 5–10 keV band, while the full NICER light curve is more complex and in particular shows a faster flux increase after the AstroSat coverage. The Hardness-Intensity Diagram (HID) from the NICER data, a useful tool to represent the evolution of a black-hole transient (see e.g. Belloni et al., 2011) is shown in Figure 2, where the points covering the AstroSat observation period are marked in black. The typical counter-clockwise evolution can be seen (Belloni et al., 2011), but in order to fully classify the source states additional timing analysis needs to be done (see below).
blackPrimary instruments onboard AstroSat which observed the outburst include the Soft X-ray Telescope (SXT) and the Large Area X-ray Proportional Counter (LAXPC). SXT is a focussing X-ray telescope which operates in the energy range of 0.3–8 keV with an energy resolution of 5–6% at 1.5 keV and an effective area of 128 cm2 at 1.5 keV (Singh et al., 2017). The observation of the source was carried out with SXT operating in Fast Window timing (FW) mode. This mode observes only the central 150150 pixels from the total 600600 pixels. Due to the large Point Spread Function (PSF) of SXT, the source occupied the complete field of view (FOV; 10′) in FW mode. However the smaller number of pixels to be read out allowed a better time resolution (0.278 s) than the full frame readout (2.37 s)
LAXPC is an X-ray proportional counter array operating in the range 3–80 keV with an energy resolution of 10–15% at 20 keV. The timing resolution of the instrument is 10 s with a dead time of 42 s. There are three identical detectors (referred to as LXP10, LXP20 and LXP30 respectively) on AstroSat with a combined effective area of 6000 cm2 (Yadav et al., 2016; Antia et al., 2017). LAXPC was operated in Event Analysis (EA) mode for the duration of the observation, which allowed for the data of individual photons to be available to the user.
2.1 Data reduction
blackThe data reduction of the AstroSat observation was done using the instrument pipelines provided by the respective Payload Operation Centres (POC). SXT data was reduced using SXT pipeline AS1SXTLevel2-1.4a and the calibration files released with the pipeline. LAXPC data was reduced using the LAXPC pipeline laxpc_make_event from the package laxpcsoft_Sep12_2017. The package also includes the calibration files for all the units of LAXPC.
To monitor the evolution of the source over the observation period we divided the observation into the 66 AstroSat orbits, which are separated by gaps due to Earth occultations and passage through the South Atlantic Anomaly (SAA). This resulted in 66 data segments roughly equally spaced and with comparable exposures. The brightness of the source allowed us to analyse the spectral and timing properties for each of the segments as each segment had a large number of source photons. The segment boundaries are listed in Table 1. Standard Good time intervals (GTIs) were applied to each of the segments to remove the section corresponding to occultation of the source by Earth and near the SAA region. The GTI were created using the tool laxpc_make_stdgti provided by the LAXPC POC. Some intervals showed count-rate dips that were identified as instrumental and removed. The orbit-wise data from SXT were merged using the sxtevtmerger tool provided by the SXT POC. The individual segments were extracted using xselect (HEASoft version 6.23) on the merged event file and the GTI used for LAXPC. For each orbit of AstroSat the SXT has a lower exposure than LAXPC due to additional constraints (including reflection from the earth, larger SAA window). Due to the jitter in satellite pointing, the SXT coverage is also lower as the source occasionally moved out of the reduced window used in the Fast Window (FW) mode.
2.2 Spectral analysis
The spectra for all the segments were extracted using xselect for SXT and laxpc_make_spectra for LAXPC. As the observation was conducted with the SXT operating in FW mode, all the photons observed by SXT were assumed to be from the source. The spectra from the LAXPC was extracted for all instrument layers. However, due to a gas leak in LXP30, the response of the detector is considered uncertain and thus the data from this unit were not used for the spectral analysis, while they were retained for timing analysis. For the SXT, as advised by the POC, standard response, ancillary response and background files were used for the analysis. In the case of the LAXPC, the responses were selected based on the spectral extraction and the background was modelled from the nearest blank-sky observation which had similar satellite position as the current observation.
The background estimates for both LXP10 and LXP20 are somewhat uncertain, so the spectra beyond 30 keV (where background starts dominating over the source) were ignored for the analysis. The response matrix modelling of SXT is uncertain below 0.8 keV due to the lack of a suitable calibration source. In our case, the source is brighter than the Crab and thus magnifies unmodelled instrumental features below 1 keV. Therefore, the data below 1 keV were ignored. To use the statistics in judging the quality of the model to explain the data, we grouped the data from SXT such that each energy bin has at least 20 counts. The LAXPC has sufficient counts in each energy bin to allow for the statistics but the rebinning of the channels was done logarithmically, keeping dE/E at 5% to account for the coarser energy resolution of the instrument. To account for the uncertainties in the response of the instruments a 3 % systematic error was added to the model.
Spectral analysis of NuSTAR data of MAXI J1535571 by Xu et al. (2018) indicates that the underlying compact object is a Black hole candidate. The authors have modelled the spectra by a thermal disk which is illuminated by a lamp post corona situated at . The authors also report that the source has a particularly high absorption column density ( cm-2). This value is slightly higher than the value reported in the preliminary analyses by Kennea (2017) (Swift/XRT; cm-2) and by Gendreau et al. (2017b) (NICER; cm-2). Xu et al. (2018) have attributed this to the inclusion of the thermal disk in their modelling of the spectra. The observations from these different instruments were conducted at different epochs and thus the variation in the observed absorption could be due to internal changes in the source.
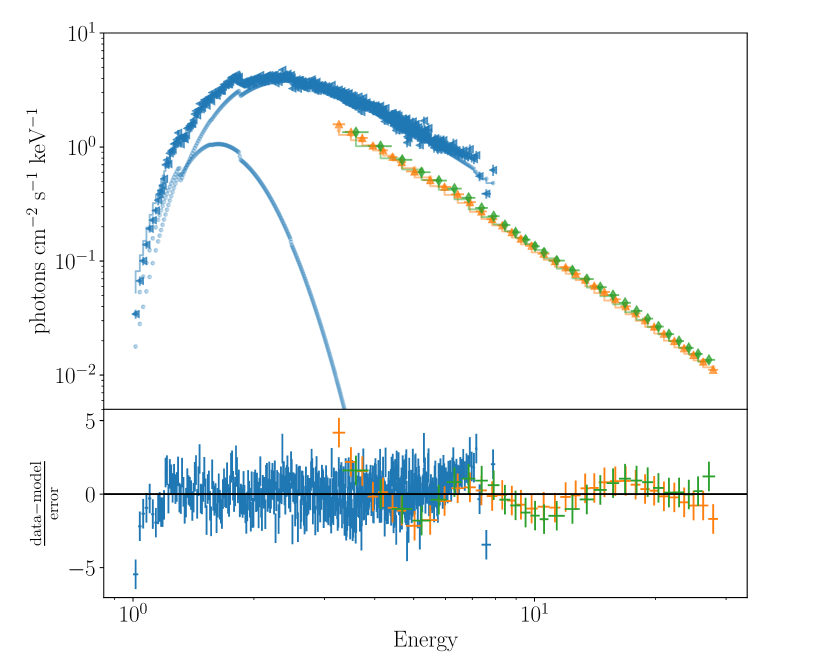
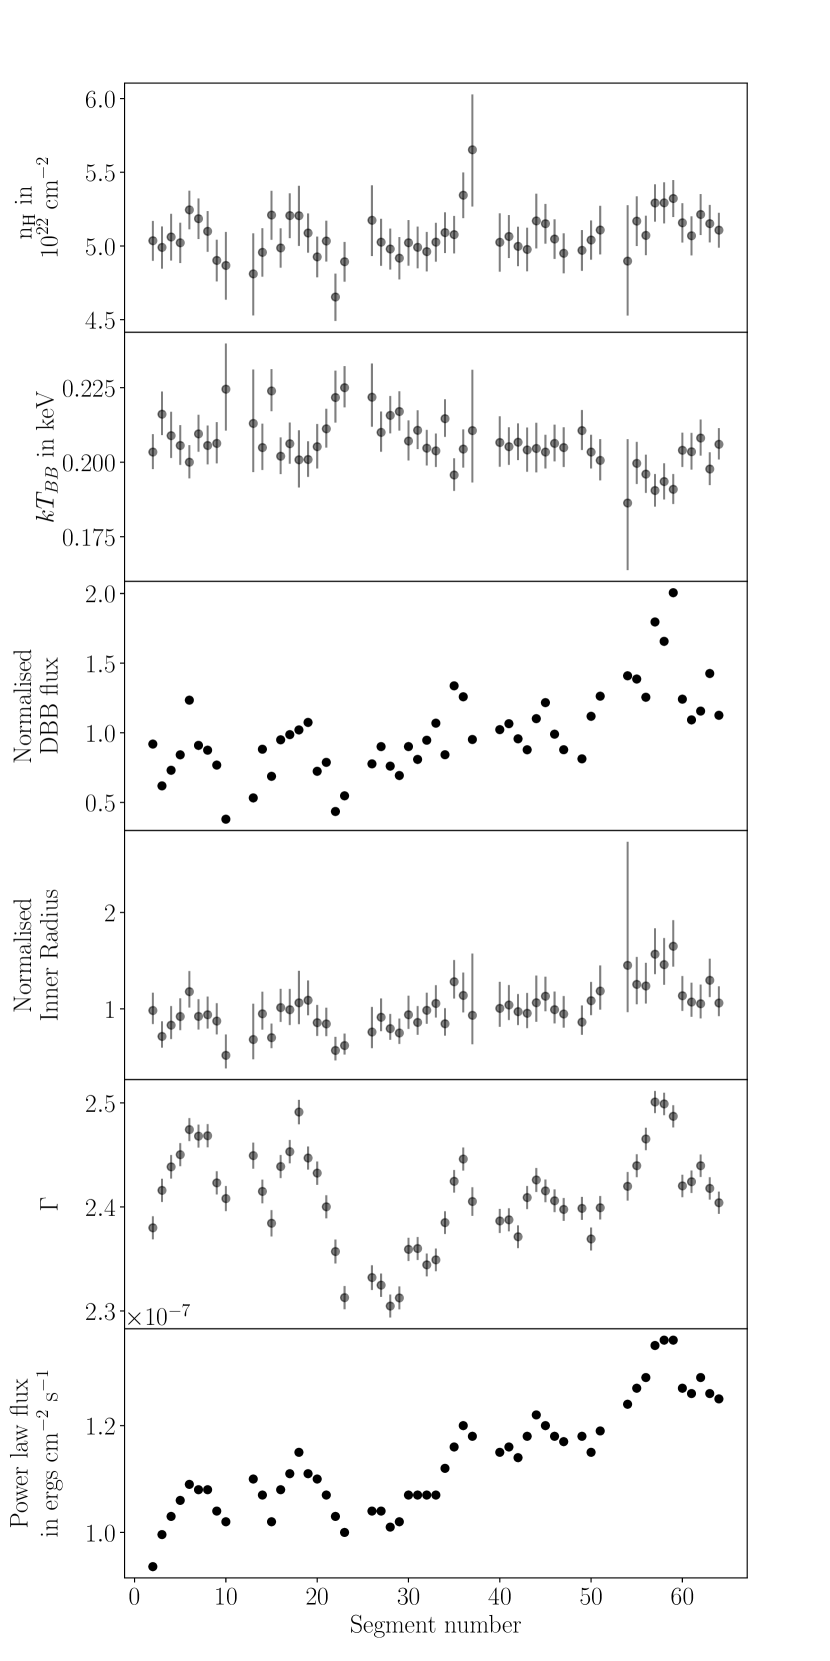
In the present work, we modelled the source spectrum using a thermal disk and a power-law component. We did not find a significant presence of the Fe K fluorescence line. \colorblackUsing the phenomenological model of Xu et al. (2018) for the iron line and response matrices of SXT and LAXPC, we simulated a spectrum for the exposure of a typical segment. We find that the iron line was not required to have an acceptable fit to the simulated spectrum. Thus we claim that the iron line cannot be detected at a significant level for an exposure of the typical segment. We find a strong iron line when the spectra of all the segments are combined, the analysis of which will be reported in a future work. The absorption column density was modelled by TbAbs with \colorblackthe abundances from Wilms et al. (2000) and the cross sections from Verner et al. (1996). The model provided a satisfactory fit to the data with a typical reduced chi squared value of 1.1 for 700 degrees of freedom. A typical spectrum and the residuals to the fitted model is shown in Figure 3. The time evolution of the best-fit parameters is shown in Figure 4. The absorption column density is around cm-2 for all the segments. \colorblackSreehari et al. (2019) and Sridhar et al. (2019) report a slightly lower value for the same observation. The difference in the NH is arising due to a difference in the ancillary response file (ARF) of SXT used by different authors. Our analysis uses the default on-axis ARF provided with the official pipeline. The inner disk temperature stays roughly constant around the typical value of 0.2 keV. The power-law flux and the disk flux increase over the observation, but with significant fluctuations that appear to be correlated. Interestingly, the power-law index does not show a secular increase over the course of the observation.
2.3 Timing analysis
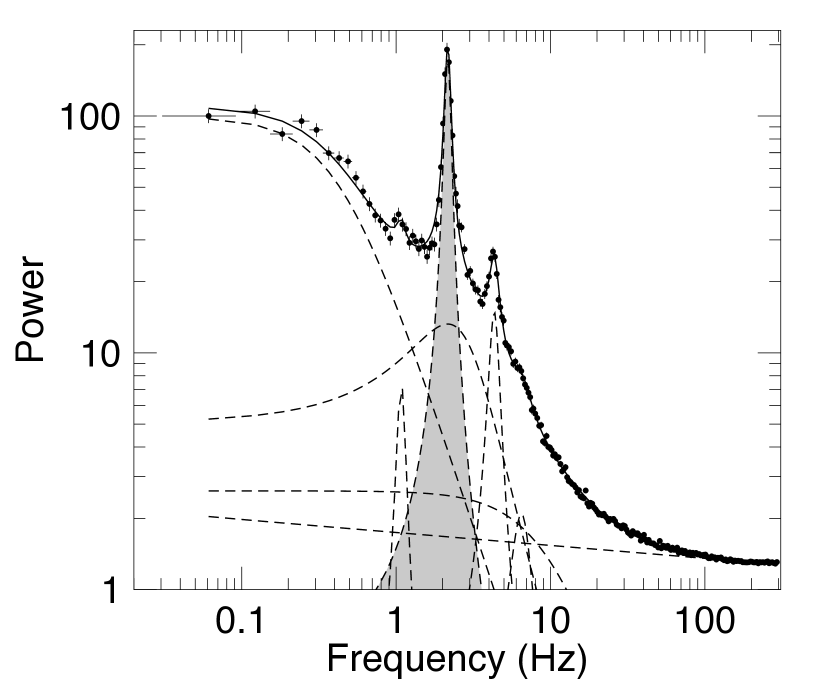
For each of the 66 segments, we produced power density spectra (PDS) from intervals of 16.384 s and averaged them. The final PDS were rebinned logarithmically before fitting. \colorblackThe PDS were extracted using the General High-energy Aperiodic Timing Software (GHATS version 1.1.1)111The software can be downloaded from http://www.brera.inaf.it/utenti/belloni/GHATS/Home.html. The software is written by TMB. . All the PDS display a clear QPO with harmonically related peaks. An example of a PDS is shown in Figure 5. The PDS were fitted with a model consisting of multiple Lorentzians: two flat-top components for the band-limited noise, up to four harmonically-related components for the QPO and its harmonics (sub-harmonic, fundamental, second harmonic and third harmonic, of which only the fundamental and the second harmonic are always detected) and a broad component for the Lh feature (see Belloni et al., 2002). In addition, a flat power-law component was added to fit the Poissonian noise contribution. The fits were limited to the 0.0625–300 Hz range.
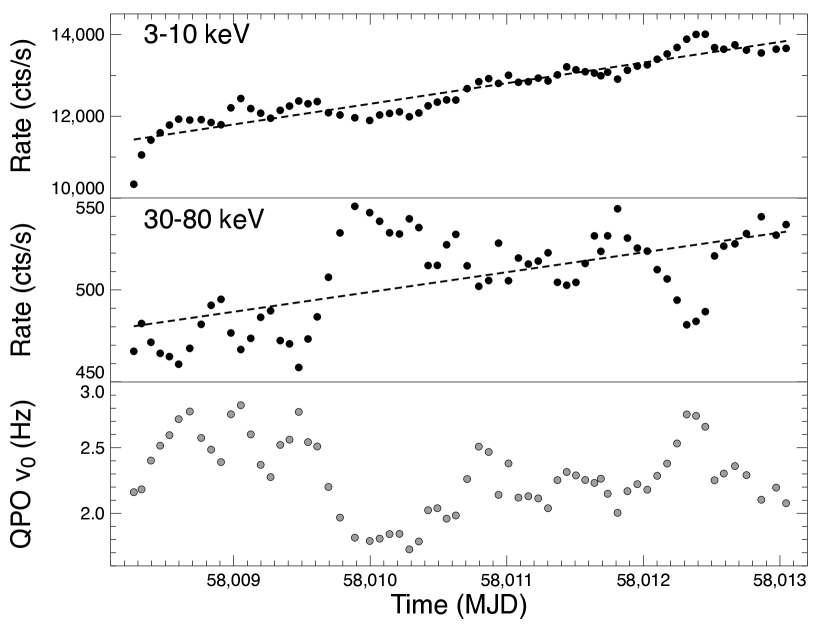
Here we focus on the centroid frequency of the QPO. The signal is so strong that its measurement is largely model-independent. While the source count rate (and flux) increased roughly linearly throughout the observation, the QPO frequency varied in the 1.7–2.8 Hz range with no apparent correlation with the count rate. This can be seen clearly in Figure 6. From the figure, one can see that the residuals from the linear fits to the two light curves are anti-correlated and
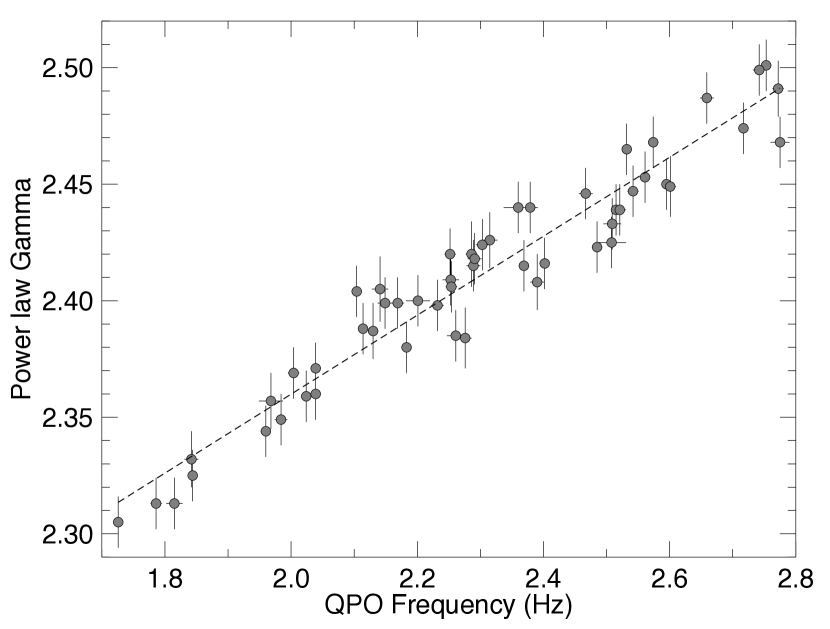
blackthat seems to have an anti-correlation with the residuals of the 30–80 keV countrate (and hence a possible positive correlation with those of 3–10 keV). Comparing the bottom panels of Figure 4 and Figure 6, we can see that the QPO frequency is indeed well correlated with the power-law photon index as determined from the combined SXT+LAXPC spectral fits. The correlation is very tight and can be seen in Figure 7.
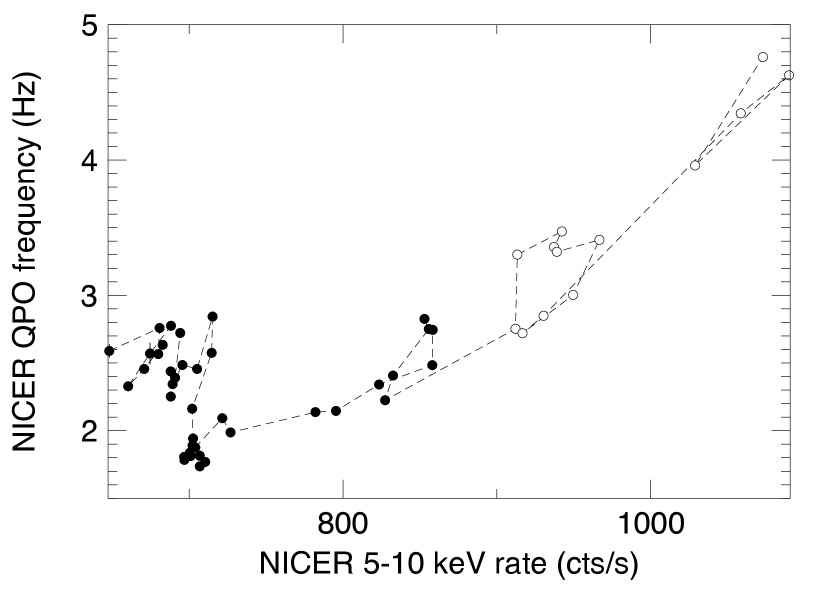
In order to put our results in a more general context of the outburst, we analysed the available NICER data of the rising part of the outburst of MAXI J1535571, corresponding to the points in Figure 1 before MJD 58015 (up to just before the large increase in count rate). The analysis was performed in the same way as described before for the AstroSat data using all available counts detected by NICER. The was also very clear and easy to detect in the PDS despite the fact that the typical segment duration was 6 minutes. In Figure 8 we plot the NICER as a function of the NICER 5–10 keV rate, chosen in order to be close to the laxpc energy band. The points corresponding to times overlapping with the AstroSat observing window are marked in black. One can see that the results are consistent for the overlapping period, with no correlation between frequency and count rate. However, after AstroSat stopped observing there is a clear positive correlation between the two parameters. \colorblackMereminskiy et al. (2018) and Stiele & Kong (2018) also perform a spectro-timing analysis of this source and observe a similar positive correlation between the and power law index. The extent of the observations analysed by these authors is larger than the AstroSat observation window and thus the tight correlation we observe is a subset of the correlation observed by them.
3 Discussion
We have performed a spectro-timing analysis of the black hole binary MAXI J1535571 using the observation conducted by AstroSat during the Hard Intermediate state of the source. The sources exhibits a secular roughly linear increase in the flux during the course of the observation. Fluctuations over the secular increase were observed in both softer and harder energy bands. The residuals from the linear fit for 3–10 keV and 30–80 keV are observed to be anticorrelated.
The energy spectrum of the source was modelled using an absorbed thermal disk blackbody with a power law as a non-thermal component. The high intrinsic absorption reported by (Gendreau et al., 2017b; Kennea, 2017; Xu et al., 2018) is also seen in current observation. The disk temperature remains typically around 0.2 keV with significant deviations in some segments. The secular increase in the total flux reflects an increase in both the flux of the non-thermal component and that of the thermal component (see Figure 4). The power-law index of the hard component does not show a secular variation, but oscillates between 2.3 and 2.5, clearly being the cause of the anticorrelation in the residuals from the linear fits to the flux evolution in different bands. The oscillations are not random, but seem to follow a random walk around 2.4, with small variations between adjacent segments.
The PDS for individual segments show band-limited noise and a prominent QPO, with harmonics and subharmonics present in some of the segments. This shape of the PDS is typical of the HIMS (see Belloni et al., 2011).
The centroid frequency of the QPO as a function of time (see Figure 6) oscillates between 1.7 Hz and 3.0 Hz and the oscillations follow those of the power-law index very closely (Figure 7). \colorblackThe correlation for a larger observation window has been reported by Mereminskiy et al. (2018) and Stiele & Kong (2018) but due to sparser observations, the correlation is not as tight as seen in the present work. The trend observed by Mereminskiy et al. (2018) resembles the correlation observed for GRS 1915+105 (Shaposhnikov & Titarchuk, 2007)
Such correlation has been previously observed in several BHBs (Vignarca et al., 2003) and provides a tight link between the QPO and the hard-component emission. In that work, the correlation was found on time scales of minutes in GRS 1915+105 and on scales of days-months for other transient BHBs. Here we follow the QPO over five days. \colorblackFürst et al. (2016) also observe an extremely tight correlation of the QPO centroid frequency and power law index in GX 3394 in the frequency range of 0.6–1 Hz and of 1.66-1.8. The authors estimate the mass of the BH using a scaling relation provided by Shaposhnikov & Titarchuk (2007).
The typical evolution of the outburst of a transient BHB is described best in the hardness-intensity diagram, where a counterclockwise path is followed. In the right “vertical” branch, corresponding to the LHS, the flux increases, the power-law index is well correlated with it and the frequencies of the timing features, although no peaked QPO is usually observed, also increase (see Motta et al., 2009; Motta et al., 2011). Since the spectrum gradually softens, this branch is not really vertical. In the top “horizontal” branch the spectrum softens further, with the power-law index increasing in absolute value. The flux usually continues to increase, although not as fast as before, and the QPO frequency is correlated with both flux and . Given the shape of the PDS and the values of the power-law index, our observations are clearly on the HIMS branch. As described before, usually both the LHS and the HIMS branch see a correlation between frequencies of variability components, the flux and the power-law index. In our AstroSat data we see the absence of a correlation with flux, although in the NICER data following our observation this correlation is present. This clearly shows that the QPO frequency is related to the energy spectral shape and not to the flux in either of the two main components. In a thermal-Comptonization scenario the index of the hard component steepens as the population of electrons cools due to the increase in soft photon input (see e.g. Motta et al., 2009). However, from Figure 4 we can see that this is not the case here, as the secular increase in disk flux is not followed by . Another parameter that determines is the optical depth of the cloud : for a spherical cloud and input photon energy much lower than the temperature of the electron cloud we have where (Sunyaev & Truemper, 1979; Sunyaev & Titarchuk, 1980). Therefore in order to keep from varying when the cloud temperature decreases is to increase in a very specific way. Fluctuations in this relation could in principle give rise to the observed fluctuations in , but it would be very ad hoc.
Within the model that associates the low-frequency QPO with Lense-Thirring precession of the inner part of the accretion flow (see Ingram & Done, 2011; Ingram, 2016, and references therein) the QPO frequency is related to the size of the inner flow portion that precesses. With increasing accretion rate this region becomes smaller and the frequency increases. In our case, if the flux is a proxy for accretion rate, then this does not work. The same can be said of the Transition-Layer model (see Titarchuk & Fiorito, 2004; Shaposhnikov & Titarchuk, 2009), where also QPO frequency is related to accretion rate. \colorblackXu et al. (2017) attribute the increase of the QPO frequency to the inward motion of the inner accretion edge, which they test by comparing the QPO frequency with the inner truncation radius obtained from the spectral fitting. The inner hot component being optically thin could explain the non thermal emission observed in MAXI J1535571.
blackThe correlation between the QPO frequency and the power law index is observed to be tighter than the correlation between the QPO frequency and the flux in the duration of the AstroSat observation. The correlation between QPO frequency and flux picks up subsequent to the AstroSat observation. The strong correlation we observe implies that the fluctuations manifesting as QPOs are closely related to the comptonising region as opposed to typical models assuming the origin of QPOs in the accretion disk.
In conclusion, the - relation, which is a common property of the hard states of BHBs (LHS and HIMS), appears here more complex than previously known and its origin must be investigated in detail, as none of the current models appears to be able to reproduce the results of this observation.
Acknowledgements
This work makes use of data from the AstroSat mission of the Indian Space Research Organisation (ISRO), archived at Indian Space Science Data Centre (ISSDC). The authors would like to acknowledge the support from the LAXPC Payload Operation Center (POC) and SXT POC at the TIFR, Mumbai for providing support in data reduction. YB acknowledges the help of his colleagues in understanding the AstroSat data. This work has been supported by the Executive Programme for Scientific and Technological cooperation between the Italian Republic and the Republic of India for the years 2017-2019 under project IN17MO11 (INT/Italy/P-11/2016 (ER)). TMB acknowledges financial contribution from the agreement ASI-INAF n.2017-14-H.0.
References
- Antia et al. (2017) Antia H. M., et al., 2017, ApJS, 231, 10
- Belloni (2005) Belloni T., 2005, in Burderi L., Antonelli L. A., D’Antona F., di Salvo T., Israel G. L., Piersanti L., Tornambè A., Straniero O., eds, American Institute of Physics Conference Series Vol. 797, Interacting Binaries: Accretion, Evolution, and Outcomes. pp 197–204 (arXiv:astro-ph/0504185), doi:10.1063/1.2130233
- Belloni (2010) Belloni T. M., 2010, in Belloni T., ed., Lecture Notes in Physics, Berlin Springer Verlag Vol. 794, Lecture Notes in Physics, Berlin Springer Verlag. p. 53 (arXiv:0909.2474), doi:10.1007/978-3-540-76937-8_3
- Belloni & Stella (2014) Belloni T. M., Stella L., 2014, Space Sci. Rev., 183, 43
- Belloni et al. (2002) Belloni T., Psaltis D., van der Klis M., 2002, ApJ, 572, 392
- Belloni et al. (2011) Belloni T. M., Motta S. E., Muñoz-Darias T., 2011, Bulletin of the Astronomical Society of India, 39, 409
- Casella et al. (2005) Casella P., Belloni T., Stella L., 2005, ApJ, 629, 403
- Dincer (2017) Dincer T., 2017, The Astronomer’s Telegram, 10716, 1
- Done et al. (2007) Done C., Gierliński M., Kubota A., 2007, A&ARv, 15, 1
- Fürst et al. (2016) Fürst F., et al., 2016, ApJ, 828, 34
- Gendreau et al. (2017a) Gendreau K., Arzoumanian Z., NICER Team 2017a, in American Astronomical Society Meeting Abstracts #229. p. 309.03
- Gendreau et al. (2017b) Gendreau K., et al., 2017b, The Astronomer’s Telegram, 10768
- Ingram (2016) Ingram A. R., 2016, Astronomische Nachrichten, 337, 385
- Ingram & Done (2011) Ingram A., Done C., 2011, MNRAS, 415, 2323
- Kennea (2017) Kennea J. A., 2017, The Astronomer’s Telegram, 10731
- Kennea et al. (2017) Kennea J. A., Evans P. A., Beardmore A. P., Krimm H. A., Romano P., Yamaoka K., Serino M., Negoro H., 2017, The Astronomer’s Telegram, 10700
- Markwardt et al. (2017) Markwardt C. B., Burrows D. N., Cummings J. R., Kennea J. A., Marshall F. E., Page K. L., Palmer D. M., Siegel M. H., 2017, GRB Coordinates Network, 21788, 1
- Mereminskiy & Grebenev (2017) Mereminskiy I. A., Grebenev S. A., 2017, The Astronomer’s Telegram, 10734, 1
- Mereminskiy et al. (2018) Mereminskiy I. A., Grebenev S. A., Prosvetov A. V., Semena A. N., 2018, Astronomy Letters, 44, 378
- Motta et al. (2009) Motta S., Belloni T., Homan J., 2009, MNRAS, 400, 1603
- Motta et al. (2011) Motta S., Muñoz-Darias T., Casella P., Belloni T., Homan J., 2011, MNRAS, 418, 2292
- Negoro et al. (2017a) Negoro H., et al., 2017a, The Astronomer’s Telegram, 10699
- Negoro et al. (2017b) Negoro H., et al., 2017b, The Astronomer’s Telegram, 10708
- Russell et al. (2017) Russell T. D., Miller-Jones J. C. A., Sivakoff G. R., Tetarenko A. J., Jacpot Xrb Collaboration 2017, The Astronomer’s Telegram, 10711, 1
- Scaringi & ASTR211 Students (2017) Scaringi S., ASTR211 Students 2017, The Astronomer’s Telegram, 10702, 1
- Shaposhnikov & Titarchuk (2007) Shaposhnikov N., Titarchuk L., 2007, ApJ, 663, 445
- Shaposhnikov & Titarchuk (2009) Shaposhnikov N., Titarchuk L., 2009, ApJ, 699, 453
- Singh et al. (2014) Singh K. P., et al., 2014, in Space Telescopes and Instrumentation 2014: Ultraviolet to Gamma Ray. p. 91441S, doi:10.1117/12.2062667
- Singh et al. (2017) Singh K. P., et al., 2017, Journal of Astrophysics and Astronomy, 38, 29
- Sreehari et al. (2019) Sreehari H., Ravishankar B. T., Iyer N., Agrawal V. K., Katoch T. B., Mandal S., Nand i A., 2019, MNRAS, p. 1270
- Sridhar et al. (2019) Sridhar N., Bhattacharyya S., Chandra S., Antia H. M., 2019, arXiv e-prints, p. arXiv:1905.09253
- Stella & Vietri (1998) Stella L., Vietri M., 1998, ApJ, 492, L59
- Stella et al. (1999) Stella L., Vietri M., Morsink S. M., 1999, ApJ, 524, L63
- Stiele & Kong (2018) Stiele H., Kong A. K. H., 2018, ApJ, 868, 71
- Sunyaev & Titarchuk (1980) Sunyaev R. A., Titarchuk L. G., 1980, A&A, 86, 121
- Sunyaev & Truemper (1979) Sunyaev R. A., Truemper J., 1979, Nature, 279, 506
- Titarchuk & Fiorito (2004) Titarchuk L., Fiorito R., 2004, ApJ, 612, 988
- Verner et al. (1996) Verner D. A., Ferland G. J., Korista K. T., Yakovlev D. G., 1996, ApJ, 465, 487
- Vignarca et al. (2003) Vignarca F., Migliari S., Belloni T., Psaltis D., van der Klis M., 2003, A&A, 397, 729
- Wilms et al. (2000) Wilms J., Allen A., McCray R., 2000, ApJ, 542, 914
- Xu et al. (2017) Xu Y., et al., 2017, ApJ, 851, 103
- Xu et al. (2018) Xu Y., et al., 2018, ApJ, 852, L34
- Yadav et al. (2016) Yadav J. S., et al., 2016, in Space Telescopes and Instrumentation 2016: Ultraviolet to Gamma Ray. p. 99051D, doi:10.1117/12.2231857
| Segment number | Start timea (in s) | End Timea (in s) | Power law index | QPO frequency (in Hz) | ||
|---|---|---|---|---|---|---|
| 1 | 0 | 3735.296 | — | |||
| 2 | 3735.296 | 9777.92 | ||||
| 3 | 9777.92 | 15622.784 | ||||
| 4 | 15622.784 | 21468.8 | ||||
| 5 | 21468.801 | 27314.048 | ||||
| 6 | 27314.049 | 33160.064 | ||||
| 7 | 33160.062 | 41366.911 | ||||
| 8 | 41366.91 | 47638.911 | ||||
| 9 | 47638.91 | 53910.911 | ||||
| 10 | 53910.91 | 60166.529 | ||||
| 11 | 60166.527 | 66405.759 | — | |||
| 12 | 66405.758 | 72710.525 | — | |||
| 13 | 72710.531 | 78982.525 | ||||
| 14 | 78982.531 | 85254.525 | ||||
| 15 | 85254.531 | 91526.915 | ||||
| 16 | 91526.914 | 97453.697 | ||||
| 17 | 97453.695 | 103283.329 | ||||
| 18 | 103283.328 | 109129.345 | ||||
| 19 | 109129.344 | 114975.361 | ||||
| 20 | 114975.359 | 120823.806 | ||||
| 21 | 120823.805 | 129158.915 | ||||
| 22 | 129158.914 | 135430.915 | ||||
| 23 | 135430.906 | 147942.525 | ||||
| 24 | 147942.531 | 154230.915 | — | |||
| 25 | 154230.906 | 160502.915 | — | |||
| 26 | 160502.906 | 166774.915 | ||||
| 27 | 166774.906 | 173046.915 | ||||
| 28 | 173046.906 | 179269.759 | ||||
| 29 | 179269.766 | 185114.618 | ||||
| 30 | 185114.625 | 190944.634 | ||||
| 31 | 190944.641 | 196807.04 | ||||
| 32 | 196807.047 | 202653.056 | ||||
| 33 | 202653.062 | 208485.884 | ||||
| 34 | 208485.891 | 216951.29 | ||||
| 35 | 216951.297 | 223223.29 | ||||
| 36 | 223223.297 | 229446.15 | ||||
| 37 | 229446.141 | 235718.15 | ||||
| 38 | 235718.141 | 242023.29 | — | |||
| 39 | 242023.297 | 248295.29 | — | |||
| 40 | 248295.297 | 254567.29 | ||||
| 41 | 254567.297 | 260839.29 | ||||
| 42 | 260839.297 | 266931.072 | ||||
| 43 | 266931.062 | 272775.947 | ||||
| 44 | 272775.938 | 278621.197 | ||||
| 45 | 278621.188 | 284467.572 | ||||
| 46 | 284467.594 | 290313.603 | ||||
| 47 | 290313.594 | 296157.322 | ||||
| 48 | 296157.312 | 298470.915 | — | |||
| 49 | 298470.906 | 304742.915 | ||||
| 50 | 304742.906 | 311014.915 | ||||
| 51 | 311014.906 | 317237.759 | ||||
| 52 | 317237.75 | 323542.54 | — | |||
| 53 | 323542.531 | 329814.54 | — | |||
| 54 | 329814.531 | 336086.915 | ||||
| 55 | 336086.906 | 342358.915 | ||||
| 56 | 342358.906 | 348630.915 | ||||
| 57 | 348630.906 | 354590.478 | ||||
| 58 | 354590.469 | 360436.478 | ||||
| 59 | 360436.469 | 366298.884 | ||||
| 60 | 366298.875 | 372128.509 | ||||
| 61 | 372128.5 | 377974.54 | ||||
| 62 | 377974.531 | 386263.29 | ||||
| 63 | 386263.281 | 392535.29 | ||||
| 64 | 392535.281 | 405030.134 | ||||
| 65 | 405030.156 | 411334.915 | — | |||
| 66 | 411334.906 | 417623.29 | — |
a Measured from MJD 58008.24759259