Supplemental Information for: Dynamics of a Persistent Insulator-to-Metal Transition in Strained Manganite Films
I Methods
Static conductivity measurements were performed using a conventional THz time-domain spectroscopy (THz-TDS) setup. The THz pulses were produced by optical rectification in a lithium niobate crystal using 1 mJ pulses, and were collected and focused into the samples using a pair of off-axis parabolic reflectors. The THz focal spot was mm diameter at the sample. The waveform was measured using conventional electro-optic (EO) sampling in a 1 mm ZnTe crystal. The excitation pulse was directed onto the sample at normal incidence through a 3 mm hole in the off-axis parabolic reflector. This ensured that that the optical pump pulse was larger than the THz probe pulse. The pulse energy was attenuated using a half waveplate and polarizer, and was blocked downstream of the sample using a Teflon beam block. As mentioned in the main text, the sample was reset by temperature cycling after each measurement of the photoswitched material.
From the time-domain spectroscopy measurements, the conductivity was determined from the experimentally measured THz transmission spectrum, using the Tinkham equation,
| (1) |
where was the refractive index of the NGO substrate, also measured by THz-TDS, is the impedance of free space, and is the film thickness.
The single-shot THz measurements were performed using dual-echelons for EO sampling (Teo et al., 2015). The echelons generated the time-delayed optical pulses needed to readout the THz waveform. They were focused into the ZnTe crystal and then subsequently imaged onto a scientific CMOS (ANDOR Zyla 5.5, 2560 2048 pixels, 16 bit, 30 Hz maximum full-chip acquisition rate) with a magnification. Polarization gated balancing was accomplished using a quarter waveplate and small-angle splitting Wollaston prism. As with the single-shot optical measurements, the number of pulses was limited using a mechanical shutter and external Pockels cell.
II Transient Reflectively Model
Tables 1 and 2 show the parameters for the effective medium model used in this work. Highlighted rows are sensitive to photoexcitation.
| (eV) | (eV) | (eV) | |
|---|---|---|---|
| 1 | 0.888 | 0.6552 | 0.4477 |
| 2 | 1.691 | 2.749 | 0.496 |
| 3 | 4.226 | 5.258 | 1.872 |
| 4 | 8.564 | 15.351 | 5.219 |
| (eV) | (eV) | (eV) | |
|---|---|---|---|
| 1 | 0 | 0.3555 | 1.213 |
| 2 | 1.899 | 1.00 | 0.987 |
| 3 | 4.142 | 4.616 | 1.41 |
| 4 | 8.564 | 15.35 | 5.21 |
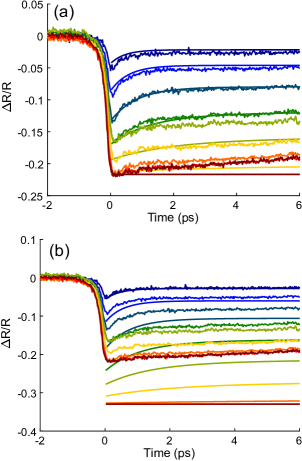
Following the work of Beaud et al, we construct a time-dependent Ginzburg-Landau model to understand the time-dependent optical reflectivity at early times. Below we describe this process in more detail. First, we construct the time-dependent excitation density, as described in the text, and use it to derive a depth-dependent order parameter, and then to the fraction of the material switched. Starting from eq. 1 in the text:
| (2) |
| (3) |
The dielectric function as a function of can then be calculated as
| (4) |
Where and are the insulating and metallic dielectric functions, respectively. We then use a multilayer propagation matrix reflectivity model with 20 layers plus the substrate dielectric function to calculate the time-dependent reflectivity. The probe light is incident at a 45 degree angle, nm, p-polarized. Fig. S1 shows the results of the model without depth dependent X (bottom panel), and without depth-dependent X, but an arbitrary rescaling of the overall reflectivity to match the saturation value observed experimentally (top panel). This model does not assume anything about the size or shape of the mixture, nor whether the new phase is distributed over depth or by lateral domains. While more sophisticated effective-medium models like the Maxwell-Garnett model can also be used to describe this mixture, there is no significant improvement in agreement between experiment and our simulations when using a more complex model for the dielectric function of the photoexcited state.
III Optical-pump THz Probe of switched film
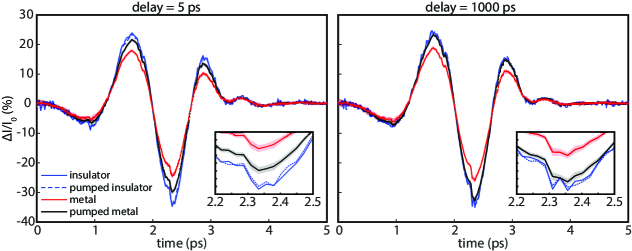
Figure S2 shows single-shot THz waveforms collected on the 36 nm LMCO film under different conditions: the pristine insulator (solid blue), the photoexcited insulator (dashed blue), switched metal (solid red), and photoexcited metal (solid black). The time-delay (a) and (b) are 5 ps and 1000 ps, respectively. Figure S2(a) is also shown in the main text. These data illustrate the dynamics of the single-shot THz response following photoexcitation. The data also illustrate the findings of the paper – the difference in conductivity between the pristine insulator and the photoexcited insulator remains small even at long time delays. In comparison, there is a noticable change in the conductivity of the metallic LCMO upon photoexcitation.
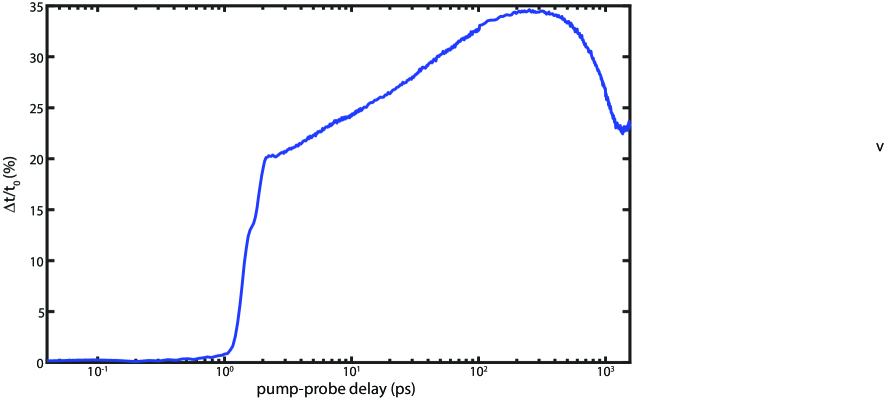
We also confirmed that the behavior of the LCMO film after photoswitching is qualitatively similar to that of bulk LCMO by performing conventional time-resolved THz measurements. A sample dataset are shown in figure S3. Here, the relative change in the transmission at the peak of the THz waveform, was measured at a variety of time delays following a 4 mJ/cm2 fluence pulse. Time zero is set to 1 ps so that the data can be plotted on a log scale. As in Ref. Averitt et al. (2001), we observe an initial fast increase in the THz transmission following photoexcitation, followed by a slower rise at longer timescales. These are consistent with the previously observed heating of the electron system, followed by subsequent heating of the lattice subsystem, through electron-phonon coupling, and spin subsystem, by spin-orbit coupling and momentum scattering. The previous measurements only went out to 100s of ps time delay, while here we measure out to 1.5 ns delay. We observe that after the slow rise there is a similarly slow decay on the THz transmission. This is likely due to heat transfer into the substrate, which leads to cooling of the sample and a rise in the conductivity.
References
- Teo et al. (2015) S. M. Teo, B. K. Ofori-Okai, C. A. Werley, and K. A. Nelson, Review of Scientific Instruments 86, 051301 (2015).
- Averitt et al. (2001) R. D. Averitt, A. I. Lobad, C. Kwon, S. A. Trugman, V. K. Thorsmølle, and A. J. Taylor, Physical Review Letters 87, 017401 (2001).