Icahn School of Medicine at Mount Sinai
New York NY 10029, USA
11email: yading.yuan@mssm.edu
A Deep Regression Model for Seed Localization in Prostate Brachytherapy
Abstract
Post-implant dosimetry (PID) is an essential step of prostate brachytherapy that utilizes CT to image the prostate and allow the location and dose distribution of the radioactive seeds to be directly related to the actual prostate. However, it it a very challenging task to identify these seeds in CT images due to the severe metal artifacts and high-overlapped appearance when multiple seeds clustered together. In this paper, we propose an automatic and efficient algorithm based on 3D deep fully convolutional network for identifying implanted seeds in CT images. Our method models the seed localization task as a supervised regression problem that projects the input CT image to a map where each element represents the probability that the corresponding input voxel belongs to a seed. This deep regression model significantly suppresses image artifacts and makes the post-processing much easier and more controllable. The proposed method is validated on a large clinical database with 7820 seeds in 100 patients, in which 5534 seeds from 70 patients were used for model training and validation. Our method correctly detected 2150 of 2286 (94.1%) seeds in the 30 testing patients, yielding 16% improvement as compared to a widely-used commercial seed finder software (VariSeed, Varian, Palo Alto, CA).
Keywords:
3D deep fully convolutional networkseed localizationprostate brachytherapy.1 Introduction
With estimated 174,650 new cases and 31,620 deaths in 2019, prostate cancer remains the most common type of cancer diagnosed in men in the US [1]. Seed implant brachytherapy, which involves permanent implantation of radioactive sources (seeds) within the prostate gland, is the standard option for low and intermediate risk prostate cancer [2]. Despite various improvements in planning and seed delivery, the actual radiation dose distribution may deviate from the plan due to various factors such as needle positioning variations, prostate deformation, seed delivery variations and seed migration. Therefore, post-implant dosimetry (PID) is recommended to assure the quality of the implantation and to establish the relationship between radiation dose and clinical outcomes [3]. PID is typically performed at day 30 following implantation that utilizes CT to image the implanted area, from which prostate and surrounding organs at risk (OARs) are outlined and seed locations are identified.
Accurate localization of implanted seeds is essential to quantify the dose distribution to those organs. However, manual identification of these seeds is time consuming given a large number of seeds implanted, typically taking 10 - 20 minutes to identify 60 to 100 seeds per patient. Therefore, accurate and automated methods for seed localization are of great demand. While the radio-opaque seeds appear with high contrast on the CT images, automatic seed localization is in practice a challenging task due to the following two unique characteristics, as shown in Fig. 1. Firstly, the presence of fudicial markers introduces severe metal artifacts on CT images, which significantly increases the complexity of seed identification. Secondly, due to seed delivery variations and seed migration, some implanted seeds are very close to each other to form seed clusters. This highly-overlapped appearance make it hard to identify individual seed on CT images.

Several automatic approaches have been developed to localize seeds in CT images such as geometry-based recognition method [4] and Hough transform [5]. Recently, Nguyen et al. [6] proposed a cascaded method that involves thresholding and connected component analysis as initial detection of seed candidates, and followed by a modified k-means method to separate groups of seeds based on a priori intensity and volume information. Zhang et al. [7] employed canny edge detection and an improved concave points matching to separate touching seeds after gray-level-histogram based thresholding. All these methods use hand-crafted features that require specialized domain knowledge. Meanwhile, sophisticated pre- and post-processing steps are usually introduced to facilitate the seed localization procedure. As a result, the evaluation of these methods was mainly conducted with physical phantom or small amount of clinical cases.
Recently, deep convolutional neural networks (CNNs) have become popular in medical image analysis [8] and have achieved state-of-the-art performance in various medical image computing tasks such as lung nodule detection [9], gland instance segmentation in histology images [10], liver and tumor segmentation [11], skin lesion segmentation [12] and classification [13]. Due to the capability of learning hierarchical features directly from raw image data, CNNs usually yield better generalization performance especially when evaluating on a large scale of dataset.
Enlightened by the latest advances in deep learning research, we propose a novel framework based on deep CNNs to automatically localize the implanted seeds in 3D CT images. Our contributions in this paper are three fold. Firstly, we model seed localization as a regression problem and introduce a fully automated solution by leveraging the discriminative power of deep CNNs. To the best of our knowledge, this is the first attempt of using deep neural networks to tackle this challenging task. Secondly, instead of directly predicting the seed coordinates in 3D space, we design a probability map of seed locations to account for the uncertainty of manual identification, which improves the robustness of model prediction. Finally, we evaluated the proposed method on a large clinical database with seeds in 100 patients, and compared the results with a commercial seed finder software (VariSeed, Varian, Palo Alto, CA).

2 Methodology
2.1 Deep Regression Model
As shown in Fig. 1, the ground truth is provided as dot annotations, where each dot corresponds to one seed. However, considering the seed has a finite dimension (about 0.8 mm in diameter and 4.5 mm in length), any dot annotation should be considered as correct as long as it’s located on the seed. As a result, a large variation can be observed in the ground truth in terms of the annotation positions on the seeds, which makes it unnecessarily challenging and prone to overfitting if the exact annotation positions are directly used as learning target. Instead, we convert the discrete dot annotations into a continuous probability map () and cast the seed localization task as a supervised regression problem that learns a mapping between a 3D CT image set and , denoted as for the inferred probability map and the learned parameters (weights).
For each training image that is annotated with a set of 3D points , where is the total number of seeds annotated by the user, we define the ground truth probability map to be a kernel density estimation based on the provided points:
| (1) |
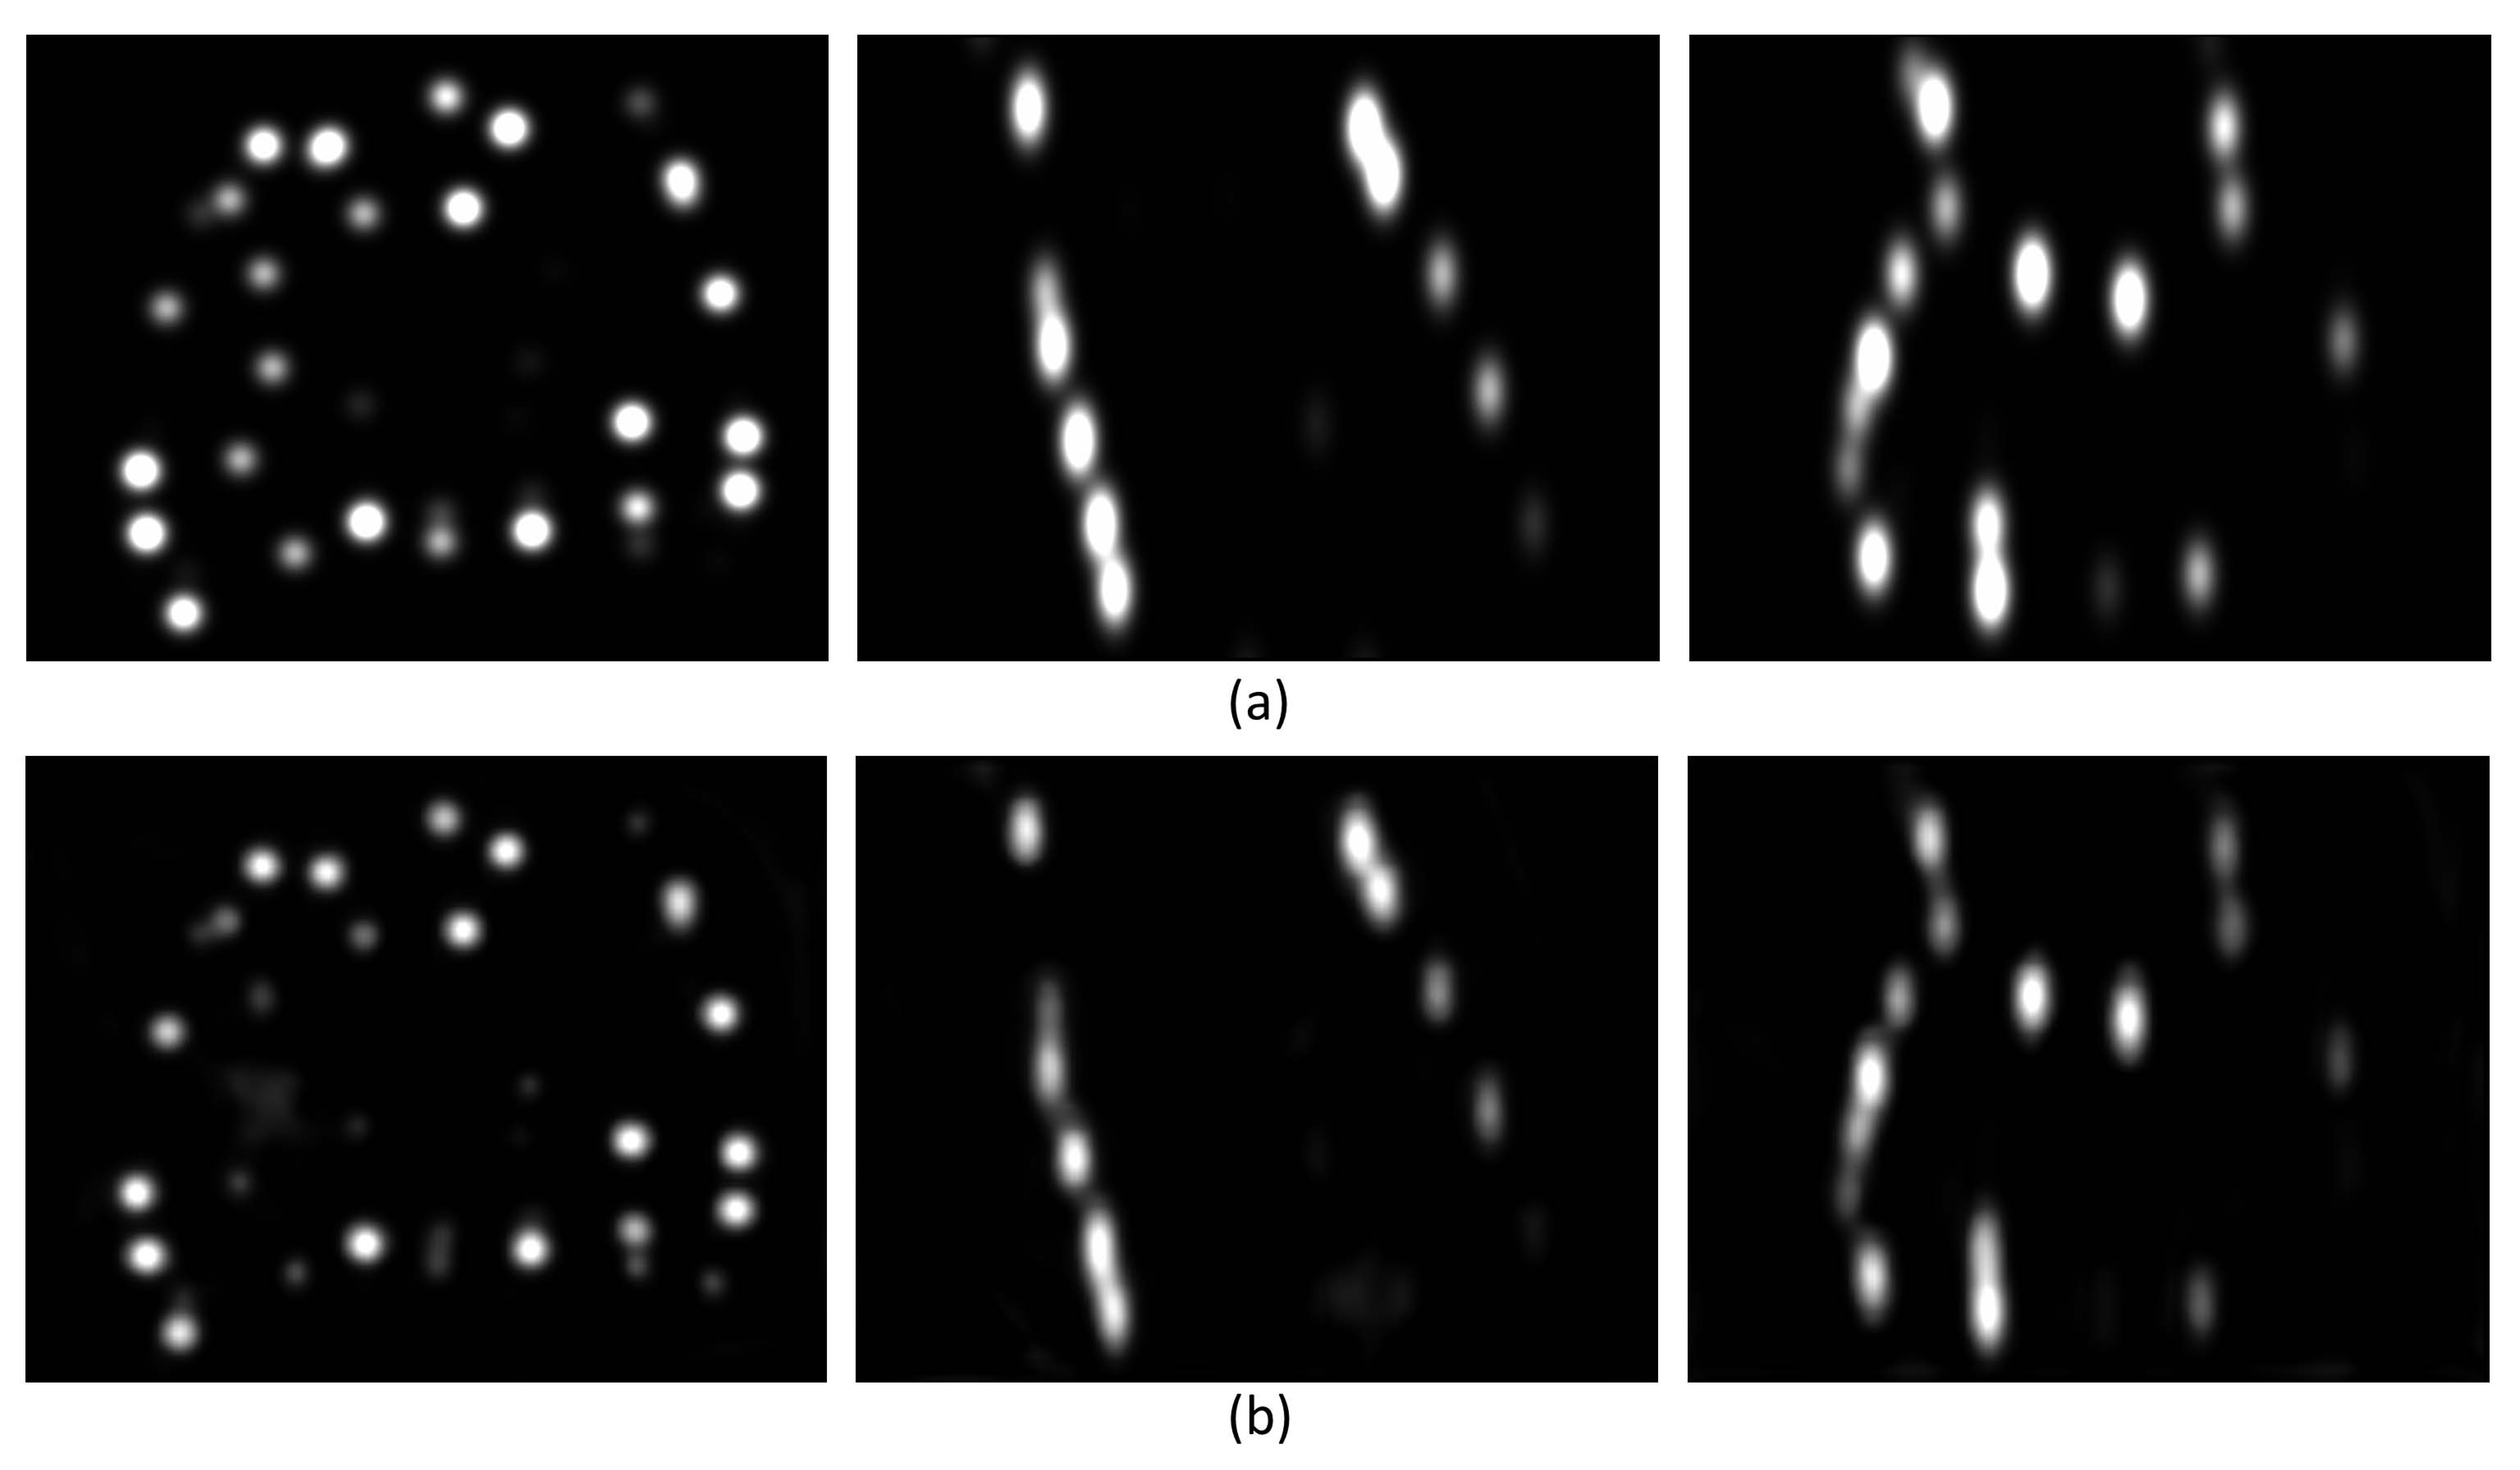
Here denotes the coordinates of any voxel in image , and is the normalized 3D Gaussian kernel evaluated at , with the mean at the user annotation and a diagonal covariance matrix . Considering the physical seed dimension and the magnification effect during CT imaging, we fixed and in our study. Figure 2 (a) shows several examples of the probability map that are created from the dot manual annotations in Fig. 1, and (b) are the corresponding predicted maps inferred from the proposed deep regression model.
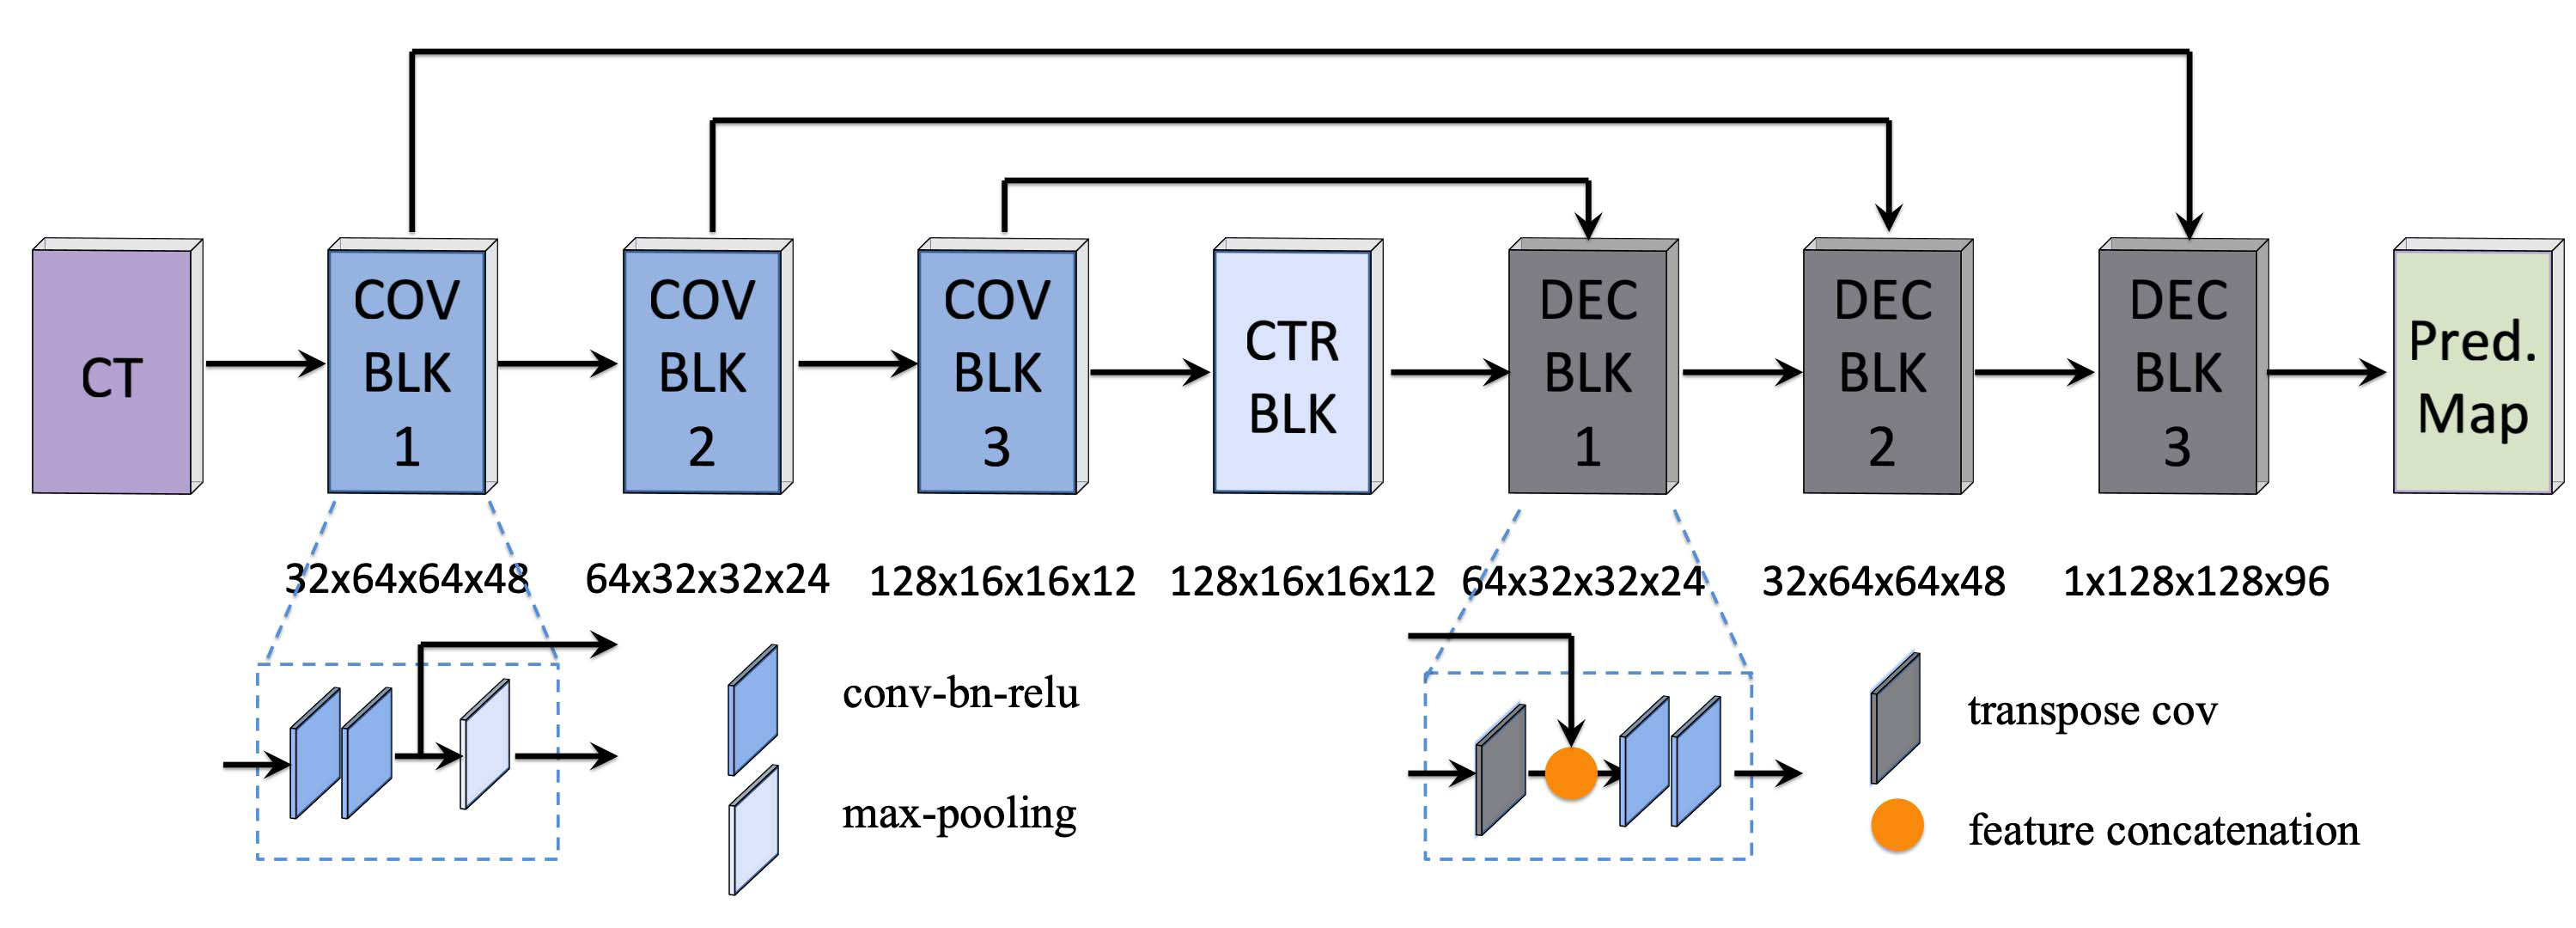
We train a deep regression network (DRN) to map the input CT images to the probability map using a symmetric convolutional encoding-decoding structure, as shown in Fig. 3. Convolution and max-pooling are employed to aggregate contextual information of CT images in the encoding pathway, and transpose convolution is used to recover the original resolution in the decoding pathway. Each convolutionl layer is followed by batch normalization and rectified linear unit (ReLU) to facilitate gradient back-propagation. Long-range skip connections, which bridge across the encoding blocks and the decoding blocks, are also created to allow high resolution features from encoding pathway be used as additional inputs to the convolutional layers in the decoding pathway. By explicitly assembling low- and high-level features, DRN benefits from local and global contextual information to reconstruct more precise probability map of seed locations. Considering the target probability map is non-negative, we use as the activation function in the last convolutional layer to ensure a positive output of DRN, which approximates the ReLU function as:
| (2) |
In this study, we set . The convolutional kernel size is fixed as and stride as , except for transpose convolution where we set both kernel size and stride as for upscaling purpose. Zero-padding is used to ensure the same dimension during convolution. All the operations are performed in 3D space.

Training DRN is achieved by minimizing a loss function between the predicted probability map and the target map . Since the majority of voxels in the target probability map belongs to background, DRN tends to focus more on learning background rather than the Gaussian-shaped seed annotations. In order to account for this imbalance between background and seed annotations, we use a weighted Mean Squared Error (MSE) as the loss function, with the weight as the target map :
| (3) |
where is the total number of voxels in the training mini batch.
2.2 Implementation
Our DRN was implemented with Python using Pytorch (v.0.4) package. Training DRN took 500 iterations from scratch using Adam stochastic optimization method with a batch size of . The initial learning rate was set as , and learning rate decay and early stopping strategies were utilized when validation loss stopped decreasing. In order to reduce overfitting, we randomly flipped the input volume in left/right, superior/inferior, and anterior/posterior directions on the fly for data augmentation. We used seven-fold cross validation to evaluate the performance of our model on the training dataset, in which a few hyper-parameters were also experimentally determined via grid search. All the experiments were conducted on a workstation with four Nvidia GTX 1080 TI GPUs.
As for pre-processing, we simply truncated the voxel values of all CT scans to the range of HU to eliminate the irrelevant image information. The CT images were resampled to mm isotropically and volume of interest (VOI) centered on the prostate was extracted from the entire CT image as input to DRN. During inference, the new CT images were pre-processed following the same procedure as training data preparation, then the trained DRN was applied to VOI to yield a 3D probability map. We used a 3D watershed segmentation algorithm to convert the probability map to the final seed locations.
3 Experiments
We assembled a database of prostate cancer patients treated with seed implant brachytherapy from 2008 to 2019 in our institution. The number of implanted seeds (Palladium 103) ranged from to . Seventy patients with seeds were randomly selected for model training and validation, while the remaining patients with seeds were reserved for independent testing. A CT scan was performed on each patient days after implantation, with in-plane resolution ranging from to mm and slice thickness from to mm.
The ground truth was obtained by a semi-automatic procedure, in which VariSeed seed finder algorithm was first used to search implanted seeds near prostate region in the CT images. Since this automatic procedure usually results in a few erroneous seed placements, user intervention was required to correct these errors based on the seed locations in the CT images. The seed localization as well as the reconstructed radiation dose distribution were finally approved by a radiation oncologist.
We evaluated the performance of the proposed method by comparing the pair-wise distance between the predicted seed locations and the ground-truth locations. For a seed obtained from the automated method and one from ground truth, if their distance was the shortest among the list of seeds that needed to be paired, they were considered as a pair and removed from the list. If a pair-wise distance was smaller than mm, the corresponding ground truth seed was considered as being correctly identified by the automated method.
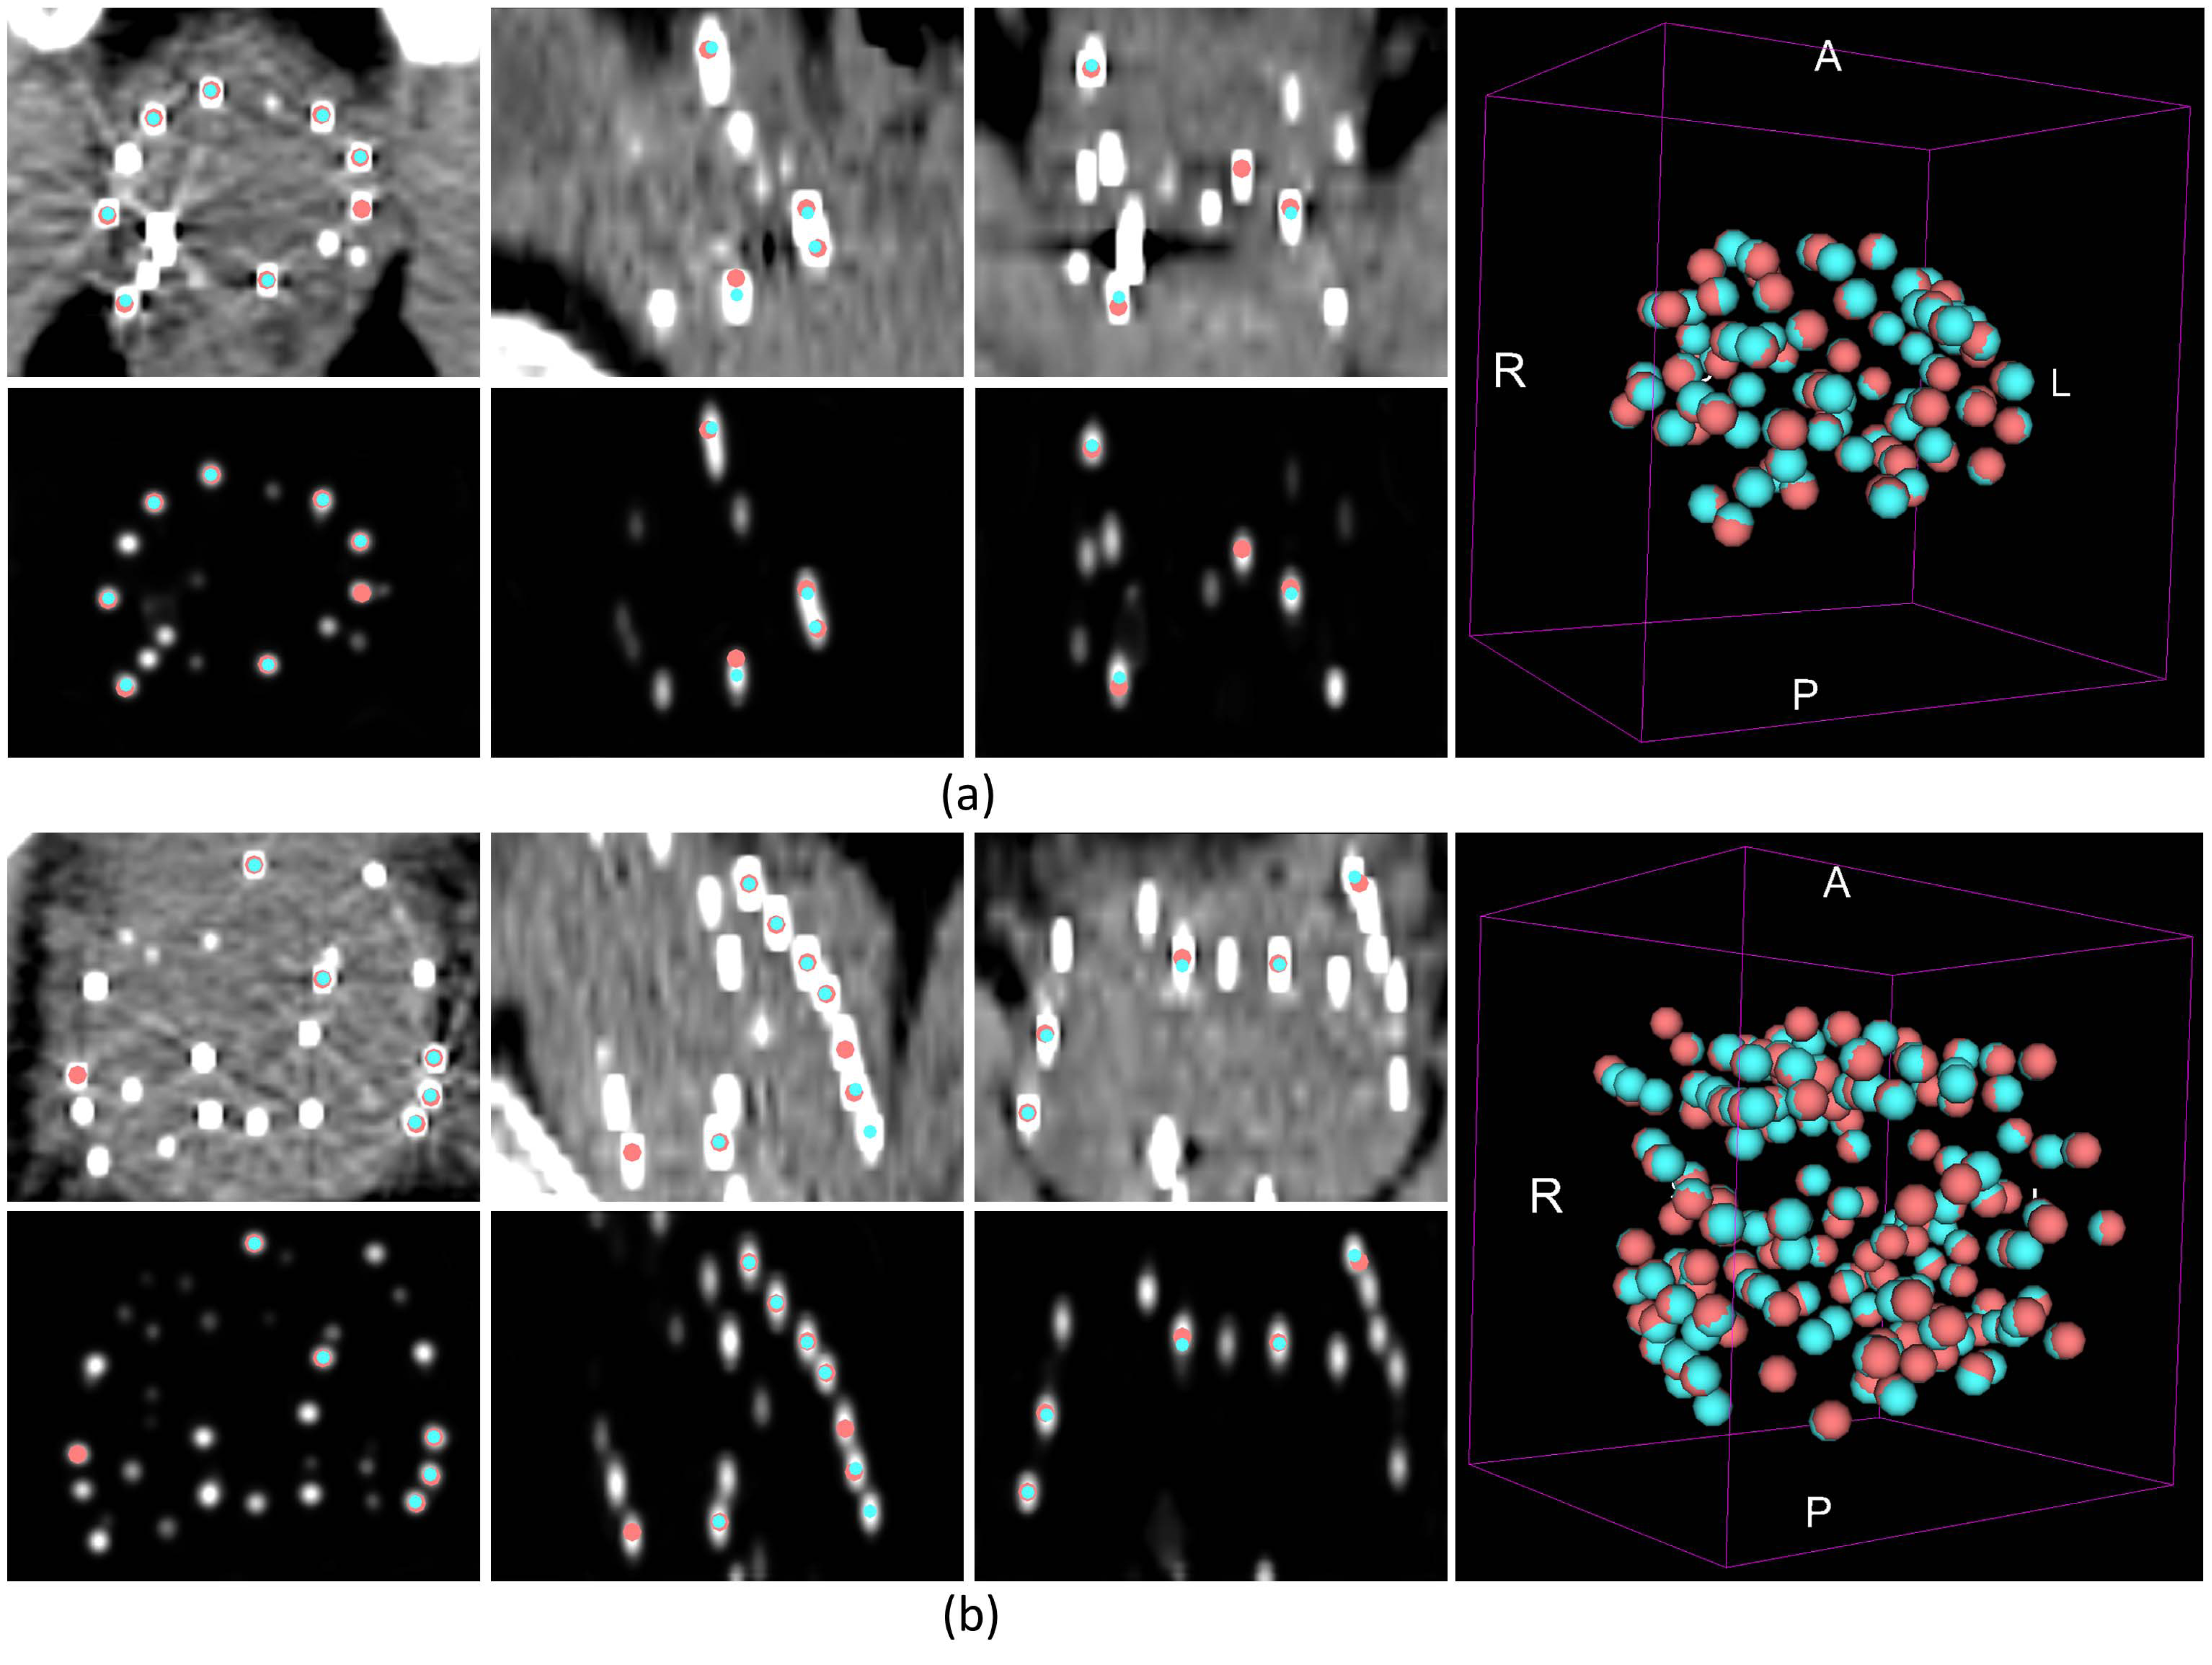
Figure 4 shows two examples of PID study in CT images in axial, sagittal and coronal views, respectively, in which seeds were implanted in patient (a) and seeds in (b). Also shown are the corresponding DRN predictions of the probability map. It clearly shows that the metal artifacts and seed overlap appearance are significantly suppressed, which makes the seed localization much easier. The plots on the right show the 3D distributions of the ground truth and the seeds identified by DRN. Overall, it took about seconds for DRN to recover the number of implanted seeds on testing patients. The median pair-wise distance was mm [: mm].

Table 1 details the comparison between DRN and VariSeed seed finder in seed detection, in which the first and fourth rows list the number of implanted seeds. For a large range of number of implanted seeds (from to ), the proposed DRN outperformed VariSeed by a big margin on almost every patient. Overall, DRN correctly identified 2150 out of 2286 seeds () in testing patients, achieving improvement as compared to VariSeed ().
| No. of seeds | 48 | 50 | 52 | 52 | 58 | 58 | 60 | 62 | 66 | 66 | 66 | 69 | 69 | 71 | 71 |
|---|---|---|---|---|---|---|---|---|---|---|---|---|---|---|---|
| DRN (%) | 95.8 | 92.0 | 96.2 | 98.1 | 94.8 | 87.9 | 91.7 | 91.9 | 86.4 | 97.0 | 97.0 | 94.2 | 91.3 | 93.0 | 95.8 |
| VariSeed (%) | 79.2 | 48.0 | 42.3 | 65.4 | 79.3 | 77.6 | 76.7 | 69.4 | 75.8 | 81.8 | 90.9 | 84.1 | 79.7 | 74.6 | 91.5 |
| No. of seeds | 72 | 72 | 74 | 77 | 78 | 79 | 82 | 84 | 88 | 95 | 99 | 100 | 108 | 117 | 143 |
| DRN (%) | 94.4 | 93.1 | 91.9 | 96.1 | 94.9 | 94.9 | 93.9 | 97.6 | 95.5 | 90.5 | 94.0 | 92.0 | 90.7 | 100.0 | 95.8 |
| VariSeed (%) | 77.8 | 90.3 | 79.7 | 87.0 | 67.9 | 87.3 | 100.0 | 76.2 | 84.1 | 81.1 | 85.9 | 73.0 | 85.2 | 94.0 | 92.3 |
4 Conclusion
In this paper, we pioneered the application of deep learning in the task of identifying radioactive seeds in CT-based post-implant dosimetry study for patients undergoing prostate brachytherapy. Despite the challenges in seed localization in CT images, the proposed deep regression model achieved much higher detection accuracy as compared to a widely-used commercial software on a large clinical database. Also, our model was found to be very efficient, taking about 2 seconds on average for a new test case. Instead of manually drawing 3D bounding box or mask on each seed, our method only requires dot annotations as ground truth for model training, which greatly simplifies the data labelling procedure. This weakly-supervised learning framework can be easily generalized to other object detection tasks such as fudicial marker tracking in 2D/3D real-time imaging and source/catheter positioning in high dose rate (HDR) brachytherapy.
Acknowledgment
This work is partially supported by grant UL1TR001433 from the National Center for Advancing Translational Sciences, National Institutes of Health, USA.
References
- [1] Siegel, R. L., et al.: Cancer Statistics, 2019. Cancer J Clin. 69, 7–34 (2019)
- [2] Chin, J., et al.: Brachytherapy for patients with prostate cancer: american society of clinical oncology/cancer care ontario joint guideline update. J. Clin Oncol. 35, 1737-43 (2017)
- [3] Stock, R., et al.: Importance of post-implant dosimetry in permanent prostate brachytherapy. Eur Urology 41, 434-439 (2002)
- [4] Liu, H., et al.: Automatic localization of implanted seeds from post-implant CT images. Phys Med Biol 48(9), 1191 - 1203 (2003)
- [5] Holupka, E. J., et al.: An automatic seed finer for brachytherapy CT postplans based on the Hough transform. Med Phys. 31(9), 2672-2679 (2004)
- [6] Nguyen, H. G., et al.: Automatic 3D seed location and orientation detection in CT image for prostate brachytherapy. In: IEEE ISBI 2014, pp. 1320-1323. (2014)
- [7] Zhang, G., et al.: Automatic seed picking for brachytherapy postimplant validation with 3D CT images. Int J CARS. 12, 1985 - 1993 (2017)
- [8] Litjens, et al.: A survey on deep learning in medical image analysis. Med Imag Anal. 42, 60-88 (2017)
- [9] Setio, A., et al.: Validation, comparison, and combination of algorithms for automatic detection of pulmonary nodules in computed tomography images: the LUNA16 challenge. Med Imag Anal. 42, 1 - 13 (2017)
- [10] Xu, Y., et al: Gland instance segmentation using deep multichannel neural networks. IEEE Trans. Med. Imaging 64(12), 2901-2912 (2017)
- [11] Bilic, P., et al. : The liver tumor segmentation benchmark (LiTS). arXiv preprint arXiv:1901.04056 (2019)
- [12] Yuan, Y., et al.: Automatic skin lesion segmentation using deep fully convolutional networks with Jaccard distance. IEEE Trans. Med. Imaging 36(9), 1876-1886 (2017)
- [13] Yu, L., et al. : Automated melanoma recognition in dermoscopy images via very deep residual networks. IEEE Trans. Med. Imaging 36(4), 994-1004 (2017)