The specific angular momenta of superthin galaxies: Cue to their origin?
Abstract
Superthin galaxies are low surface brightness (LSB) bulgeless disc galaxies having stellar discs with unusually high planar-to-vertical axes ratio 10 - 20, the formation and evolution of which is not well-understood. We calculate the specific angular momenta of a sample of six superthins and nine other bulgeless LSBs using stellar photometry, atomic hydrogen (HI) surface density and high resolution HI rotation curves available in the literature. We find that the stellar specific angular mometum , and hence the stellar disc size given by the exponential stellar disc scale length RD, of three superthins and seven LSBs lie above the 95.4 confidence band of the - regression line for ordinary bulgeless disc galaxies, being the asymptotic rotational velocity. Further, we find that superthins and LSBs have higher and RD values for a given value of stellar mass at high values of statistical significance, compared to ordinary disc galaxies. Therefore, we conclude, a superthin is may be distinguished by a characteristically larger disc size which could possibly explain the origin of its large planar-to-vertical axes ratio. Interestingly, we find that the median spin parameter , and being the virial velocity and virial radius of the galaxy respectively, is 0.13 0.01 for superthin galaxies which is an order of magnitude higher than those of LSBs and ordinary disc galaxies, which may have important implications for the existence of superthin stellar discs in these low surface brightness galaxies.
keywords:
galaxies: evolution - galaxies: formation - galaxies: kinematics and dynamics - galaxies: structure1 Introduction
Superthin galaxies are low surface brightness (LSB), flat or bulgeless disc galaxies with strikingly high values of planar-to-vertical axes ratio , also referred to as ultra-flat or very thin galaxies (Goad & Roberts 1981, Karachentsev 1989; Matthews, van Driel & Gallagher 1999, Karachentsev et al. 2016, Bizyaev et al. 2017). They are gas-rich and dark matter-dominated with low metallicities and star formation rates (See Kautsch 2009 for a review). Superthins therefore serve as proxies of a very late-type galaxy population and are therefore ideal laboratories for testing models of galaxy evolution in the local universe.
A superthin stellar vertical structure implies an ultra-cold stellar disc i.e., a stellar disc with distinctly low values of stellar dispersion in the vertical direction. The existence of ultra-cold stellar discs is a mystery, given the hierarchical structure formation scenario of the current cosmological paradigm. Besides, galaxy mergers are known to be common in group environments, which results in the heating and subsequent thickening of the stellar discs (Walker, Mihos & Hernquist 1996; Velazquez & White 1999; Qu et al. 2011). LSBs are however favourably located at the outskirts of voids, which, therefore, complies with the quiescent nature of their stellar discs (Rosenbaum et al. 2009). However, galactic discs may also be heated by internal mechanisms via the growth of non-axisymmetric instabilities like bars, spiral arms and other mediators of secular evolution (Barbanis & Woltjer 1967, Grand et al. 2016). This possibly implies that superthins are devoid of strong bars and spiral arms, which is characteristic of any very late-type, under-evolved systems. Observational confirmation of the absence or near-absence of bars and spiral arms in highly edge-on systems like the superthins is tricky (But see, Bureau & Athanoussoula 2005). However, Zasov, Makarov & Mikailhova (1991) showed that superthin galaxies are stabilised against vertical bending instabilities by a massive dark matter halos (See, also, Khoperskov et al. (2010)). Analytical calculations by Ghosh & Jog (2014) also indicated that the growth of both axi-symmetric and non-axisymmetric instabilities in the superthin galaxy UGC7321 are suppressed by its dark matter halo. Garg & Banerjee (2017) and Narayanan & Banerjee (2019, in preparation) demonstrated that the dark matter suppresses the growth of both axi-symmetric and non axi-symmetric instabilities for a sample of LSBs in general (Also, see, Banerjee & Jog 2013, Narayanan & Banerjee 2018). Therefore, the heating of the stellar disc via secular evolution is possibly inhibited by the dark matter halo in superthin galaxies, which is a viable reason for the survival of their razor-thin stellar discs.
Alternatively, a higher value of the stellar specific angular momentum in a given radial gravitational field should favour the formation of a larger stellar disc, which may possibly get reflected in a larger planar-to-vertical axes ratio of the same. In fact, from an empirical study of the size-mass data from the SDSS, Shen et al. (2013) found that late-type galaxies, on an average, have larger characteristic size compared to their early-type counterparts. The structure and morphology of a disc galaxy is primarily regulated by a counterbalance between the inward radial gravitational field and the outward centrifugal force, in contrast to ellipticals or spheroidals in which the dynamics is predominantly driven by the velocity dispersion of the stars. In fact, as a physical rationale behind the galaxy classification scheme, Fall (1983) proposed the js - Ms where js is the specific angular momentum of the stars and Ms the stellar mass, often referred to as the Fall relation, according to which, galaxies with Ms 9 obey the js - M scaling relation (Also see Romanowsky & Fall 2012). Interestingly, the specific angular momentum of the dark matter halo also scales as their mass to the power 2/3 according to the tidal torque theory, which assumes that the dark matter halos acquire their angular momenta via gravitational torques during the early phases of formation and evolution (Peebles 1969; White 1984; Barnes & Efstathiou 1987). According to the modern theory of galaxy formation and evolution, galaxies form via the cooling and condensation of baryons in the potential wells of their host dark matter halos (Rees & White 1979) and therefore the Fall relation indicates the intrinsic connection between the galactic disc and its host dark matter halo. In fact, numerical simulations have indicated that gas and dark matter within virialized systems have comparable values of angular momenta (See, for example, Sharma & Steinmetz 2005), and the assumption that the stellar disc originating from star formation in the cold gas disc acquires the same angular momentum as the parent gas disc is in agreement with the Fall relation. However, the connection is primarily interceded by two fundamental parameters, namely the global star-formation efficiency defined as the ratio of the stellar mass to halo mass, and the retained fraction of the specific angular momentum which is the ratio of the specific angular momentum of the stars to that of the dark matter halo, which, in turn, are governed by complex process of galaxy formation and evolution including stellar feedback, gas dissipation and exchange of angular momentum among the different baryonic components.
In this paper, we study the specific angular momenta of a sample of six superthin galaxies to understand the origin of their characteristic razor-thin stellar discs i.e., stellar discs with unusually high planar-to-vertical axes ratios, for which stellar photometry, HI surface density and high resolution HI rotation curves were already available in the literature. However, the angular momenta of their discs were not studied earlier. In addition, we also consider a sample of nine general low surface brightness galaxies (LSBs) for which again all the necessary input parameters were already available in the literature as well. None of our sample LSBs are edge-on and hence we have no notion if their stellar discs are superthin or not. However, they were part of the sample of galaxies considered for obtaining the fundamental angular momentum-mass relation encompassing all galaxy morphological types from dwarf-irregulars to massive spirals (Posti et al. 2018). We primarily check if our sample superthins and LSBs have statistically higher values of specific angular momenta of their stellar discs js for a given value of (i) the radial gravitational field as indicated by their asymptotic rotational velocity and (ii) the stellar mass Ms, as compared to ordinary bulgeless disc galaxies chosen from the sample of Obreschkow & Glazebrook (2014). Since the gas discs are progenitors of the stellar discs, we repeat the same study for the gas as well as the total (stars + gas) baryonic disc to gain possible insights into the formation and evolution processes of superthin galaxies. In addition, we study the dependence of on the properties of its host dark matter halo as was of late investigated in hydrodynamical cosmological simulation studies. Finally, we also study the dependence of jstar on the gas mass fraction Mg/Mb where Mg and Mb are the gas mass and total baryonic mass respectively as predicted by recent semi-analytical studies of galaxy formation and evolution.
The rest of the paper is organized as follows: In §2, we discuss the theory and numerical calculations, in §3 the sample, in §4 the input parameters followed by results and discussion in §5 and conclusions in §6.
2 Data Analysis
2.1 Theory & Numerical Calculations
The angular momentum of the component of the disc for axis-symmetric discs is given by
where is the radial surface density profile of the component and rotational velocity. The mass of the component is given by
Therefore, the specific angular momentum is given by
Earlier studies have shown that in the optical i.e., B-band or R-band, the surface brightness profile is well-fitted with an exponential (See, for example, de Blok et al. 2001), whereas in the mid infra-red, the same is fitted well with a double exponential (See, for example, Salo et al. 2015). The same trend holds good for our sample of superthins and LSBs. Therefore, for our sample stellar discs, is either an exponential
where is the central stellar surface density and the exponential stellar disc scalelength. or, a double exponential given by
where is the central stellar surface density and the exponential stellar disc scalelength of stellar disc 1 and so on.
Similarly, earlier work indicated that the radial profiles of HI surface density could be well-fitted with double-gaussians profiles (See, for example, Begum & Chengalur 2004, Patra et al. 2014), possibly signifying the presence of two HI discs. Also, galaxies with the HI surface density peaking away from the centre are common, which indicates the presence of an HI hole at the centre. Our sample HI surface density profiles could therefore be fitted well with off-centred double Gaussians given by
where is the central gas surface density, the centre and the scalelength of gas disc 1 and so on. For the gas disc, we consiser the atomic hydrogen (HI) surface density only as the presence of molecular gas in LSBs is known to be negligible (See, for example, Banerjee & Bapat for a discussion).
Finally, the rotation curves of galaxies in general are commonly well-fitted either by a Brand-profile (See, for example, Banerjee & Bapat 2014) given by
where , and are the free parameters, with the asymptotic rotational velocity.
or, with an exponential profile given by
where and are free parameters (See, for example, Obreschkow & Glazebrook 2014).
Error bars: The error bars on the total angular momentum (, , ), total mass (, , ) and the total specific angular momentum (, , ) were calculated by propagating the fitting errors on the input parameters.
2.2 Sample
Our sample consists of six superthin galaxies for which high resolution rotation curves and gas surface density profiles from
HI 21cm radio-synthesis observations were available in the literature: UGC7321, IC5249, IC2233, UGC711, NGC4244 and FGC1540. We may note here that two of our sample superthin galaxies, UGC7321 and IC2233, are from the original sample of classic superthin galaxies, studied by Goad & Roberts (1981) although IC2233 has a major-to-minor axes ratio 10. Our sample superthins are moderately inclined to perfectly edge-on with angles of inclination ranging between 65o - 90o, with unusually high values of
9 - 16, band central surface brightness 22.4 -24.5 mag arcsec-2 and low-to-intermediate values of the asymptotic rotational velocities vmax 85-112 kms-1.
The basic properties of our sample superthins in the -band and 3.6 band are summarized in Table 1 and 2 respectively. -band
photometry for FGC1540 was not available in the literature and hence has not been presented in the table. The -band, the stellar disc appears to be superthin, however, traces the young stellar population only. The major mass fraction of the stellar disc is however trace
by the mid infra-red band of 3.6. Unlike in the -band, in the 3.6 band, for four out of our six superthins, the stars are distributed in two exponential discs with different radial scalelengths and vertical scaleheights, with one of the discs (Disc 1) several times more massive than the other (Disc 2) in general. We also note that Disc 1 is fainter i.e., with a lower surface brightness and with a larger disc size.
| Name111All the quantities except for Distance and Central B-band surface brightness have been quoted from NED/Hyperleda | D222Distance from Tully et al. (2013) | 333B-band central surface brightness | 444Major-to-minor axes ratio | 555Inclination | 666Maximum Velocity | 777Radial disc scale length |
| (Mpc) | (mag arcsec-2) | (kpc) | o | (kms-1) | (kPc) | |
| UGC7321 | 22.18 | 23.5 | 15.7 | 90 | 103 | 4.6 |
| IC5249 | 31.77 | 24.5 | 10.2 | 90 | 108 | 7.0 |
| IC2233 | 12.59 | 22.6 | 8.9 | 90 | 110 | 1.5 |
| UGC711 | 20.61 | 23.6 | 15.5 | 74.7 | 105 | 3.2 |
| NGC4244 | 4.62 | 22.4 | 9.1 | 65.4 | 97 | 2.0 |
| FGC1540 | 20.32 | 12.25 | 78.7 | 83 |
| Name888Adapted from Salo et al. (2015) | 999Central surface brightness of outer disc | 101010Radial scale length of outer disk | 111111Central surface brightness of inner disc | 121212Radial scale length of inner disk |
|---|---|---|---|---|
| (mag arcsec-2) | (kpc) | (mag arcsec-2) | (kpc) | |
| UGC7321 | 21.73 | 5.26 | 19.94 | 2.2 |
| IC5249 | 21.70 | 5.24 | 20.53 | 1.23 |
| IC2233 | 21.67 | 2.16 | 20.82 | 0.81 |
| UGC711 | 21.189 | 2.14 | - | - |
| NGC4244 | 20.27 | 1.62 | - | - |
| FGC1540 | 22.23 | 1.87 | 21.39 | 0.54 |
In addition, we choose a sample of nine bulgeless LSBs for which -band stellar photometry, HI surface density and high resolution HI rotation curves were already available
(de Blok et al. 2001). Our sample LSBs are nearly to moderately face-on with angles of inclination ranging between 25o - 65o, and therefore we cannot assess if they are superthin. Their band central surface brightness (0) 22.10 -24.03 mag arcsec-2, asymptotic rotational velocities vmax 70-142 kms-1 and therefore have almost comparable photometric and dynamical properties as the superthins. The basic properties of our sample LSBs in the B-band are given in Table 3. The rotation curves of our sample superthins are found to be well-fitted by a Brandt profile whereas the LSBs with an exponential profile (See §2).
GALFIT 2-D structural decompositions in the 3.6 band were not available for our sample of LSBs.
| Name131313All values quoted from de Blok et al. (2001) | D141414Distance | 151515B-band central surface brightness | 161616Exponential disc scalelength | i171717Inclination | 181818Maximum Velocity |
|---|---|---|---|---|---|
| (Mpc) | (mag arcsec-2) | (kpc) | (o) | (kms-1) | |
As discussed, we compare our angular momentum study of superthins and LSBs with that of a sample of six ordinary bulgeless disc galaxies and a sample of six bulgeless dwarf irregulars. The ordinary bulgeless disc galaxies are chosen from the sample of Obreschkow & Glazebrook (2014) such that their bulge mass fraction is less than 0.05: NGC628, NGC2403, NGC2976, NGC3184, NGC3198 and NGC7793. They have band (0) 21.49 - 22.56 mag arcsec-2 and asymptotic rotational velocities vmax 70-142 kms-1.
2.3 Input Parameters
GALFIT 2-D structural decompositions of the stellar surface density profiles of our sample superthins in the Spitzer 3.6 band were available from Salo et al (2015).
B-band photometry, HI rotation curves and HI surface density were taken from the literature as indicated within brackets for each of our galaxies: UGC7321 (Uson & Matthews 2003), IC5249 (O’Brien et al. 2010), IC2233 (Matthews & Uson 2008), UGC711 (Mendelowitz et al. 2000), NGC4244 (Zschaechner et al. 2011) and FGC1540 (Kurapati et al. 2018).
In Table 4, we present the best-fitting parameters when the rotation curves of our superthin galaxies were fitted with a Brandt profile (See §2.1). In Table 5, we present the best-fitting parameters when the radial HI surface density profile is fitted with a double gaussian (See §2.1). For the LSBs, -band photometry, HI rotation curves and HI surface density profiles were all available from de Blok et al (2001). In Table 6, we present the best-fitting parameters when the rotation curves of our LSBs were fitted with a exponential profile (See §2.1), and in Table 7, the best-fitting parameters when the radial HI surface density profile is fitted with a double gaussian (See §2.1). A mass-to-light ratio constant with radius was assumed for the above studies which is reasonable for under-evolved late-type systems such as these which exhibit little or no colour variation with radius.
For comparison, we used the stellar angular momentum Js, stellar mass Ms and specific angular momentum js as well as gas angular momentum Jg, gas mass Mg and gas specific angular momentum jg values for the ordinary discs and dwarf irregulars as given in Obreschkow & Glazebrook (2014) and Chowdhury & Chengalur (2017) respectively. We may note here the Jg, Mg and jg values for the ordinary discs included the contribution of the molecular gas.
| Name | Vrot | Rmax | n |
|---|---|---|---|
| kms-1 | kPc | ||
| UGC 7321 | 103.31 | 19.58 | 0.983 |
| IC 5249 | 108.26 | 24.54 | 0.835 |
| IC 2233 | 109.86 | 27.52 | 0.678 |
| UGC 711 | 104.287 | 18.42 | 1.83 |
| NGC 4244 | 96.59 | 11.69 | 0.487 |
| FGC 1540 | 83.36 | 25.67 | 0.449 |
| Name | ||||||
|---|---|---|---|---|---|---|
| M⊙Pc-2 | kPc | kPc | M⊙Pc-2 | kPc | kPc | |
| UGC 7321 | 4.91 | 8.48 | 6.27 | 2.51 | 1.07 | 3.33 |
| IC 5249 | 8.05 | 0.0 | 0.25 | - | - | - |
| IC 2233 | 2.24 | 2.53 | 1.80 | 2.45 | 6.15 | 1.70 |
| UGC 711 | 30.49 | 0.0 | 3.74 | - | - | - |
| NGC 4244 | 3.93 | 7.15 | 1.26 | 4.11 | 5.01 | 4.61 |
| FGC 1540 | 4.09 | 2.48 | 5.73 | 1.30 | 5.08 | 1.20 |
| Name | ||
|---|---|---|
| kms-1 | kPc | |
| F563-V2 | 118.13 | 1.9 |
| F574-1 | 99.10 | 2.62 |
| F583-1 | 88.84 | 3.29 |
| F583-4 | 66.19 | 1.61 |
| F568-V1 | 117.32 | 2.19 |
| F563-1 | 109.59 | 2.62 |
| F579-V1 | 110.65 | 1.05 |
| F568-1 | 139.23 | 2.29 |
| F568-3 | 107.01 | 3.54 |
| Name | ||||||
|---|---|---|---|---|---|---|
| M⊙Pc-2 | kPc | kPc | M⊙Pc-2 | kPc | kPc | |
| F563-V2 | 6.89 | 4.57 | 2.53 | 5.21 | 0.0 | 1.74 |
| F574-1 | 2.31 | 0.51 | 6.18 | 1.60 | 7.70 | 3.17 |
| F583-1 | 0.35 | 4.66 | 0.96 | 4.37 | 3.94 | 4.14 |
| F583-4 | 1.09 | -0.27 | 1.49 | 1.41 | 3.23 | 2.84 |
| F568-V1 | 1.76 | 7.90 | 2.28 | 3.56 | 2.97 | 4.36 |
| F563-1 | 4.61 | -3.74 | 11.40 | 0.76 | 4.75 | 2.06 |
| F579-V1 | 3.56 | 4.11 | 5.14 | - | - | - |
| F568-1 | 7.94 | 4.41 | 4.06 | - | - | - |
| F568-3 | 4.63 | 3.95 | 4.98 | - | - | - |
3 Results
In Table 8, we present our calculated values of the mass Mstars, the angular momentum Jstars and the specific angular momentum jstars of our sample galaxies in the 3.6 band. Our results indicate that IC5249 has the highest value of jstars among our superthins followed by FGC1540, UGC7321, UGC711, NGC4244 and IC2233. jstars values for our sample superthins range between 105.44 - 105.95 comparable to 105.03 - 106.03 (both in j/kms-1 pc units) found for a sample of 5 bulgeless ordinary spirals in Obreschkow & Glazebrook (2014). We stress here that the 3.6 band traces the old stellar population which also constitutes the main mass component of the galactic stellar disc. However, the attribute superthin for our sample galaxies originated from their razor-thin appearance in the optical or B-band, and they may not appear to be be quite superthin in the 3.6 band. However, the optical or the -band, which traces the young stellar population, may be highly obscured by dust and therefore may not be the ideal choice to estimate the mass or angular momentum of stellar discs. However, this effect is expected to be less severe in case of low surface brightness galaxies like the superthins due to their low dust content (de Blok et al. 2001). We therefore repeat the above study using structural decompositions in the -band for all our sample galaxies, barring FGC1540 for which no optical data were available. In Table 9, we summarize the Mstars, Jstars and jstars values of our sample galaxies in the band. We find that the specific angular momenta of our superthin stellar discs in the -band are less than a factor of 2 higher than those in the 3.6 band, except for IC2233 which has comparable jstars values in both the bands. Besides our sample galaxies follow the same trend in the magnitude of their jstars values as in the 3.6 band. In Table 10, we present our calculated values for our LSB sample in the band. jstars values for our sample LSBs range between 105.3 - 106.2 and is comparable to those of the superthins.
The calculated stellar mass Ms varies between 108.3 - 109.4 M, 108.5 - 109.9 M and 109.5 - 1010.3 M for the superthins, LSBs, and ordinary discs respectively.
All the mass estimates correspond to the 3.6 band except for the LSBs for which the calculated stellar masses correspond to the -band.
Therefore, our superthins and LSBs have Ms about an order of magnitude higher than those of the ordinary discs. Further, in the -band, Ms for our sample superthins are found to be a few times higher than those in the 3.6 band.
| Name | Mstars1 | Jstars2 | jstars3 | ||||||
|---|---|---|---|---|---|---|---|---|---|
| Disc 1 | Disc 2 | Total | Disc 1 | Disc 2 | Total | Disc 1 | Disc 2 | Total | |
| UGC7321 | 9.10 | 9.05 | 9.38 | 15.09 | 14.58 | 15.21 | 6.00 | 5.53 | 5.83 |
| IC5249 | 8.97 | 8.18 | 9.04 | 14.98 | 13.34 | 15.00 | 6.01 | 5.16 | 5.95 |
| IC2233 | 8.21 | 7.70 | 8.33 | 13.75 | 12.61 | 13.78 | 5.53 | 4.91 | 5.45 |
| UGC711 | 8.62 | 8.62 | 14.07 | 14.07 | 5.45 | 5.45 | |||
| NGC4244 | 8.57 | 8.57 | 14.02 | 14.02 | 5.44 | 5.44 | |||
| FGC1540 | 8.38 | 7.64 | 8.46 | 14.09 | 12.68 | 14.11 | 5.71 | 5.03 | 5.65 |
-
1
in Log(M/M⊙)
-
2
in Log(J/(M⊙kms-1 pc))
-
3
in Log(j/(kms-1 pc)
| Name | Mstars1 | Jstars2 | jstars3 |
|---|---|---|---|
| UGC7321 | 9.67 | 15.60 | 5.94 |
| IC5249 | 9.34 | 15.50 | 6.15 |
| IC2233 | 8.74 | 14.05 | 5.31 |
| UGC711 | 9.31 | 15.02 | 5.70 |
| NGC4244 | 9.61 | 14.71 | 5.55 |
-
1
in Log(M/M⊙)
-
2
in Log(J/(M⊙kms-1 pc))
-
3
in Log(j/(kms-1 pc)
| Name | Mstars1 | Jstars2 | jstars3 |
|---|---|---|---|
| F563-V2 | 9.46 | 15.10 0.01 | 2.65 0.01 |
| F574-1 | 9.60 | 15.51 0.00 | 2.91 0.00 |
| F583-1 | 8.45 | 13.74 0.01 | 2.29 0.01 |
| F583-IV | 9.01 | 14.54 0.02 | 2.53 0.02 |
| F563-1 | 9.11 | 14.84 0.01 | 2.74 0.01 |
| F568-V1 | 9.34 | 15.19 0.00 | 2.84 0.00 |
| F568-1 | 9.58 | 15.74 0.01 | 3.16 0.01 |
| F568-3 | 9.62 | 15.50 0.02 | 2.88 0.02 |
| F579-V1 | 9.95 | 16.00 0.01 | 3.05 0.01 |
-
1
in Log(M/M⊙)
-
2
in Log(J/(M⊙kms-1 pc))
-
3
in Log(j/(kms-1 pc)
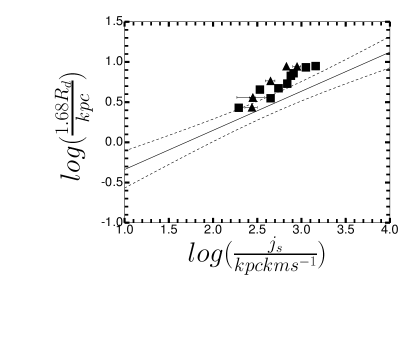
We next study if a higher value of the stellar specific angular momentum jstars leads to a larger disc size irrespective of the depth of the potential well as indicated by . In Figure 1, we present the regression line fitted to the 1.68 versus js values of the ordinary bulgeless disc galaxies along with its 95.4 confidence interval, and superpose the data for the LSB (solid squares) and superthin (solid triangles) samples on it. 1.68 could be taken to be the half-stellar mass radius of the galaxy (Jiang et al. 2018). We find that four out of the six superthins and most of the LSBs have systematically larger values compared to ordinary bulgeless disc galaxies for a given value of js.
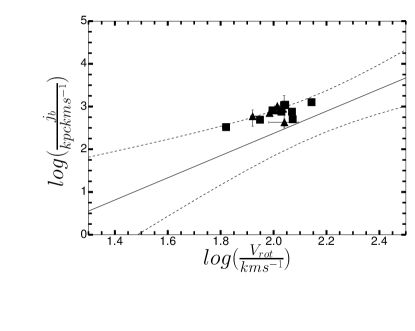
As discussed earlier, the size of the stellar disc is primarily regulated by a balance between its the specific angular momenta and its radial gravitational field; a stellar disc with a given specific angular momentum is expected to have a larger disc size in a shallower gravitational potential well and vice-versa. In Figure 2, we fit a regression line to the versus data for the ordinary spirals along with the 95.4 confidence band, being the asymptotic rotational velocity. We also superpose the versus data for the superthins (solid triangles) and LSBs (solid squares) on this plot. We find that for three out of our six superthins and seven out of our nine LSBs, the values lie above the 95.4 confidence band of the - regression line for ordinary bulgeless disc galaxies. We note that although the rest of the data points for the superthins lie within the 95.4 confidence band for the ordinary spirals, superthins and LSBs have systematically higher values of momenta as compared to the ordinary spirals for a given value of the asymptotic rotational velocity .
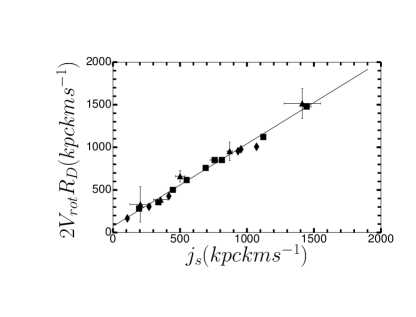
However, indicates the depth of the gravitational potential well of the galaxy. However, the actual radial gravitational field and hence the rotational velocity at any intermediate galacto-centric radius depends on the slope of the rotation curve. For a steeply rising rotation curve, the mean rotational velocity for the disc is close to whereas for a slowly rising rotation curve, the mean rotational velocity may be quite smaller than . In fact, we checked that even within each of the different galaxy types like the superthins, LSBs and the ordinary discs, there are steeply-rising to slowly-rising rotation curves. Among our superthins, for example, UGC7321 has the most steeply-rising rotation curve, followed by IC5249, NGC4244, FGC1540, IC2233 and UGC 711. In order to determine how compares with the mean rotational velocity, in Figure 3, we present a linear fit to the 2 RD versus data for all different galaxy samples taken together: LSBs, superthins and ordinary disc galaxies; 2 RD is representative of the stellar specific angular momentum according to Mo, Mao & White (1998). Interestingly, the slope and intercept of the regression line fit for all the galaxies taken together are 0.97 0.03 and 72.78 23.33, respectively. This plot and the fit parameters together indicate that the mean rotational velocity is roughly the same for all galaxy types, except for a couple of superthins, which seem to have a smaller mean velocity and hence a larger disc size for a given value of . Therefore, we may conclude that some superthins and LSBs may have higher values of for a given values of and hence larger disc sizes compared to an ordinary disc galaxy. This, in turn, may lead to a larger value of the planar-to-vertical axes ratio as compared an ordinary bulgeless spiral with the same value of .Therefore, a high value of the specific angular momentum may possibly drive the existence of superthin stellar discs in some LSBs.
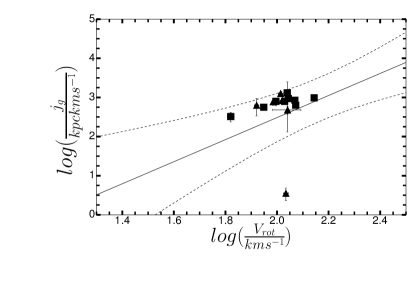
We next study the specific angular momenta of the gas discs to check for correlation, if any, between the specific angular momenta of the stellar and the gas discs in our sample superthins as the gas discs constitutes the progenitors of the stellar discs. In Table 11, we present the mass Mg, the angular momentum Jg and the specific angular momentum jg of our sample superthin galaxies as obtained from HI 21cm radio-synthesis observations, including corrections for the presence of Helium, and In Table 12, we present our corresponding values for the LSB sample. The gas mass Mg varies between 106.5 - 1010.0 M, 108.4 - 109.4 M for the superthins and the LSBs respepctively. In comparison, it varies between 108.4 - 1010.1 M for the ordinary discs. Besides, the respective median Mg values for the superthins, LSBs and ordinary discs are 109.2 M, 109.1 M and 109.5 M. Therefore the superthins and LSBs have Mg values comparable with those of the ordinary discs. We further note jgas is in general higher than js for all our sample superthins. In fact,this is the reflection of the fact that the gas disc larger in size than that of the stars. Following the stellar case, in Figure 4, we present a regression line fit to the versus data for the ordinary bulgeless spirals (black line) using the data of Obreschkow & Glazebrook (2014) along with its 95.4 confidence band (short-dashed line). We also superpose the versus data for the superthins (filled triangles) and LSBs (solid spheres) on this plot. Interestingly, we note that unlike the stellar component, superthins are consistent with the - relation of the ordinary spirals. However, we may note here that several of our sample galaxies have HI holes which indicates that the low angular momentum gas has been removed from them by supernovae explosions or other feedback effects. Therefore our calculated values of may not be representative of the primordial or original of these galaxies, and hence it is not trivial to link the to without careful modelling of feedback effects.
| Name | Mgas1 | Jgas 2 | jgas3 | ||||||
|---|---|---|---|---|---|---|---|---|---|
| Disc 1 | Disc 2 | Total | Disc 1 | Disc 2 | Total | Disc 1 | Disc 2 | Total | |
| UGC7321 | 9.63 | 8.40 | 9.65 | 15.72 | 13.95 | 15.73 | 6.10 | 5.55 | 6.10 |
| IC5249 | 6.51 | 6.51 | 10.06 | 10.36 | 3.55 | 3.55 | |||
| IC2233 | 8.21 | 8.61 | 8.75 | 13.62 | 14.36 | 14.44 | 5.41 | 5.76 | 5.68 |
| UGC711 | 10.02 | 10.02 | 15.94 | 15.94 | 5.92 | 5.92 | |||
| NGC4244 | 8.75 | 9.20 | 9.33 | 14.59 | 15.11 | 15.22 | 5.85 | 5.91 | 5.89 |
| FGC1540 | 9.14 | 8.10 | 9.18 | 14.95 | 13.66 | 14.97 | 5.81 | 5.57 | 5.80 |
-
1
In Log(M/M⊙)
-
2
In Log(J/(M⊙kms-1 pc))
-
3
In Log(j/(kms-1 pc))
| Name | Mg1 | Jg2 | jg3 |
|---|---|---|---|
| F563-V2 | 9.13 0.02 | 14.93 | 2.80 0.03 |
| F574-1 | 9.10 0.05 | 15.0 | 2.90 |
| F583-1 | 9.10 0.02 | 14.85 | 2.75 0.03 |
| F583-IV | 8.36 | 13.87 | 2.51 |
| F563-1 | 9.40 | 15.53 | 3.12 |
| F568-V1 | 9.14 | 15.07 | 2.93 |
| F568-1 | 9.37 0.02 | 15.37 0.03 | 2.99 0.03 |
| F568-3 | 9.22 | 15.12 0.06 | 2.90 |
| F579-V1 | 9.13 0.02 | 15.11 0.03 | 2.97 |
-
1
In Log(M/M⊙)
-
2
In Log(J/(M⊙kms-1 pc))
-
3
In Log(j/(kms-1 pc))
Finally, in Tables 13 and 14, we present the total baryonic mass Mb, the baryonic angular momentum Jb and the baryonic specific angular momentum
jb of our sample superthin galaxies and LSBs respectively. In case of the superthins, both jb and Mb closely reflect
jg and Mg respectively. In contrast, the jb and Mb for LSBs and ordinary spirals are not indicative of the values of any single disc component i.e., stars or gas. In fact, for ordinary spirals, Mb is significantly higher than Mg, and jb is
quite less than jg (Obreschkow & Glazebrook 2014). In Figure 5, we present a regression line fit to the versus data for the ordinary bulgeless spirals using the data of Obreschkow & Glazebrook (2014) along with its 95.4 confidence band. We also superpose the versus data for the superthins (solid triangles)and LSBs (solid squares) on this plot. As in the gas disc case, for a given value of Vrot,
all of superthins and LSBs have jb comparable with the ordinary discs.
(See Appendix for a similar study involving the correlation of the
js - Ms, jg - Mg and
jb - Mb values i.e., the Fall Relation.)
| Name | Mbaryons1 | Jbaryons2 | jbaryons3 |
|---|---|---|---|
| UGC7321 | 9.84 | 15.84 | 6.01 |
| IC5249 | 9.04 | 15.00 | 5.95 |
| IC2233 | 8.89 | 14.52 | 5.63 |
| UGC711 | 10.04 | 15.95 | 5.91 |
| NGC4244 | 9.40 | 15.25 | 5.85 |
| FGC1540 | 9.25 | 15.03 | 5.77 |
-
1
In Log(M/M⊙)
-
2
In Log(J/(M⊙kms-1 pc))
-
3
In Log(j/(kms-1 pc))
| Name | Mstars1 | Jstars2 | jstars3 |
|---|---|---|---|
| F563-V2 | 9.62 0.01 | 15.32 | 2.70 0.01 |
| F574-1 | 9.72 0.01 | 15.63 | 2.91 0.02 |
| F583-1 | 9.19 0.02 | 14.88 | 2.69 |
| F583-IV | 9.10 0.01 | 14.62 | 2.52 0.02 |
| F563-1 | 9.58 | 15.61 | 3.03 |
| F568-V1 | 9.55 0.02 | 15.43 0.02 | 2.88 0.03 |
| F568-1 | 9.79 0.01 | 15.89 0.01 | 3.10 0.01 |
| F568-3 | 9.76 0.01 | 15.65 0.02 | 2.88 |
| F579-V1 | 10.01 0.002 | 16.05 0.005 | 3.04 0.01 |
-
1
In Log(M/M⊙)
-
2
In Log(J/(M⊙kms-1 pc))
-
3
In Log(j/(kms-1 pc))
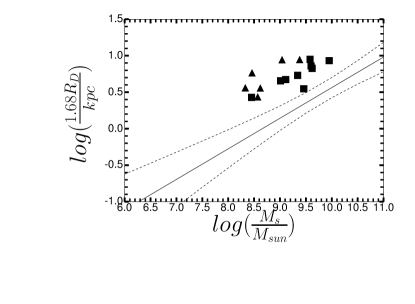
Size-Mass Relation: We also study the size-mass relation in our superthin and LSB samples following earlier studies in the literature, which showed the afore-mentioned scaling relation strongly depends on the galaxy morphology, with late-types having characteristically larger disc sizes compared to early-type galaxies (See, for example, Shen et al. 2003). In Figure 6, we present the regression line fit to 1.68 RD, which is the half stellar mass radius and hence a proxy for the stellar disc size versus the stellar mass Ms to the data for the ordinary spirals. Superposed on it are the data points for the superthins (solid triangles), LSBs (solid squares). We observe that the superthins and LSBs all lie outside the 95.4 band of the ordinary spirals, implying that they have larger disc size for a given stellar mass as compared to the ordinary spirals. We observe that all the LSBs and the superthins lie outside the 95.4 confidence band of the of the ordinary spirals. This indicates that they have significantly larger disc size compared to ordinary spirals with the same stellar mass, which is in line with the - Fall relation.
4 Discussion
Possible origin of discs with high specific angular momenta:
-
•
High spin parameter: During the early phases of their formation and evolution, galaxies acquire their angular momentum by the action of the tidal torque generated by the gravitational field of their global environment (White 1974). The angular momentum thus acquired can be characterized by a dimensionless parameter referred to as the spin parameter , which may be given by = where is the specific angular momentum of the disc or the dark matter halo, and Rvir and Vvir are the virial radius of the dark matter halo, and its velocity at Rvir respectively (Bullock et al. 2001). In Table 15, we summarize the parameters for our stellar (), gas () and baryonic discs respectively. We further note here that we have not given the parameters of several galaxies in this table as we did not have reliable parameters of mass models with an NFW dark matter halo. Interestingly, we find that both the and values of the superthins are almost an order of magnitude higher than those of the ordinary discs and most of the LSBs. Investigating the origin of the high values of in superthin galaxy, and its implications for a superthin disc can be a possible future study.
Besides, earlier studies considered the spin parameters of the disc and the dark matter halo to be equal assuming the conservation of the specific angular momentum of the gas (Fall & Efstathiou 1980, for example). Therefore, in semi-analytical studies of galaxy formation, the spin parameter of the dark matter halo is often used to predict the size of the stellar disc of the galaxy using the relation Re = Rvir where is the half-mass radius of the galaxy, also assuming the asymptotic rotational velocity Vrot to be equal to the virial velocity Vvir. In Figure 7, we plot of the characteristic radius of an exponential stellar disc 1.68 RD versus Rvir for the superthins (solid triangles), LSBs (solid squares) and ordinary discs (solid rhombuses). The large error bars on the LSB data points are due to the uncertainties in the NFW model of their dark matter halos. We find that there is no clear correlation between 1.68 RD and Rvir, which indicates that the stellar disc size is not strongly governed by their dark matter halo properties.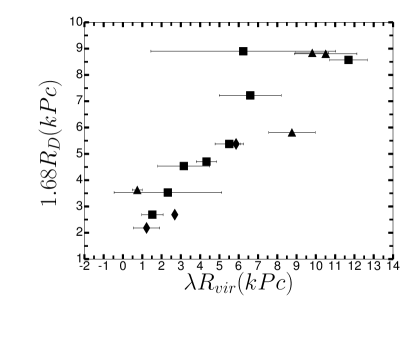
Figure 7: Plot of the characteristic radius of an exponential stellar disc 1.68 versus Rvir for the superthins (solid triangles), LSBs (solid squares) and ordinary discs (solid rhombuses) where is the dimensionless spin parameter of the stellar disc given by , and being the virial velocity and virial radius of the galaxy respectively. The stellar photometry corresponds to the 3.6 band for all the galaxy types except for the LSBs for which it is the B-band. Also, for galaxies with two exponential stellar discs, corresponds to the disc scale length of the larger disc. Table 15: Dimensionless spin parameter Name Superthins UGC 7321 0.15 0.01 0.27 0.03 0.22 0.02 IC 5249 0.13 0.02 0.0005 0.0002 0.13 0.02 IC 2233 0.002 0.001 0.003 0.001 0.003 0.001 FGC 1540 0.18 0.02 0.25 0.12 0.23 0.09 LSB F563-1 0.04 0.00 0.08 0.07 0.07 0.05 F568-3 0.008 0.031 0.008 0.032 0.008 0.032 F579-V1 0.13 0.01 0.11 0.01 0.12 0.01 F583-1 0.01 0.00 0.04 0.01 0.03 0.01 F583-4 0.03 0.01 0.03 0.01 0.03 0.01 F563-V2 0.01 0.01 0.02 0.02 0.01 0.02 F574-1 0.06 0.01 0.05 0.01 0.06 0.01 F568-V1 0.05 0.01 0.06 0.01 0.05 0.01 F568-1 0.03 0.02 0.02 0.01 0.02 0.02 Spirals NGC 2403 0.02 0.00 0.05 0.00 0.04 0.00 NGC 3198 0.04 0.00 0.12 0.00 0.07 0.00 NGC 7793 0.01 0.00 0.01 0.00 0.01 0.00 -
•
Galaxy size versus dark matter halo concentration parameter: Zoom-in cosmological simulation studies by Jiang et al. (2018) have lately revealed that galaxy size is in fact strongly regulated by the concentration parameter of its dark matter halo according to the equation Re = Rvir where = 0.02 (c/10)-0.7. This implies galaxies with smaller disc size reside in smaller halos and vice-vera. We plotted the characteristic radius of an exponential stellar disc as predicted from cosmological hydrodynamical simulations of Jiang et al. (2018) versus , the exponential stellar disc scale length as determined from observations. We obtained the regression line fit to the ordinary bulgeless spirals and the dotted line the 95.4 confidence interval of the same. Superposed on the plot were the versus data for the superthins (solid triangles) and LSBs (solid squares). However, our results showed that the disc scale length RD is not driven by the the concentration parameter of its dark matter halo, and therefore not quite in agreement with the simulation results.
-
•
Stellar specific angular momentum versus gas mass fraction: Recent semi-analytical modelling studies of the inter-relation between the size and the angular momentum of galaxies by Zoldan et al. (2017) have indicated the existence of a strong correlation between the stellar specific angular momentum jg and gas mass fraction Mg/Mb of galaxies. This could be explained on the basis of the fact that gas-poor galaxies i.e., galaxies with low values of Mg/Mb are hosted in larger or more massive halos, and therefore undergo a phase of rapid star formation at early phases of its evolution when the angular momentum acquired by the galaxy is quite low. Gas-rich galaxies, on the other hand, are hosted in smaller halos, and hence undergo star formation at a relatively slower pace until the present epoch when the angular momentum content of the halo is higher. In Figure 8, we plot the regression line fit to the versus Mg/Mb for the data for the ordinary spirals with its 95.4 confidence interval. Superposed on it are the data points for the superthins (solid triangles) and LSBs (solid squares). We may also note here that the gas mass fraction considered in the above study was Mg/Mb > 0.15, which matches the range of our sample galaxies. We observe that the positive slope of the regression line complies with the trend predicted by the simulations, and the data for the LSBs are roughly in agreement with it. Interestingly, however, the superthins seem to be indicating a trend opposite to that predicted by the above study, which is puzzling.
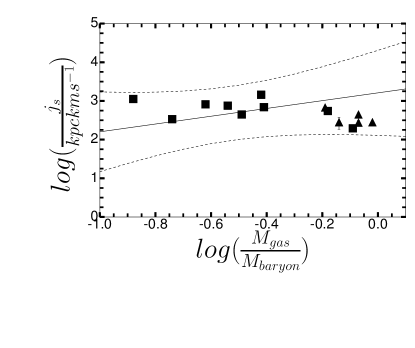
Figure 8: Plot of the stellar specific angular momentum versus the gas mass fraction Mg/Mb. The solid line represents the regression line fit to the ordinary bulgeless spirals and the dotted line the 95.4 confidence interval of the same.The slope and intercept of the line is given by and respectively. Superposed on the plot are the data for the superthins (solid triangles) and LSBs (solid squares).
Specific angular momenta of superthins versus those of dwarf-irregulars:
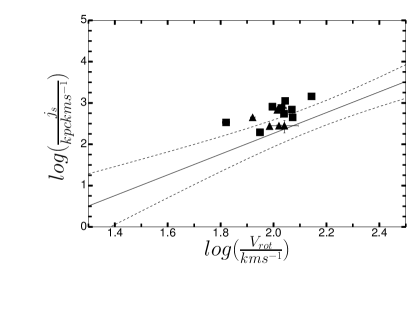
Recent studies have focused on the comparison of the specific angular momenta of dwarf-irregular galaxies with those of ordinary disc galaxies (Chowdhury & Chengalur 2017, Kurapati, Chengalur & Pustilnik 2018). Both dwarf-irregulars and low surface brightness galaxies including superthins constitute the (very) late-type galaxy population. However, dwarf-irregulars are characterized by a lower dynamical mass as indicated by asymptotic rotational velocity Vrot values between 10 - 50 kms-1 whereas LSBs have the same between 80 - 120 kms-1. In Figure 9 , we present the plot of the specific angular momenta of the stellar discs js versus the asymptotic rotational velocities Vrot. The solid line represents the regression line fit to the ordinary bulgeless spirals and the dotted line the 95.4 confidence interval of the same.The slope and intercept of the line is given by and respectively. Superposed on the plot are the versus data for the superthins (filled triangles), LSBs (filled squares) and dwarf-irregulars (filled circles). It clearly shows that unlike most of the LSBs and the superthins, the js values of the dwarf-irregulars lie within the 95.4 confidence band for that of the ordinary spirals, implying the dwarf-irregulars do not have characteristically higher js values than those of the ordinary spirals. Interestingly, our calculated values of the parameters of the dwarf-irregulars also came out to be an order of magnitude smaller than those of the superthins and LSBs.
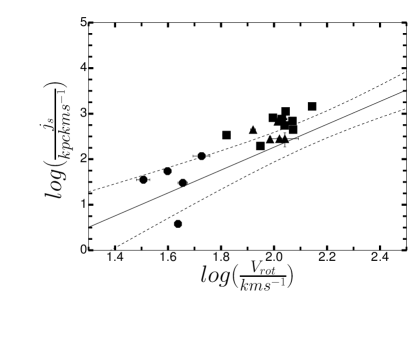
. Superposed on the plot are the versus data for the superthins (filled triangles), LSBs (filled squares) and dwarf-irregulars(filled circles).
5 Conclusions
Superthin galaxies are edge-on or nearly edge-on low surface brightness galaxies (LSBs) with strikingly high values of planar-to-vertical axes ratio 10 - 20 with little or no discernable bulge component. We primarily investigate if the high values of planar-to-vertical axes ratio in superthin galaxies is the reflection of a larger stellar disc size due to a higher value of their stellar specific angular momentum for a given value of the gravitational potential well, the depth of which may be represented by its aymptotic rotational velocity Vrot as compared to bulgeless ordinary disc galaxies, as well as to a given stellar mass Ms. Our sample consists of six superthin galaxies for which stellar photometry, atomic hydrogen (HI) surface density and high resolution HI rotation curves were already available in the literature. However the angular momenta of our sample superthin galaxies were not studied earlier. In addition, we also study a sample of nine general LSBs for which all the necessary input parameters were available as well.
We find that the characteristic sizes of the stellar discs, which is defined as 1.68 RD where RD is the exponential stellar disc scale length, for several of the superthins and LSBs and are higher for a given value of as compared to ordinary bulgeless disc galaxies at high levels of statistical significance. This already hints at the fact that the depth of the gravitational potential wells in which some of the low surface brightness galaxies are hosted are possibly shallower compared to ordinary disc galaxies. In fact, we find that the values of only three out of our six superthins and only seven out of our nine LSBs lie above the 95.4 confidence band of the - regression line for ordinary bulgeless disc galaxies, being the asymptotic rotational velocity while the rest lie within it, although systematically higher than those of the ordinary bulgeless spirals with the same . indicating superthin galaxies and LSBs in general may have higher values of and hence larger disc size RD compared to ordinary spirals with the same , which may drive the large planar-to-vertical axes ratios of the stellar discs in superthin galaxies.
Interestingly, however, we find that the gas specific angular momenta values of our superthins and LSBs lie within the 95.4 confidence band of the - regression line for ordinary bulgeless disc galaxies. Since the gas discs are the progenitors of the stellar discs, lack of agreement with the - relations inspite of compliance with the - relation is a possible reflection of the characteristically different routes of evolution followed by the ordinary spirals versus the low luminosity galaxies.
Finally, we also obtain the - for the ordinary spirals and compare them with the data for the superthins and LSBs .
We find that the total baryonic specific angular momenta values of our superthins and LSBs lie within the 95.4 confidence band of the - regression line for ordinary bulgeless disc galaxies, indicating that the gas discs in superthins and LSBs have specific angular momentum comparable with those of the ordinary bulgeless disc galaxies for a given
or depth of the gravitational potential well. However, in this case, the values of the superthins and LSBs were found to be systematically higher than those of the ordinary bulgeless disc galaxies. Therefore, the - relation is a reflection of the - in the galaxies.
In addition, we investigate the possible origin of a stellar disc with high values in the superthins and LSBs. We find that the median spin parameter , and being the virial velocity and virial radius of the galaxy respectively, is 0.13 0.01 for superthin galaxies which is an order of magnitude higher than those of LSBs and ordinary spirals, which may have important implications for the existence of superthin stellar discs in these low surface brightness galaxies. We also find that the the stellar specific angular momentum moderately correlates with the gas mass fraction / for the ordinary disc galaxies as well as most of the LSBs in agreement with the results of recent numerical studies. Finally, we compare the specific angular momenta of the stellar discs of superthins and LSBs with those of the dwarf-irregulars, another class of gas-rich and dark matter-dominated late-type galaxies but not characterized by superthin discs. We find that for a given value of , the dwarf irregulars have values comparable to those of the ordinary discs in contrast to superthins or LSBs.
Acknowledgements
The authors would like to thank Ms. Sushma Kurapati for providing the data for FGC1540 and also acknowledge DST-INSPIRE Faculty Fellowship (IFA14/PH-101) for supporting this research. We would also like to thank the anonymous referee for the detailed comments which have helped to improve the quality of the paper.
References
Banerjee, A. & Jog, C. J. 2013, MNRAS, 431, 582
Banerjee A., Matthews L. D., Jog C. J., 2010, NewA, 15, 89
Barbanis, B., Woltjer, L. 1967, ApJ, 150, 461
Begum, A. , Chengalur, J.N. 2004, A&A, 424, 509
Bizyaev, D. V., Kautsch, S. J., Sotnikova, N. Ya., Reshetnikov, V. P., Mosenkov, A. V., 2017, MNRAS, 465, 3784
Brandt, J.C. 1960, ApJ, 131, 293
Bureau, M., Athanassoula, E. 2005, ApJ, 626, 59
Chowdhury, A., Chengalur, J. N. 2017, MNRAS, 467, 3856
Dalcanton, J., Spergel, D. N., Gunn, J. E., Schmidt, M., Schneider, D. P. 1997, AJ, 114, 2178
Efstathiou G., Lake G., Negroponte J., 1982, MNRAS, 199, 1069
Garg, P. & Banerjee, A. 2017, MNRAS,
Ghosh S., Jog, C. J. 2014, MNRAS, 439, 929
Grand, R. J. J., Springel, V., Gomez, F. A., Marinacci, F., Pakmor, R., Campbell, D. J. R., Jenkins, A. 2016, MNRAS, 459, 199
Karachentsev I., 1989, AJ, 97, 1566
Karachentseva, V. E., Kudrya, Yu. N., Karachentsev, I. D., Makarov, D. I., Melnyk, O. V. 2016, AstBu, 71, 1
Kautsch S. J., 2009, PASP, 121, 1297
Khoperskov A., Bizyaev D., Tiurina N., Butenko M., 2010, Astron. Nachr., 331, 731
Kurapati, S., Chengalur, J.N., & Pustilnik, S. 2018, MNRAS, 479, 228
Matthews, L. D., Uson, Juan M. 2008, ApJ, 688, 237
Mendelowitz, C. M., Matthews, L. D., Hibbard, J. E., Wilcots, E. M. 2000, BAAS, 32, 1459
Obreschkow, D., Glazebrook, K. 2014, ApJ, 784, 26
O’Brien J. C., Freeman, K. C., van der Kruit, P. C. 2010c, A&A, 515, 62
Patra, N. N., Banerjee, A., Chengalur, J.N. & Begum, A. 2014, MNRAS, 479, 5686
Peebles P. J. E., 1969, ApJ, 155, 393
Posti, L., Pezzulli, G., Fraternali, F., Di Teodoro, E. M. 2018, MNRAS, 475, 232
Posti, L., Fraternali, F., di Teodoro, E., Pezzulli, G. 2018, arXiv180404663
Qu, Y., Di Matteo, P., Lehnert, M. D., van Driel, W. 2011, A&A, 399, 879
Rosenbaum, S. D., Krusch, E., Bomans, D. J., Dettmar, R.-J. 2009, A&A, 504, 807
Uson, Juan M., Matthews, L. D. 2003, AJ, 125, 2455
Velazquez, H., White, S. D. M. 1999, MNRAS, 304, 254
Walker, I. R., Mihos, J. C., Hernquist, L. 1996, ApJ, 460, 121
White S. D. M., 1984, ApJ, 286, 38
Zoldan, A., De Lucia, G., Xie, L., Fontanot, F., Hirschmann, M. 2018, arXiv180308056
Zschaechner, L. K., Rand, R. J., Heald, G. H., Gentile, G., Kamphuis, P. 2011, ApJ, 740, 35
Appendix
We study the Fall relation (1983) i.e. the correlation between specific angular momentum and disc mass in the stellar, gas and baryonic discs in our superthin and LSB samples. In Figure 10, we plot the regression line fit to the - data along with the 2- or 95.4 confidence band for the ordinary discs, and superpose the data for the superthins and LSBs and on the same. It clearly shows that for a given stellar mass Ms, superthin (solid triangles) and LSBs (solid triangles) have distinctly higher values of specific angular momenta compared to ordinary bulgeless spiral galaxies, lying outside the 2- or 95.4 confidence band of the - scaling relation for bulgeless disc galaxies. This anomaly with respect to bulgeless disc galaxies may be possibly understood from the origin of the above scaling relation i.e., disc galaxies are rotationally-supported in the plane against collapse due to the net gravitational field due to the mass of the stars (Ms), gas (Mg) and the dark matter halo (MDM) (Obreschkow & Glazebrook 2014). Therefore is equivalent to the total dynamical mass of the galaxy i.e., Mdyn = Ms + Mg+ MDM, and mass of the stars Ms represents a fraction of Mdyn. Therefore, the deviation of the data points corresponding to the superthins and LSBs from the - scaling relation obeyed by the ordinary spirals reflects that the stellar mass fraction in the total dynamical mass is significantly smaller than that in ordinary spirals. This is evident given the low star formation rates in the galaxies as is indicated by their low luminosity or low surface brightness nature, as the case may be. In fact, we find that late-type galaxies comprising a sample of superthins and LSBs obey a different scaling relation, given by a regression line of slope of 0.41 0.082, and an intercept of -1.02 0.749; this is distinct from the regression line corresponding to the ordinary spirals, characterized by a slope of 0.87 0.076 and intercept of -5.85 0.753. Interestingly, the slope of the regression line obtained for the late-types alone closely matches those for the fundamental angular momentum-mass relation encompassing all galaxy morphologies from dwarf-irregulars to massive spirals (Posti et al. 2018).
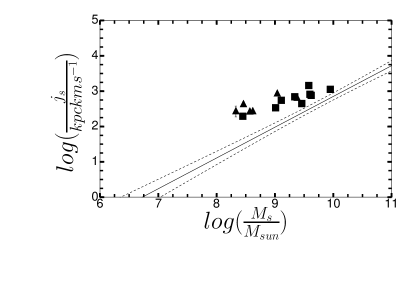
Superposed on the plot are the versus Ms data for the superthins (solid triangles), LSBs (solid squares)
In Figure 11, we plot the specific angular momenta of gas discs versus gas masses of superthins (solid triangles), LSBs (solid squares) as obtained in this paper and compare them with the jg - Mg scaling relation of bulgeless ordinary spirals with its 95.4 confidence band. Interestingly, unlike the stellar case, the jg values of our sample superthins fall within the 2- band of the jg - Mg scaling relation as the ordinary spirals, and therefore could be said to obey the same scaling relation as the ordinary spirals. Arguing along the same lines as in the stellar case, we may say that the gas mass fraction in the total dynamical mass of the galaxy is the same in the superthins, LSBs as in the ordinary bulgeless spirals. This is further reflected by the fact that regression lines fitted to the respective data sets of the the superthins, the LSBs taken together, and the ordinary bulgeless spirals overlap with each other within error bars; the former has a best-fitting slope of 0.74 0.077 and an intercept of -3.99 0.705, whereas, for the latter, the values are 0.83 0.090 and -4.86 0.89 respectively. This further confirms that the gas mass fraction in the total dynamical mass of the galaxy is roughly constant irrespective of the morphological type of the late-type galaxies.
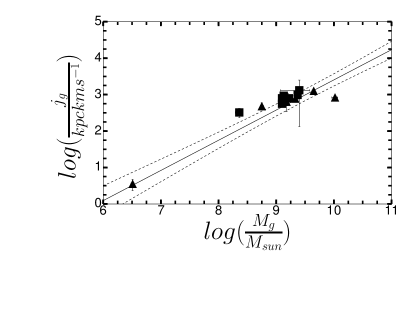
Superposed on the plot are the versus Mg data for the superthins (solid triangles), LSBs (solid squares).
In Figure 12, we present a regression line fit to the versus Mb data for the ordinary bulgeless spirals using the data of Obreschkow & Glazebrook (2014) along with its 95.4 confidence band. We also superpose the versus Mb data for the superthins (solid triangles) and LSBs (solid squares) on this plot. As in the stellar case disc case, for a given value of Mb, all of superthins, LSBs have jb values much greater than those of the ordinary discs with the same Mb value.
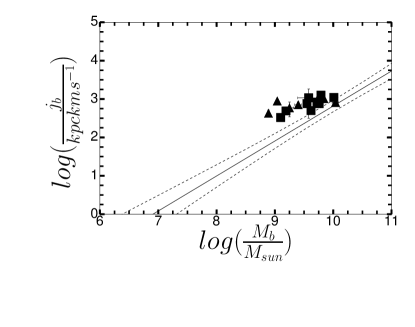
Superposed on the plot are the versus Mb data for the superthins (solid triangles), LSBs (solid squares).