Steplike metamagnetic transitions in a honeycomb lattice antiferromagnet Tb2Ir3Ga9
Abstract
Single crystals of a honeycomb lattice antiferromagnet, Tb2Ir3Ga9 were synthesized, and the physical properties have been studied. From magnetometry, a long-range antiferromagnetic ordering at 12.5 K with highly anisotropic magnetic behavior was found. Neutron powder diffraction confirms that the Tb spins lie along the -axis, parallel to the shortest Tb-Tb contact. Two field-induced spin-flip transitions are observed when the field is applied parallel to this axis, separated by a plateau corresponding roughly to MMs/2. Transport measurements show the resistivity to be metallic with a discontinuity at the onset of Néel order. Heat capacity shows a -like transition confirming the bulk nature of the magnetism. We propose a phenomenological spin-Hamiltonian that describes the magnetization plateau as a result of strong Ising character arising from a quasidoublet ground state of the Tb3+ ion in a site of Cs symmetry and expressing a significant bond dependent anisotropy.
I Introduction
Materials containing honeycomb lattices decorated by metals with strong spin-orbit coupling are potential hosts for Kitaev quantum spin liquids (QSL) (Kitaev, 2006; Chaloupka et al., 2010). The essential ingredient for understanding magnetism in these systems is a dominant bond-directional anisotropic exchange that leads to magnetic frustration (Jackeli and Khaliullin, 2009; Chun et al., 2015). Recent attention to and transition metal-based candidates such as -RuCl3 (Kim et al., 2015) and A2IrO3 (A=Li, Na) (Chaloupka et al., 2010; Singh et al., 2012) underscores the interest in this honeycomb structural motif, with the bond-directional anisotropy a consequence of the spin-orbit coupling derived =1/2 ground state assigned to the transition metals. Decoration of the honeycomb lattice with rare-earth ions offers an alternative to - and -based materials, with YbCl3 (isostructural with -RuCl3) suggested as a potential Kitaev QSL candidate (Xing et al., 2019). Addionally, a recent theoretical treatment of spin-orbital entanglement in rare-earth honeycomb magnets by Luo and Chen (Lou and Chen, 2019), and others (Jang et al., 2019; Clark et al., 2019) highlights the need to explore such systems.
A nearly ideal honeycomb lattice of rare earth ions is found in a family of compounds with general formula, R2T3X9 ( R is a rare-earth element, T is a transition metal element and X is a -block element) (Grin et al., 1984; Sichevych et al., 2006). This family, typified by the Y2Co3Ga9 structure (Grin et al., 1984) occupies a large composition space and hosts a rich variety of electronic properties ranging from complex magnetically ordered states (Dy based compounds), mixed valence (Yb,Ce based compounds) and Kondo lattice behavior (Yb based compounds) (Gorbunov et al., 2018; Gordon et al., 1996; Dhar et al., 1999; Trovarelli et al., 1999; Routsi and Yakinthos, 2001; Okane et al., 2002; Troć et al., 2007; Niermann et al., 2004a).
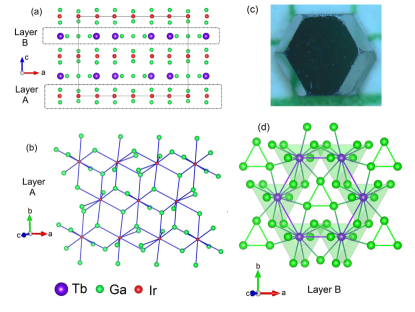
The layered structure of R2T3X9, along the [001] direction can be viewed as a stacking of two alternating types of layers (Sichevych et al., 2006) (Fig. 1). The R and X atoms form a planar layer with the composition R4X6, which contains a two-dimensional honeycomb-like arrangement of R atoms. The other layer is strongly puckered with T and X atoms forming a hexagonal arrangement, with T:Ga ratio of 1 : 2 (T6X12). Overall stacking is such that the resulting structure is orthorhombic with space group Cmcm no. 63. The physical properties of these compounds depend on identity of X and T atoms that surround the R atom. Depending on the ligand X atoms, systems with the same R atom can be magnetic in some cases and non-magnetic in others (Gorbunov et al., 2018). It is evident that the Al-containing compounds Yb2T3Al9 are magnetic, whereas their Ga-containing analogues are paramagnets down to the lowest temperatures measured (Gorbunov et al., 2018; Dhar et al., 1999; Trovarelli et al., 1999). Thus, the interactions between R atoms via the RKKY mechanism coupled with the large magnetocrystalline anisotropy due to crystal electric field (CEF) acting on R atom could lead to complex magnetic states in this family of compounds. Indeed, multiple commensurate and incommensurate phases as well as field induced metamagnetic states have been reported (Gorbunov et al., 2018). As such, this family of compounds presents an opportunity to understand the interplay between various hybridization strengths of different d, and f electrons and ligand atoms in a layered structure where the magnetic R atoms form a slightly distorted honeycomb lattice.
Interestingly, Tb containing compounds, such as Tb2T3X9, have not been explored and in this article we present our study on single crystalline Tb2Ir3Ga9 . Magnetization measurements reveal a long-range antiferromangetic ordering at 12.5 K. The magnetic susceptibility is highly anisotropic, with strong preference for in plane magnetization. Two field-induced metamagnetic transitions separated by a plateau of MMs/2, where Ms is the saturation moment, are observed when the field is applied along the crystallographic -axis, which is also the magnetic easy axis. A finite ferromagnetic-like response was observed along the -axis, although neither nor -axes show field-induced metamagnetic transitions. Neutron powder diffraction supports the observed magnetic behaviors by revealing the zero field ground state to be a collinear two-sublattice antiferromagnet (AFM) with spins along the axis. Based on observed properties, we present a phenomenological spin model to describe the magnetic behavior for Tb2Ir3Ga9 . Notably, incorporation of a bond-directional anisotropy term with significant weight, is essential for agreement between theory and experiment, making contact with the phenomenology of transition-metal based honeycomb magnets.
This article is arranged as follows. In section II, experimental methods and processes are described. In section III, results of magnetization, transport, specific heat, X-ray magnetic circular dichroism (XMCD), neutron powder diffraction (NPD) measurements, and the electronic structure calculations are presented. In section IV, a phenomenological theory of the magnetization in Tb2Ir3Ga9 is presented. Finally, in section V we conclude with discussion of the ground state properties of Tb2Ir3Ga9.
II Experimental description
Single crystals of Tb2Ir3Ga9 were synthesized using a Ga-flux method. The starting materials, Tb pieces (Alfa Aesar, 99.9), Ir powder (Alfa Aesar, 99.99), and Ga pellet (Alfa Aesar, 99.9999) in the molar ratio of 1:2:20, were placed in an alumina crucible and sealed under vacuum in a fused silica tube. The ampoule was heated to 1170∘ C and held for 12 hours, then cooled to 500∘C at a rate of 5∘C per hour. The excess flux was removed using a centrifuge. The resultant crystals are in the form of hexagonal platelets with an average size of few millimeters (mm) on an edge, as shown in Fig. 1c.
One large piece of Tb2Ir3Ga9 single-crystal was cut into smaller pieces with appropriate dimensions () for single crystal x-ray diffraction measurements. A tiny piece of crystal was mounted on a glass fiber and measured on a STOE IPDS 2T. Data collection, integration and absorption correction were done by the x-area software package (Stoe, 2005). The structure of Tb2Ir3Ga9 was solved and further refined based on the full matrix least-squares using the SHELXTL program package (Sheldrick, 2015). An empirical absorption correction was applied to the measured data. The refinement results including the lattice parameters and atomic positions are consistent with the previous reports on a polycrystalline sample (Grin and Rogl, 1989). Several pieces of crystals were pulverized and powder XRD was performed on a PANAlytial X’Pert Pro diffractometer. Magnetization measurements were carried out in a Quantum Design SQUID magnetometer using the DC magnetization method. For susceptibility, both zero-field-cooled (ZFC) and field-cooled (FC) data were measured. Isothermal magnetization data were measured by first cooling the sample in zero field to 1.8 K and then applying field to 7 T.
Transport measurements were performed in a Quantum Design Physical Property Measurement Systems (PPMS). A piece of crystal was polished to a rectangular shape with dimensions 10.60.1 mm3 and then gold wire (25 micron) contacts were placed using Epotek H20E Epoxy. A four-probe contact method was used for the AC resistivity measurement with an excitation current of 3-5 mA at a frequency of 57.9 Hz. Heat capacity measurement was performed in a Quantum Design Dynacool PPMS. A time relaxation method was employed and the data were measured on heating from 1.8 K to 200 K under zero applied field.
The angular dependence of the metamagnetic transition was measured in a 65 T magnet at the Pulsed-Field Facility, National High Magnetic Field Laboratory, Los Alamos (Singleton et al., 2004). The metamagnetic transitions were measured in two rectangular samples using the Proximity-Detector Oscillator (PDO) method. Samples were rotated from field parallel to crystallographic -axis to axes. A more in depth discussion about the PDO technique can be found in Refs. (Ghannadzadeh et al., 2011; Altarawneh et al., 2009).
Neutron powder diffraction (NPD) measurements were performed on the time-of-flight powder diffractometer, POWGEN, located at the Spallation Neutron Source at Oak Ridge National Laboratory. The data were collected with neutrons of central wavelengths 1.5 and 2.665 Å, covering the spacing range 0.4812.95 and 0.35.87 Å-1, respectively. Several high-quality crystals were pulverized to obtain around 0.55 g powder that was loaded in a special annular vanadium container to reduce the absorption effect from Tb and Ir and gain more diffraction intensity. A Powgen Automatic Changer (PAC) was used to cover the temperature region of 10300 K. We collected the data at 10, 50 and 300 K. All of the neutron diffraction data were analyzed using the Rietveld refinement program suite FULLPROF (Rodríguez-Carvajal, 1993).
XMCD data were collected at beamline 4-ID-D of the Advanced Photon Source (APS). Two single crystals with surface normals along the crystallographic - and - directions were polished to 20 microns thickness for transmission experiments at Tb L3 and Ir L2,3 absorption edges. Crystals were mounted in a variable temperature insert of a cryogenic superconducting magnet and cooled to 1.5 K in helium vapor. Magnetic field was applied parallel to - or -axis. XMCD data were collected in helicity switching mode (fixed magnetic field direction) whereby the helicity of circularly polarized x-rays produced with phase retarding optics is modulated at 13.1 Hz, and the corresponding modulation in x-ray absorption coefficient is detected with a phase lock-in amplifier (Haskel et al., 2007). XMCD measurements were done with applied magnetic field both along and opposite the wave vector of the incident x-ray beam to check for experimental artifacts of non-magnetic origin.
III Results & discussion
Crystal Structure
The crystal structure of Tb2Ir3Ga9 is orthorhombic, crystallizing in space group Cmcm (no. 63), and is isotypic with Y2Co3Ga9 (Grin et al., 1984). As shown in Fig. 1, the structure can be viewed as an alternation of two layers along the [0 0 1] direction. Layer A is strongly puckered with a hexagonal arrangement and consists of Ir and Ga in a 1:2 ratio. Layer B lies in a mirror plane with the Tb atoms arranged in a slightly distorted honeycomb structure. The Tb-Ga coordination in a unit cell is Tb4Ga6. Together these layers form the crystal in a stacking sequence of (AB)2. The ratio of lattice parameters a/b = 1.725, close to , reflecting a small deviation from hexagonal symmetry. This is similar to other R2T3Ga9 compounds with Y2Co3Ga9 structure type (Sichevych et al., 2006; Niermann et al., 2004b; Gorbunov et al., 2018).
| Empirical Formula | Ga9Ir3Tb2 |
|---|---|
| Formula Weight | 1521.92 g/mol |
| Wavelength | 0.71073 Å |
| Crystal System and Space Group | Orthorhombic, |
| Unit Cell Dimensions | a = 12.9860(5) Å |
| b = 7.5325(9) Å | |
| c = 9.4349(9) Å | |
| = = = 90∘ | |
| Volume | 922.89(2) Å3 |
| Density (calculated) | 10.953 mg/m3 |
| Linear Absorption Coefficient | 83.867 mm-1 |
| F(000) | 2560 electrons |
| Crystal Size | 0.110.10.95 mm3 |
| Range | 3.126 to 31.843. |
| Index Range | -19=h=18, -11=k=11, -13=l=13 |
| No. of Reflections | 5326 |
| Independent Reflections | 857[Rint = 0.1140] |
| Absorption Correction | empirical |
| Max. and min. Transmission | 0.0786 and 0.0176 |
| Refinement Method | Full-matrix least-squares on F2 |
| Data / Restraints / Parameters | 857 / 0 / 42 |
| Goodness of Fit | 1.151 |
| Rfinal indices | R1 = 0.0385, wR2 = 0.1006 |
| R indices (all data) | R1 = 0.0431, wR2 = 0.1038 |
| Extinction Coefficient | 0.00066(7) |
| Largest diff. Peak and Hole | 4.766 and -4.565 e.Å-3 |
The results of the single-crystal x-ray diffraction are given in Table 1. A crystal with a shape close to a cube (0.11 0.1 0.095 mm3) gives the lowest Rint (11%) and reasonable thermal displacements during the refinement. The large residual electron peaks and holes close to the heavy elements Ir and Tb atoms are likely due to an inadequate absorption correction. Detailed descriptions of the atomic coordinates, refinement parameters and bond lengths of the atoms are given in the supplemental materials (SM) (sup, ).
Magnetism and Transport
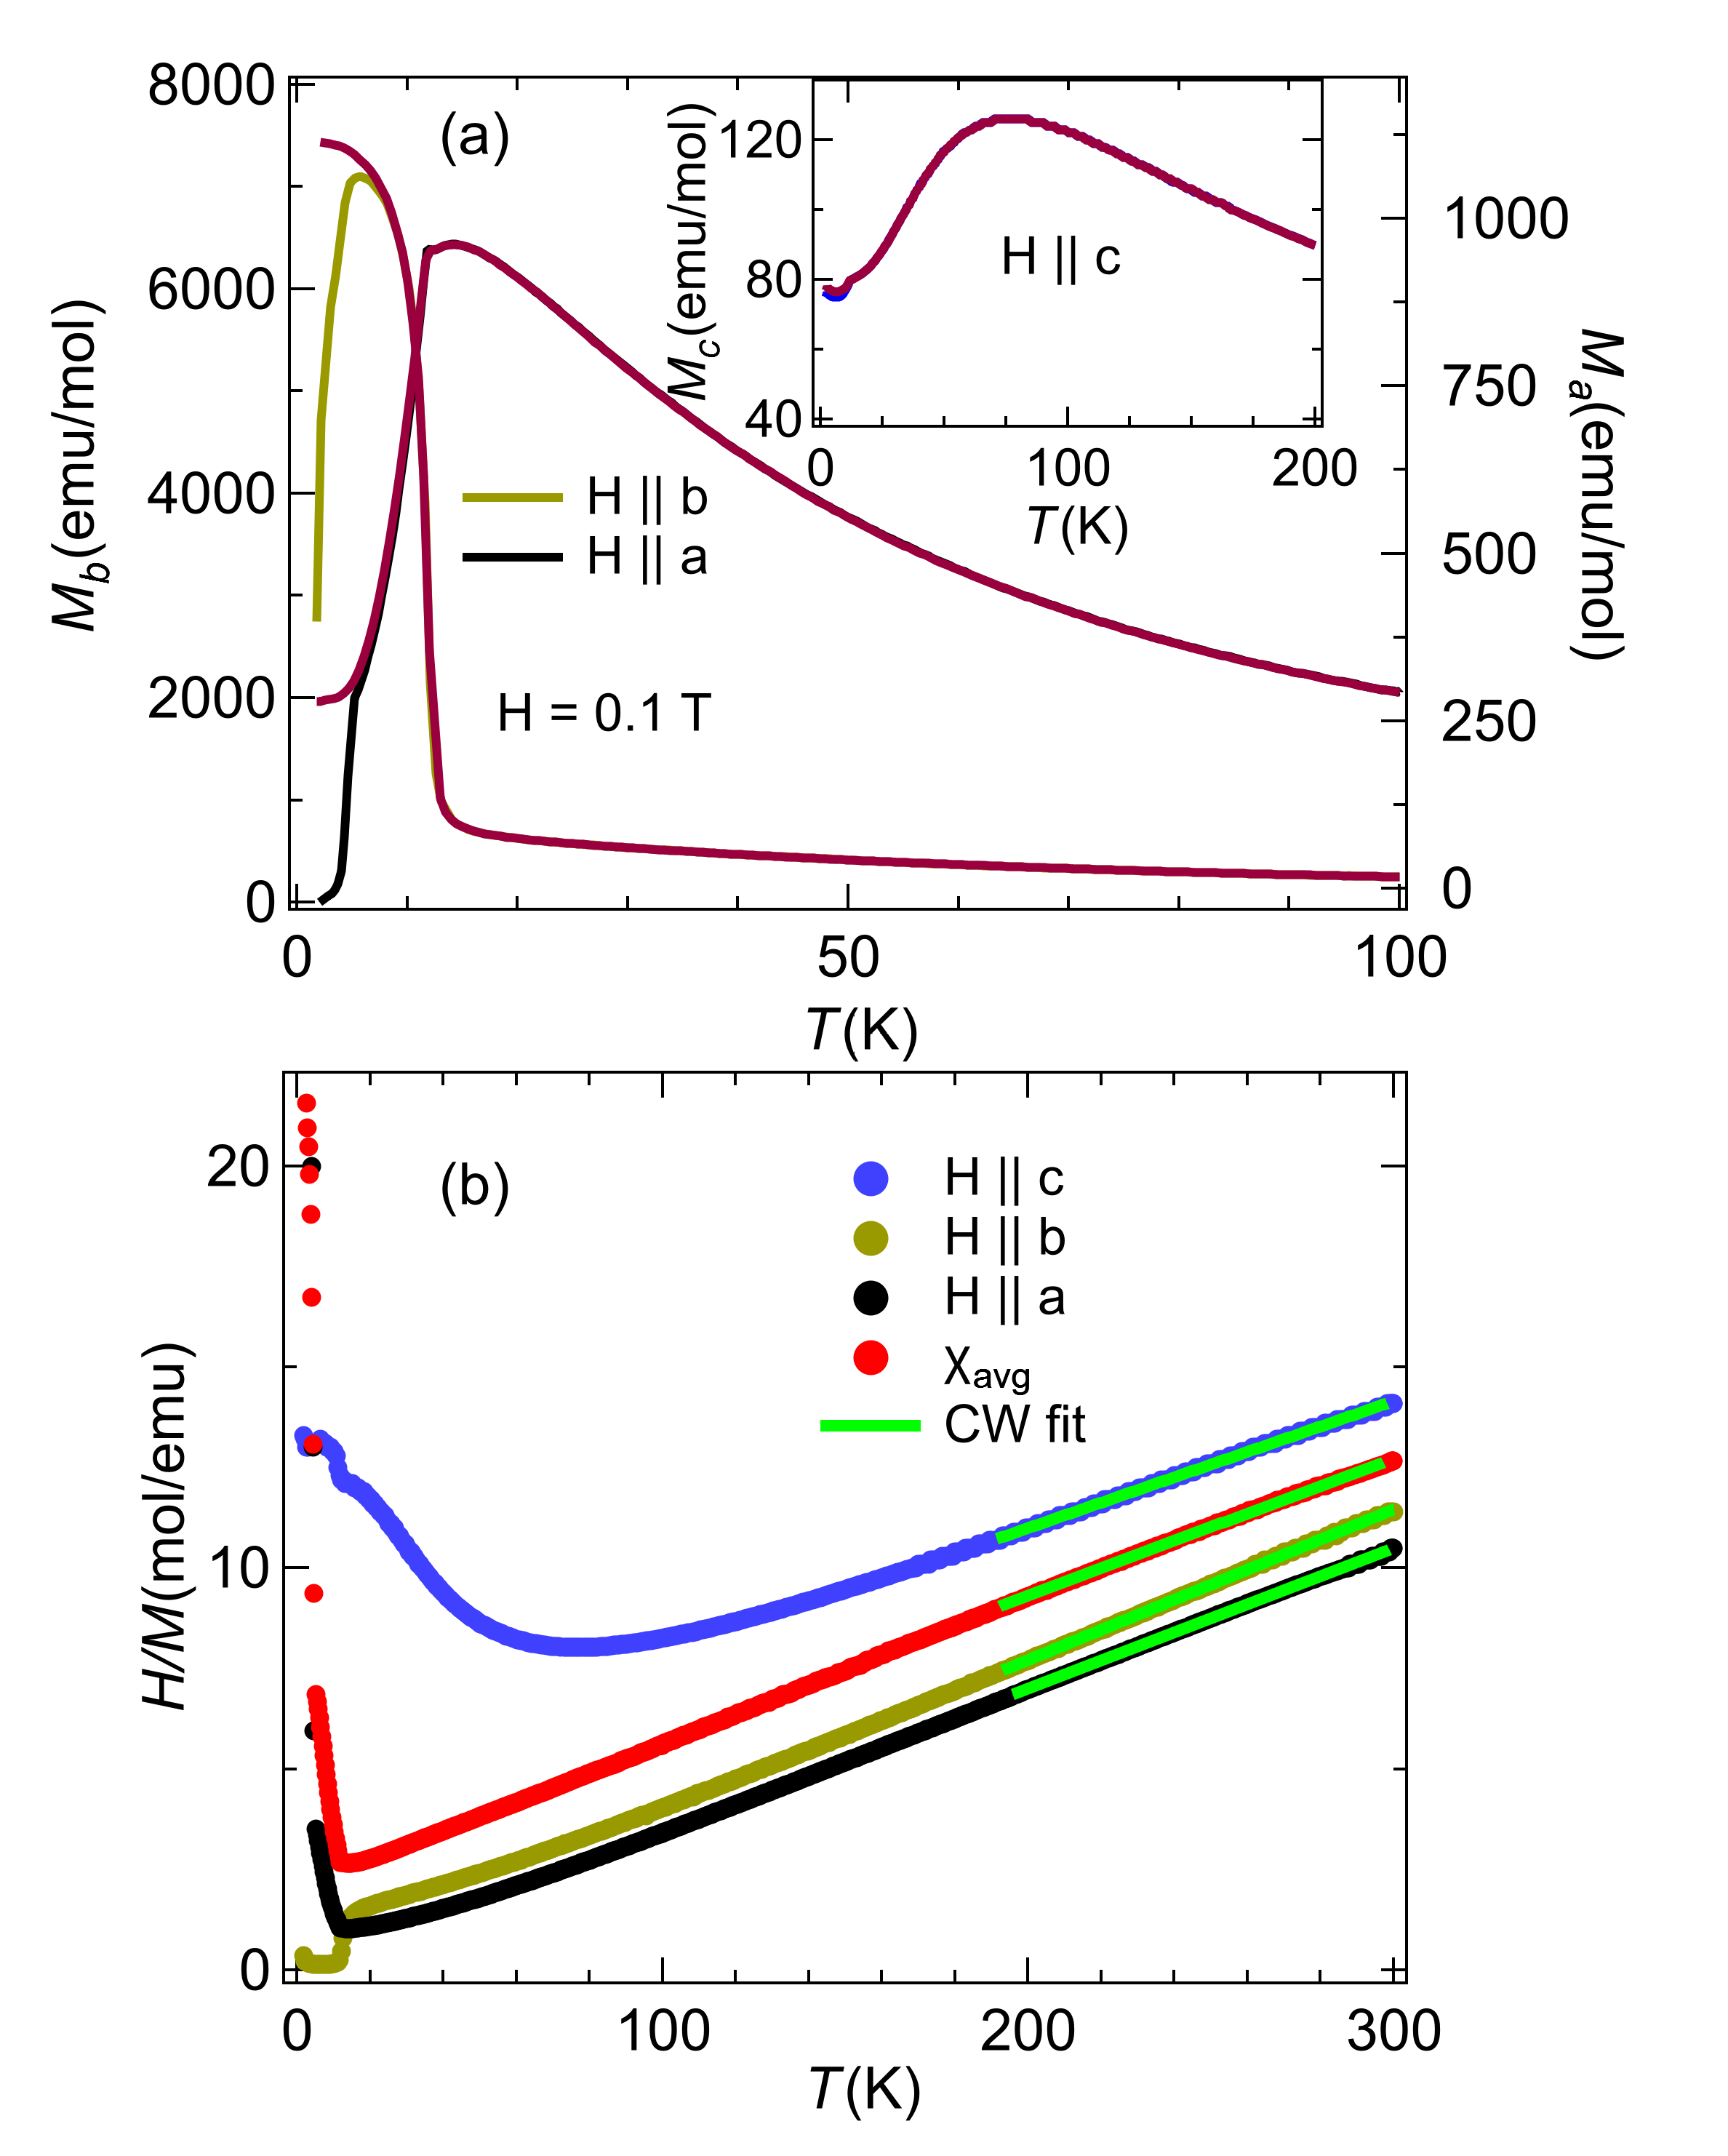
The temperature-and magnetic-field dependent magnetization measurements, M(T,H), are shown in Figs. 2 & 3, respectively. Magnetism in Tb2Ir3Ga9 is highly anisotropic, as is evident from the DC magnetic susceptibility shown in Fig. 2a. The susceptibility along the -axis shows antiferromagnetic ordering at 12.5 K with ZFC and FC curves showing no irreversibility up to 3 K. In contrast, the susceptibility for field parallel to the -axis shows ferromagnetism with a discontinuity around 13 K. The FC curve shows large irreversibility below the transition.
The susceptibility along the -axis (Inset of Fig. 2a) is characterized by a broad maximum around 65 K followed by two discontinuities at 12.5 K and 2.5 K. The broad maximum is likely attributable to higher-lying CEF states being populated by thermal excitation. While the 12.5 K transition probably marks long-range order, we cannot rule out the possibility that this feature arises from small misalignment of the crystal with respect to the field. Some Ce and Yb based compounds with similar crystal structure show broad peak in temperature ranges 150-250 K, and those are well understood by mixed valence states along with CEF effects (Buschinger et al., 1998; Moreno et al., 2005; Trovarelli et al., 1999). The weak feature at 2.5 K is currently not understood. The ZFC and FC data only show irreversibility at the onset of the transition. For , susceptibility along is largest followed by and , while for , the order is .
Figure 2b shows inverse susceptibility along all three axes and the average susceptibility, , with a fit to the Curie-Weiss form, = , shown as a solid line. The Weiss temperature, , and effective moment, , estimated from the Curie constant,C, provide insights on the interactions between magnetic atoms. Different values of Weiss temperature reflect the strong anisotropy in magnetization and are similar to other compounds of the R2T3X9 family (Gorbunov et al., 2018). The value of is largest for the field along with a value of -1482 K followed by -5.80.3 K along and -0.50.1 K along axis. In all three directions, , indicating antiferromagnetic interactions of varying strengths. The average effective moment estimated from the fit to , is 10.3 /Tb, close to that expected effective moment for a free Tb3+ ion 9.7 , while the average Weiss temperature is -70 K.
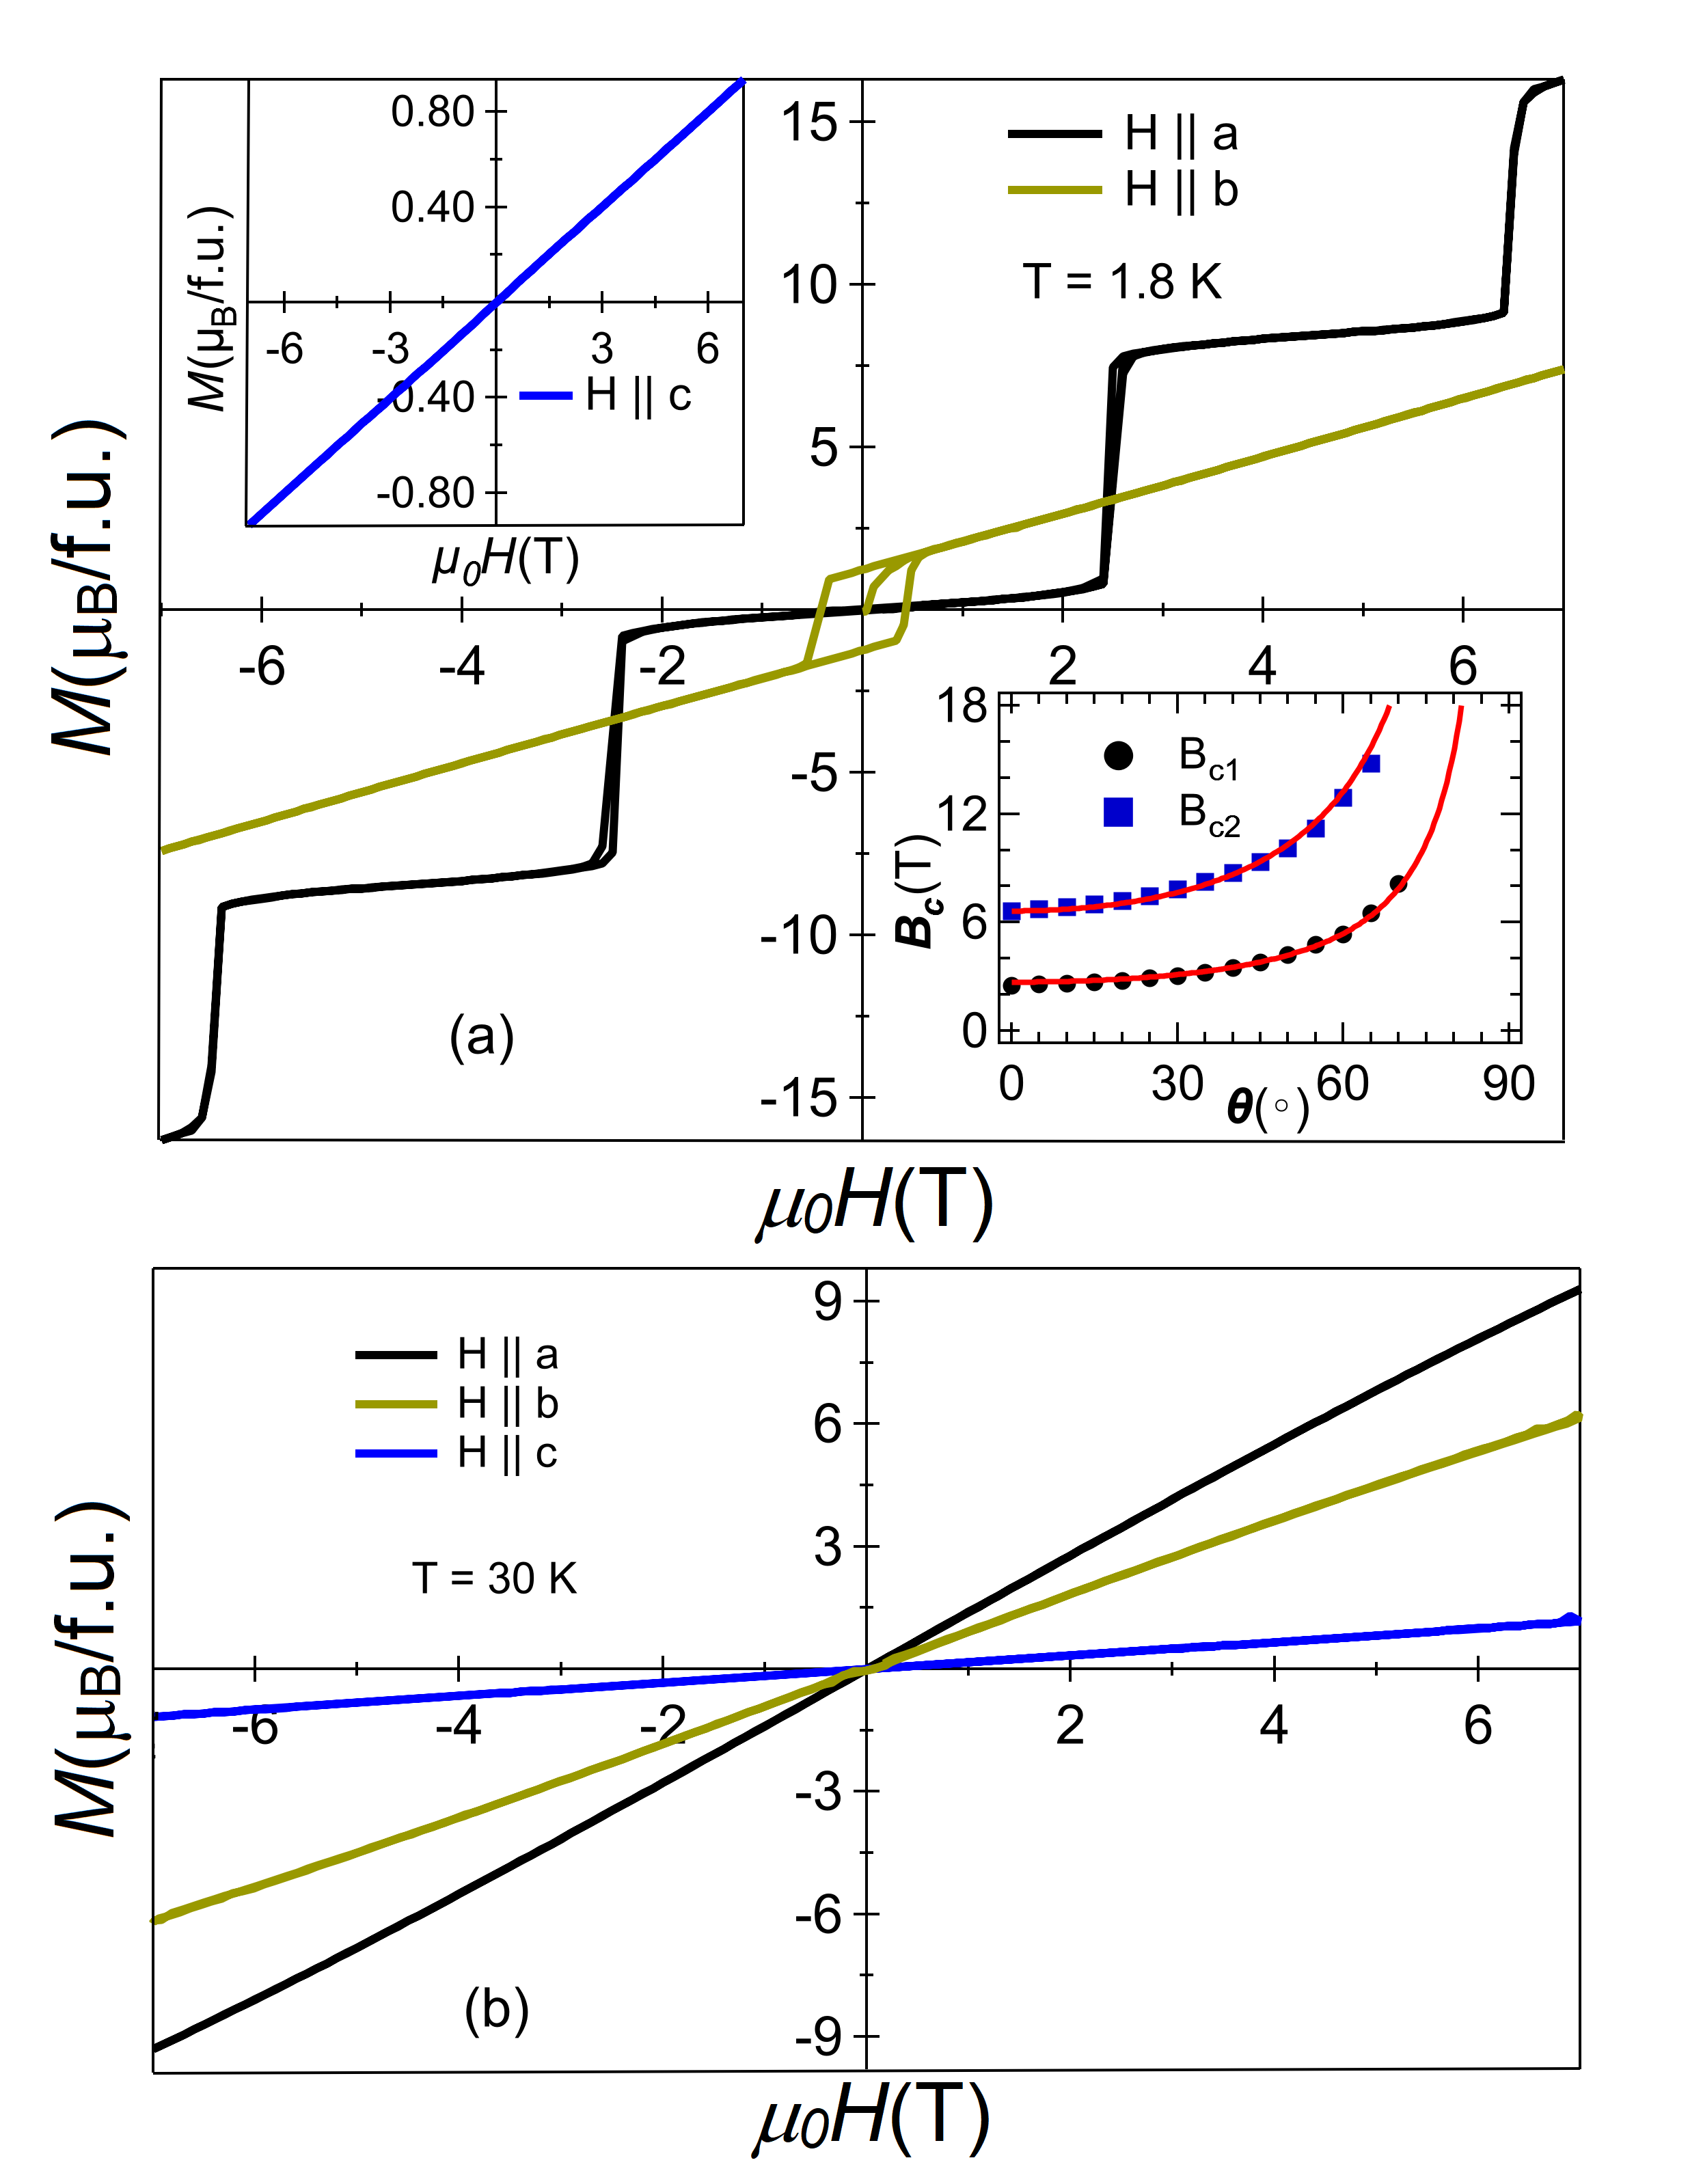
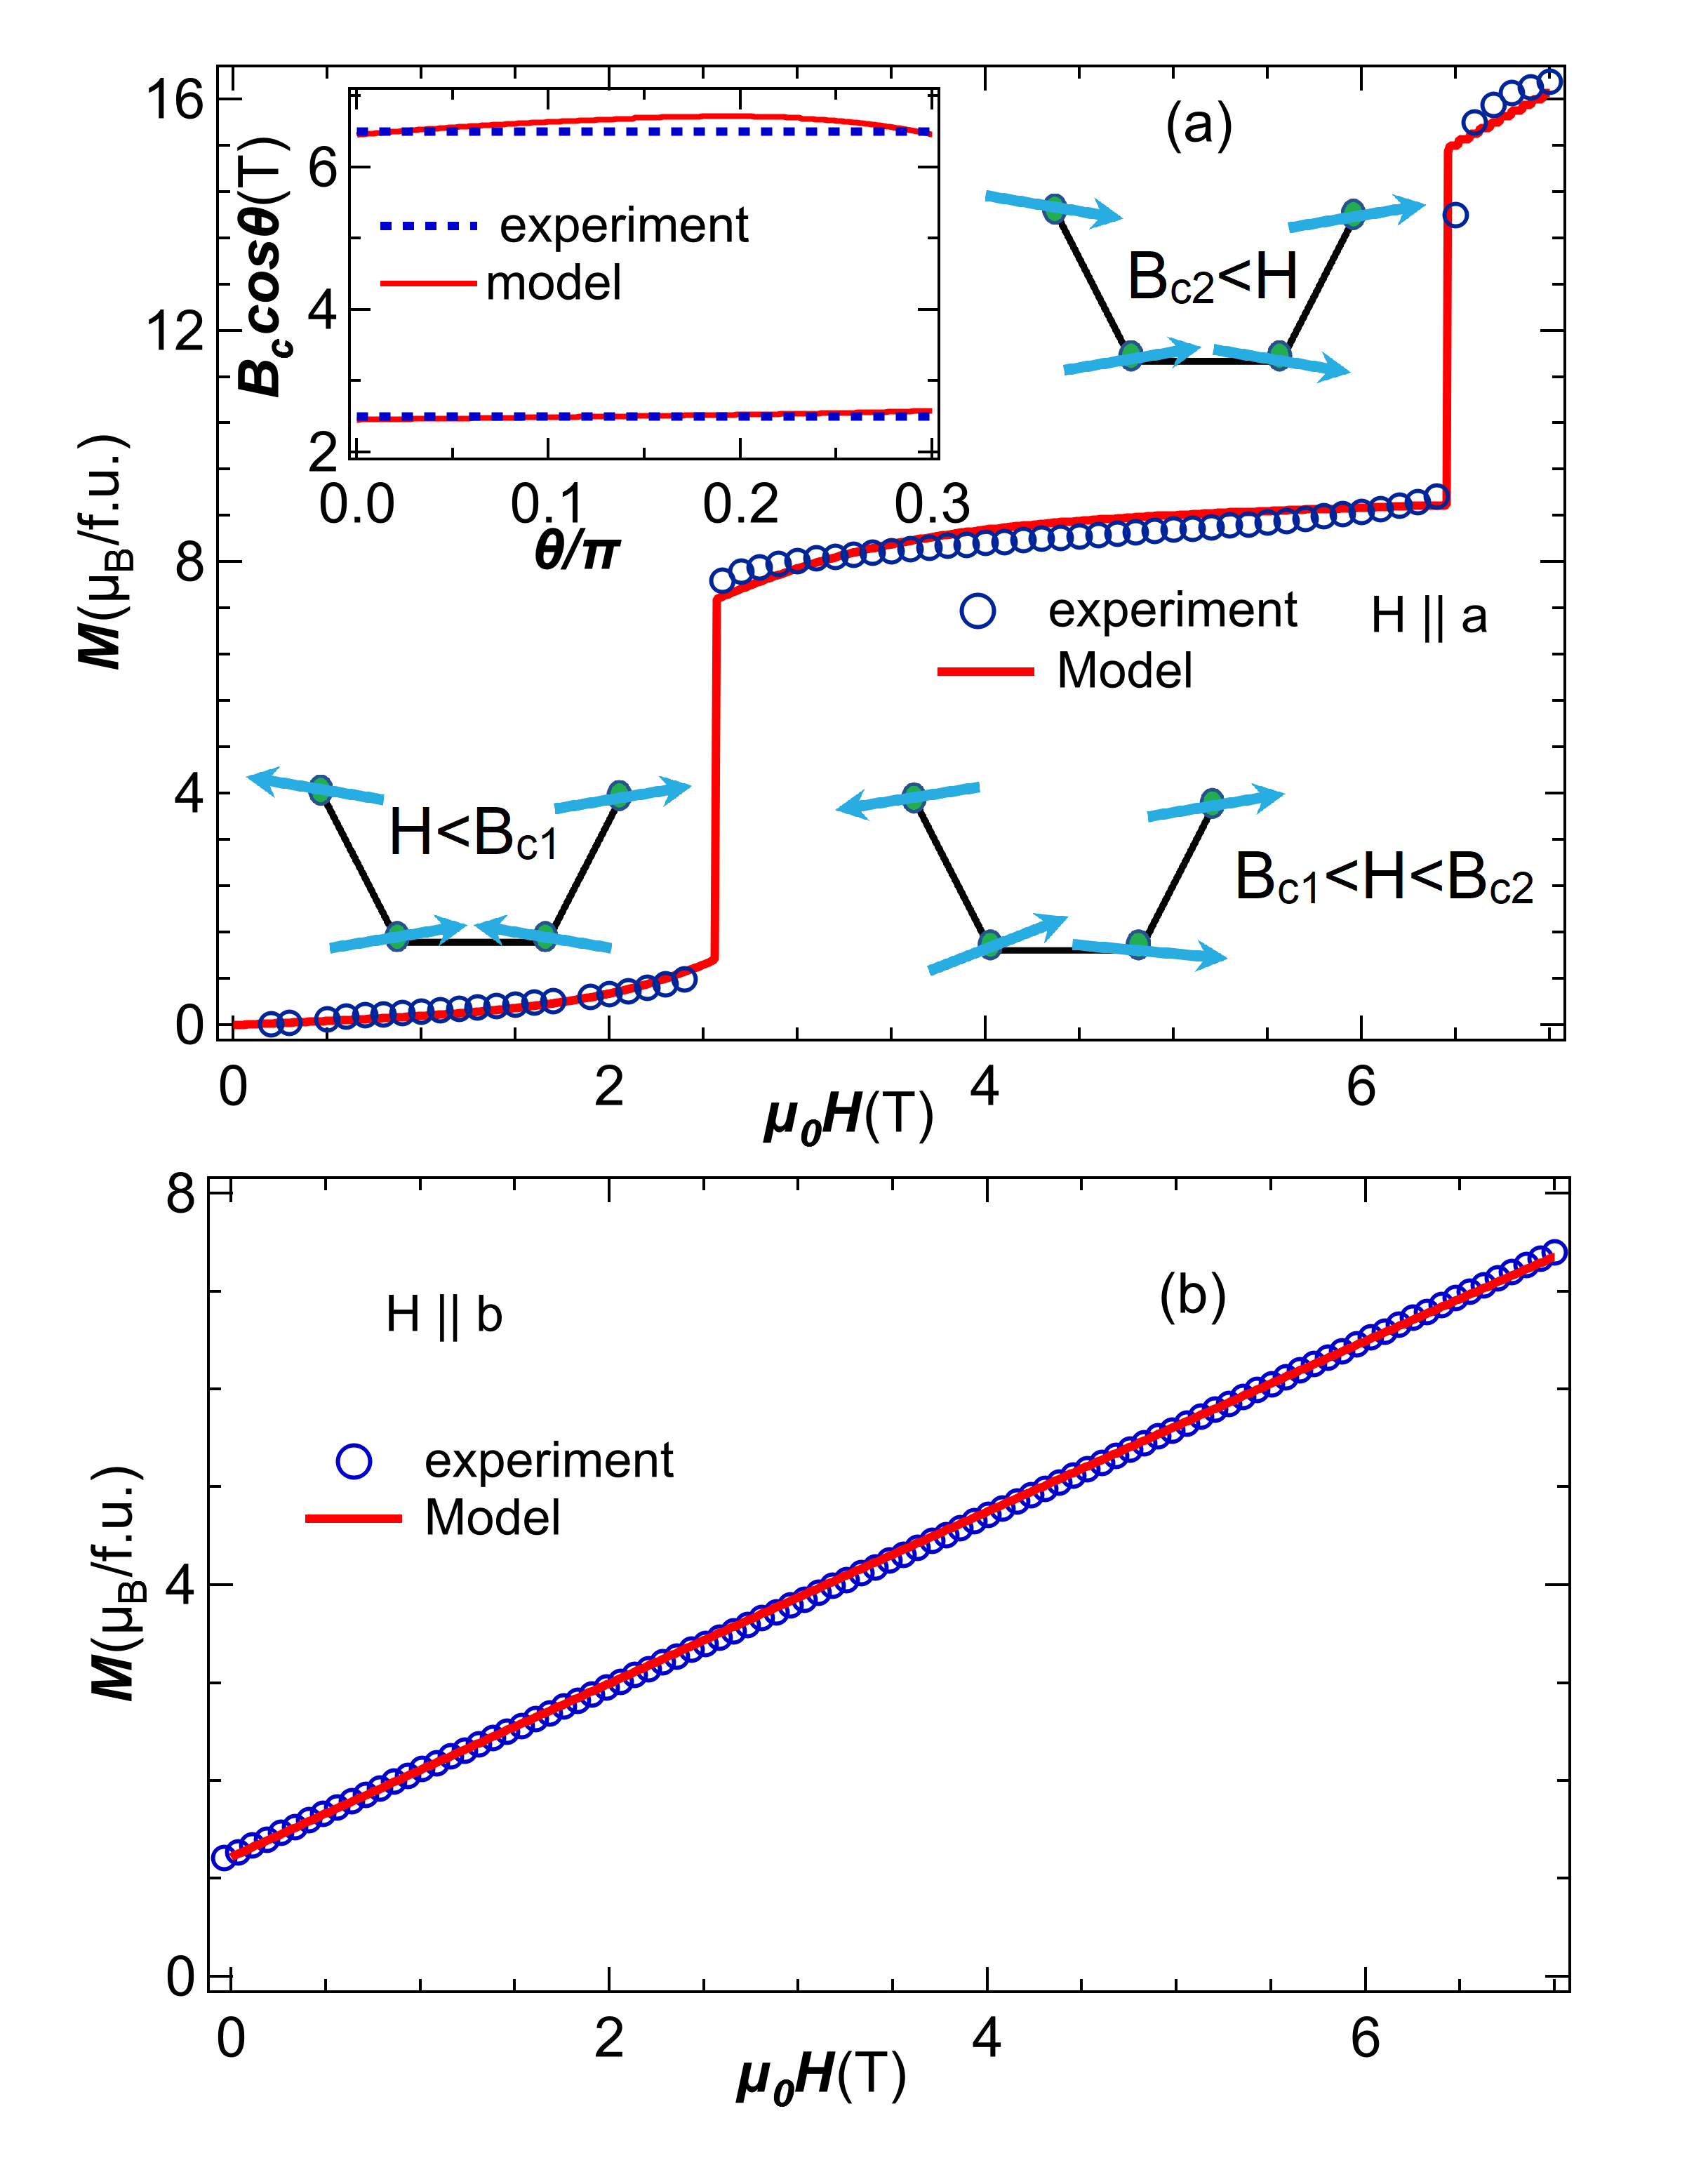
The anisotropic magnetism in Tb2Ir3Ga9 is also evident in M(H) data, shown in Fig. 3a for 1.8 K, and in Fig. 3b for 30 K. When the field is applied along the -axis, two field-induced sharp metamagnetic transitions are seen at fields and , with each transition corresponding to a jump of Ms/2 8 , where Ms is the saturated magnetic moment at 1.8 K and 7 T. We note that the expected Ms for a free Tb3+ ion, 7F6, with is 9 /Tb, thus the jumps are very close to half of that expected for local Tb3+ moment. At 7 T and 1.8 K, the =16.3 /formula unit (f.u.). The angle dependence of the metamagnetic critical field, , shown in the right side inset of Fig. 3(a), implies that only the -axis projection of field is important. Both transitions move to higher fields with increasing angle. Beyond 75 degrees, the transitions have moved beyond the accessible field range. The solid lines are the fit to the form /cos, demonstrating that both metamagnetic transitions depend only on the component of the field along the -axis.
Steplike metamagnetic transitions have been found in certain phase-separated perovskite manganites (Mahendiran et al., 2002; Maignan et al., 2002), and intermetallic compounds such as Nd5Ge3(Tsutaoka et al., 2010; Maji et al., 2010), Gd5Ge4 (Velez et al., 2010) doped CeFe2 (Haldar et al., 2008), and LaFe12B6 (Diop et al., 2016). In these compounds transitions are driven by field-induced response of the phase-separated state, where the applied field favors the ferromagnetic phase over the AFM phase. The metamagnetic transition in these inhomogeneous systems is first-order and is accompanied by a large hysteresis with remanance. In contrast, Tb2Ir3Ga9 is a homogeneous AFM system similar to TbNi2Ge2 (Bud’ko et al., 1999), TbCo2Si2,(Iwata et al., 1990; Gignoux and Schmitt, 1995), TbCoGa5 (Hudis et al., 2006), TbCo2Ge2 (Vinokurova et al., 1992), for example. The magnetic behavior follows from the expected Ising character of Tb3+ found in the low site symmetry, (Cuartero et al., 2015; Gruber et al., 2008). Tb3+ is a non-Kramers’ ion, and the ground state manifold is split into 2 + 1 = 13 singlets by CEF in this symmetry. The lowest crystal-field level is expected to be a quasidoublet that dictates the low temperature properties of the host compound, including a magnetic moment of 9 (Cuartero et al., 2015; Gruber et al., 2008; Zvezdin and Kotov, ) and the Ising behavior. The observed metamagnetic transitions of Tb2Ir3Ga9 are consistent with this scenario with the Ising axis being the crystallographic -axis.
While the M(H) along axis is typical of an antiferromagnet, the axis magnetization reveals a small hysteresis loop with coercivity of 0.5 T indicating ferromagnetism in accordance with M(T) data and a breakdown of the purely Ising approximation. We show in section IV below that a Dzyaloshinskii- Moriya (DM) type interaction between Tb3+ gives rise to this FM component. The Ms at 7 T and 1.8 K along -axis is 7.5 /f.u., and the remanant moment is 1.2 /f.u.
The temperature dependent resistivity, , with current applied along three different crystallographic axes is shown in Fig. 4a. The resistivity is metallic, anisotropic and shows a discontinuity at the magnetic transition. Transport anisotropy, 2.5 at 290K. The residual resistivity ratio, , is about 6 for all axes.
Heat Capacity
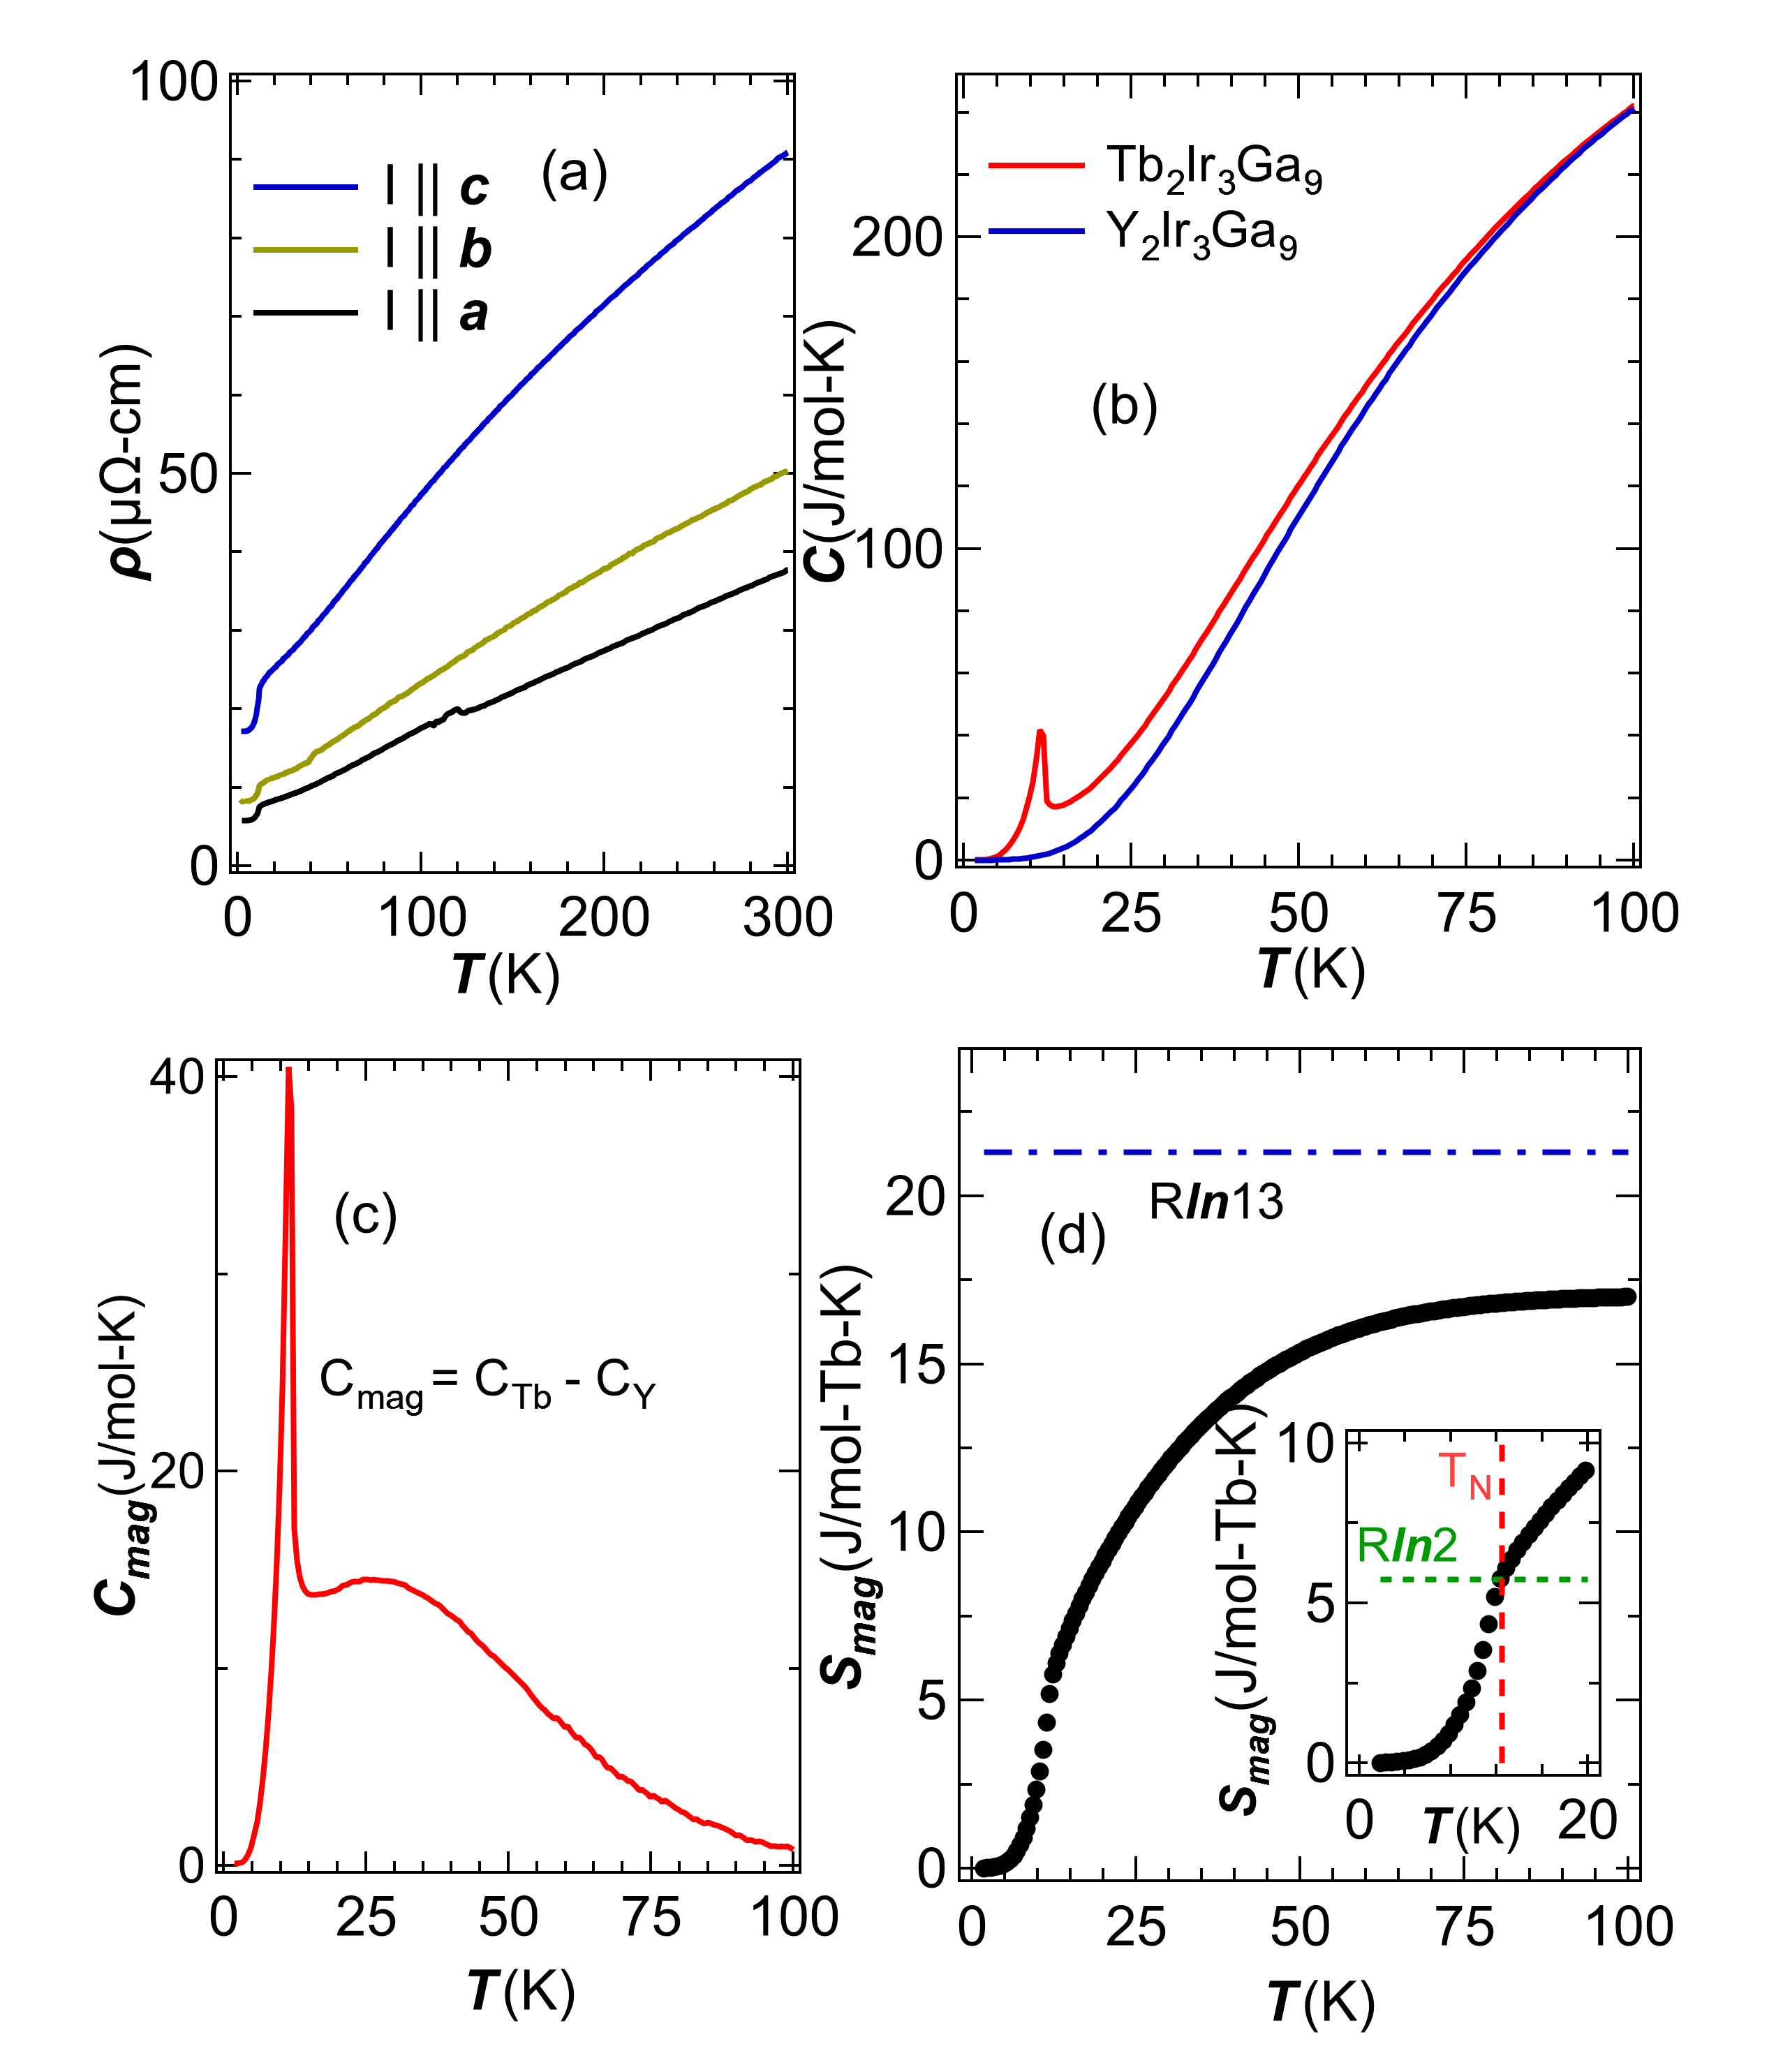
The temperature dependence of the heat capacity, Cp, of Tb2Ir3Ga9 is shown in Fig. 4b. The -like anomaly in the heat capacity at 12.5 K denotes the bulk, long-range magnetic ordering in Tb2Ir3Ga9. To investigate the magnetic contribution to the overall heat capacity, a non-magnetic, isostructural compound Y2Ir3Ga9 was synthesized in single-crystal form following a similar procedure to that described above for Tb2Ir3Ga9. The heat capacity of Y2Ir3Ga9 does not show any magnetic ordering and hence can be taken as a basis for the lattice component of the heat capacity of Tb2Ir3Ga9. The -axis of the Y2Ir3Ga9 specific heat data was scaled following a method developed by Bouvier et al (Bouvier et al., 1991) and later followed by others (O’Flynn et al., 2014) (note: is 276 K from the single fit). Here the correction factor is calculated via Eq. 1
| (1) |
where Mx ( = Y, Ga, Ir, Tb) is the atomic mass of each of the constituent atoms. In this way, a correction factor of 0.940 was calculated. The resulting data (Fig. 4(b)) was then used to calculate the magnetic contribution to heat capacity, , for Tb2Ir3Ga9, where , which is shown in Fig. 4c. Here, in addition to the -like transition, a broad feature is also evident. The magnetic contribution to the entropy is estimated by integrating, . The resulting entropy is shown in Fig. 4d. The maximum entropy we find is 17 J mol-1Tb-1K-1, significantly smaller than the Rln13 = 21.3 J mol-1Tb-1K-1 expected for the 7F6 ground state.
At the onset of antiferromagnetic order, we find (Inset of Fig. 4d). This can be understood via the splitting of the 7F6 states of the Tb3+ free ion by CEF into a ground state quasidoublet separated by a large (12 K) gap from the first excited state. While the CEF energy spectrum for Tb2Ir3Ga9 is not known, Tb compounds with similar site symmetry for the Tb3+ ion, for example in TbAlO3, place the ground state quasidoublet about 160 meV below the first excited state (Gruber et al., 2008). Similar behavior has been reported in TbNi2Ge2 (Wiener et al., 2000), where the Ising axis is the tetragonal -axis. Here, a broad “Schottky”-like feature was found in the magnetic heat capacity and attributed to thermal population of one or more CEF levels above the quasidoublet. A similar explanation likely applies to Tb2Ir3Ga9 . However, attempts to model the data above to a Schottky form for a two-level system (Joshi et al., 2009) lead to poor quality fits, probably reflecting the presence of groups of levels not adequately captured by a simple two-level expression. A better understanding of the CEF levels in Tb2Ir3Ga9 will be needed to model these data properly. The missing entropy in Tb2Ir3Ga9 , TbNi2Ge2 and other Tb3+ containing systems (O’Flynn et al., 2014; Germano and Butera, 1981; Kumar et al., 2008) likely signals the existence of additional CEF levels at energies higher than that probed here.
Neutron Powder Diffraction

The neutron powder diffraction pattern at 300 K, shown in Fig. 5(a), evidences no secondary phases in the Tb2Ir3Ga9 sample. Rietveld analysis confirms the orthorhombic structure with space group Cmcm (No. 63) with the refinement goodness of 3.5, as illustrated in the Fig. 5(a). Upon cooling to 10 K (), the intensities of more than 10 low- peaks (Fig. 5(b)) increase significantly, indicative
of a magnetic contribution to the scattering. All magnetic reflections can be indexed on the
nuclear (chemical) unit cell with a magnetic propagation vector
k = (0,0,0). The SARAH representational analysis program (Wills, 2000)
was used to derive the symmetry-allowed magnetic structures. The symmetry allowed basis vectors for Tb sites are summarized in Table S1 of the SM (sup, ).
The neutron diffraction pattern is best fit using the 5, irreducible representations i.e., antiferromagnetic order with moment strictly along axis with the refinement goodness of 7.29. Allowing a spin canting toward the axis does not improve the refinement. The ordered moment of Tb is found to be /Tb. Both results are
consistent with the magnetization measurements. The magnetic structure
is displayed in Fig. 5. It is worthwhile pointing out that Ir does not carry an ordered moment within the instrumental resolution.
XMCD
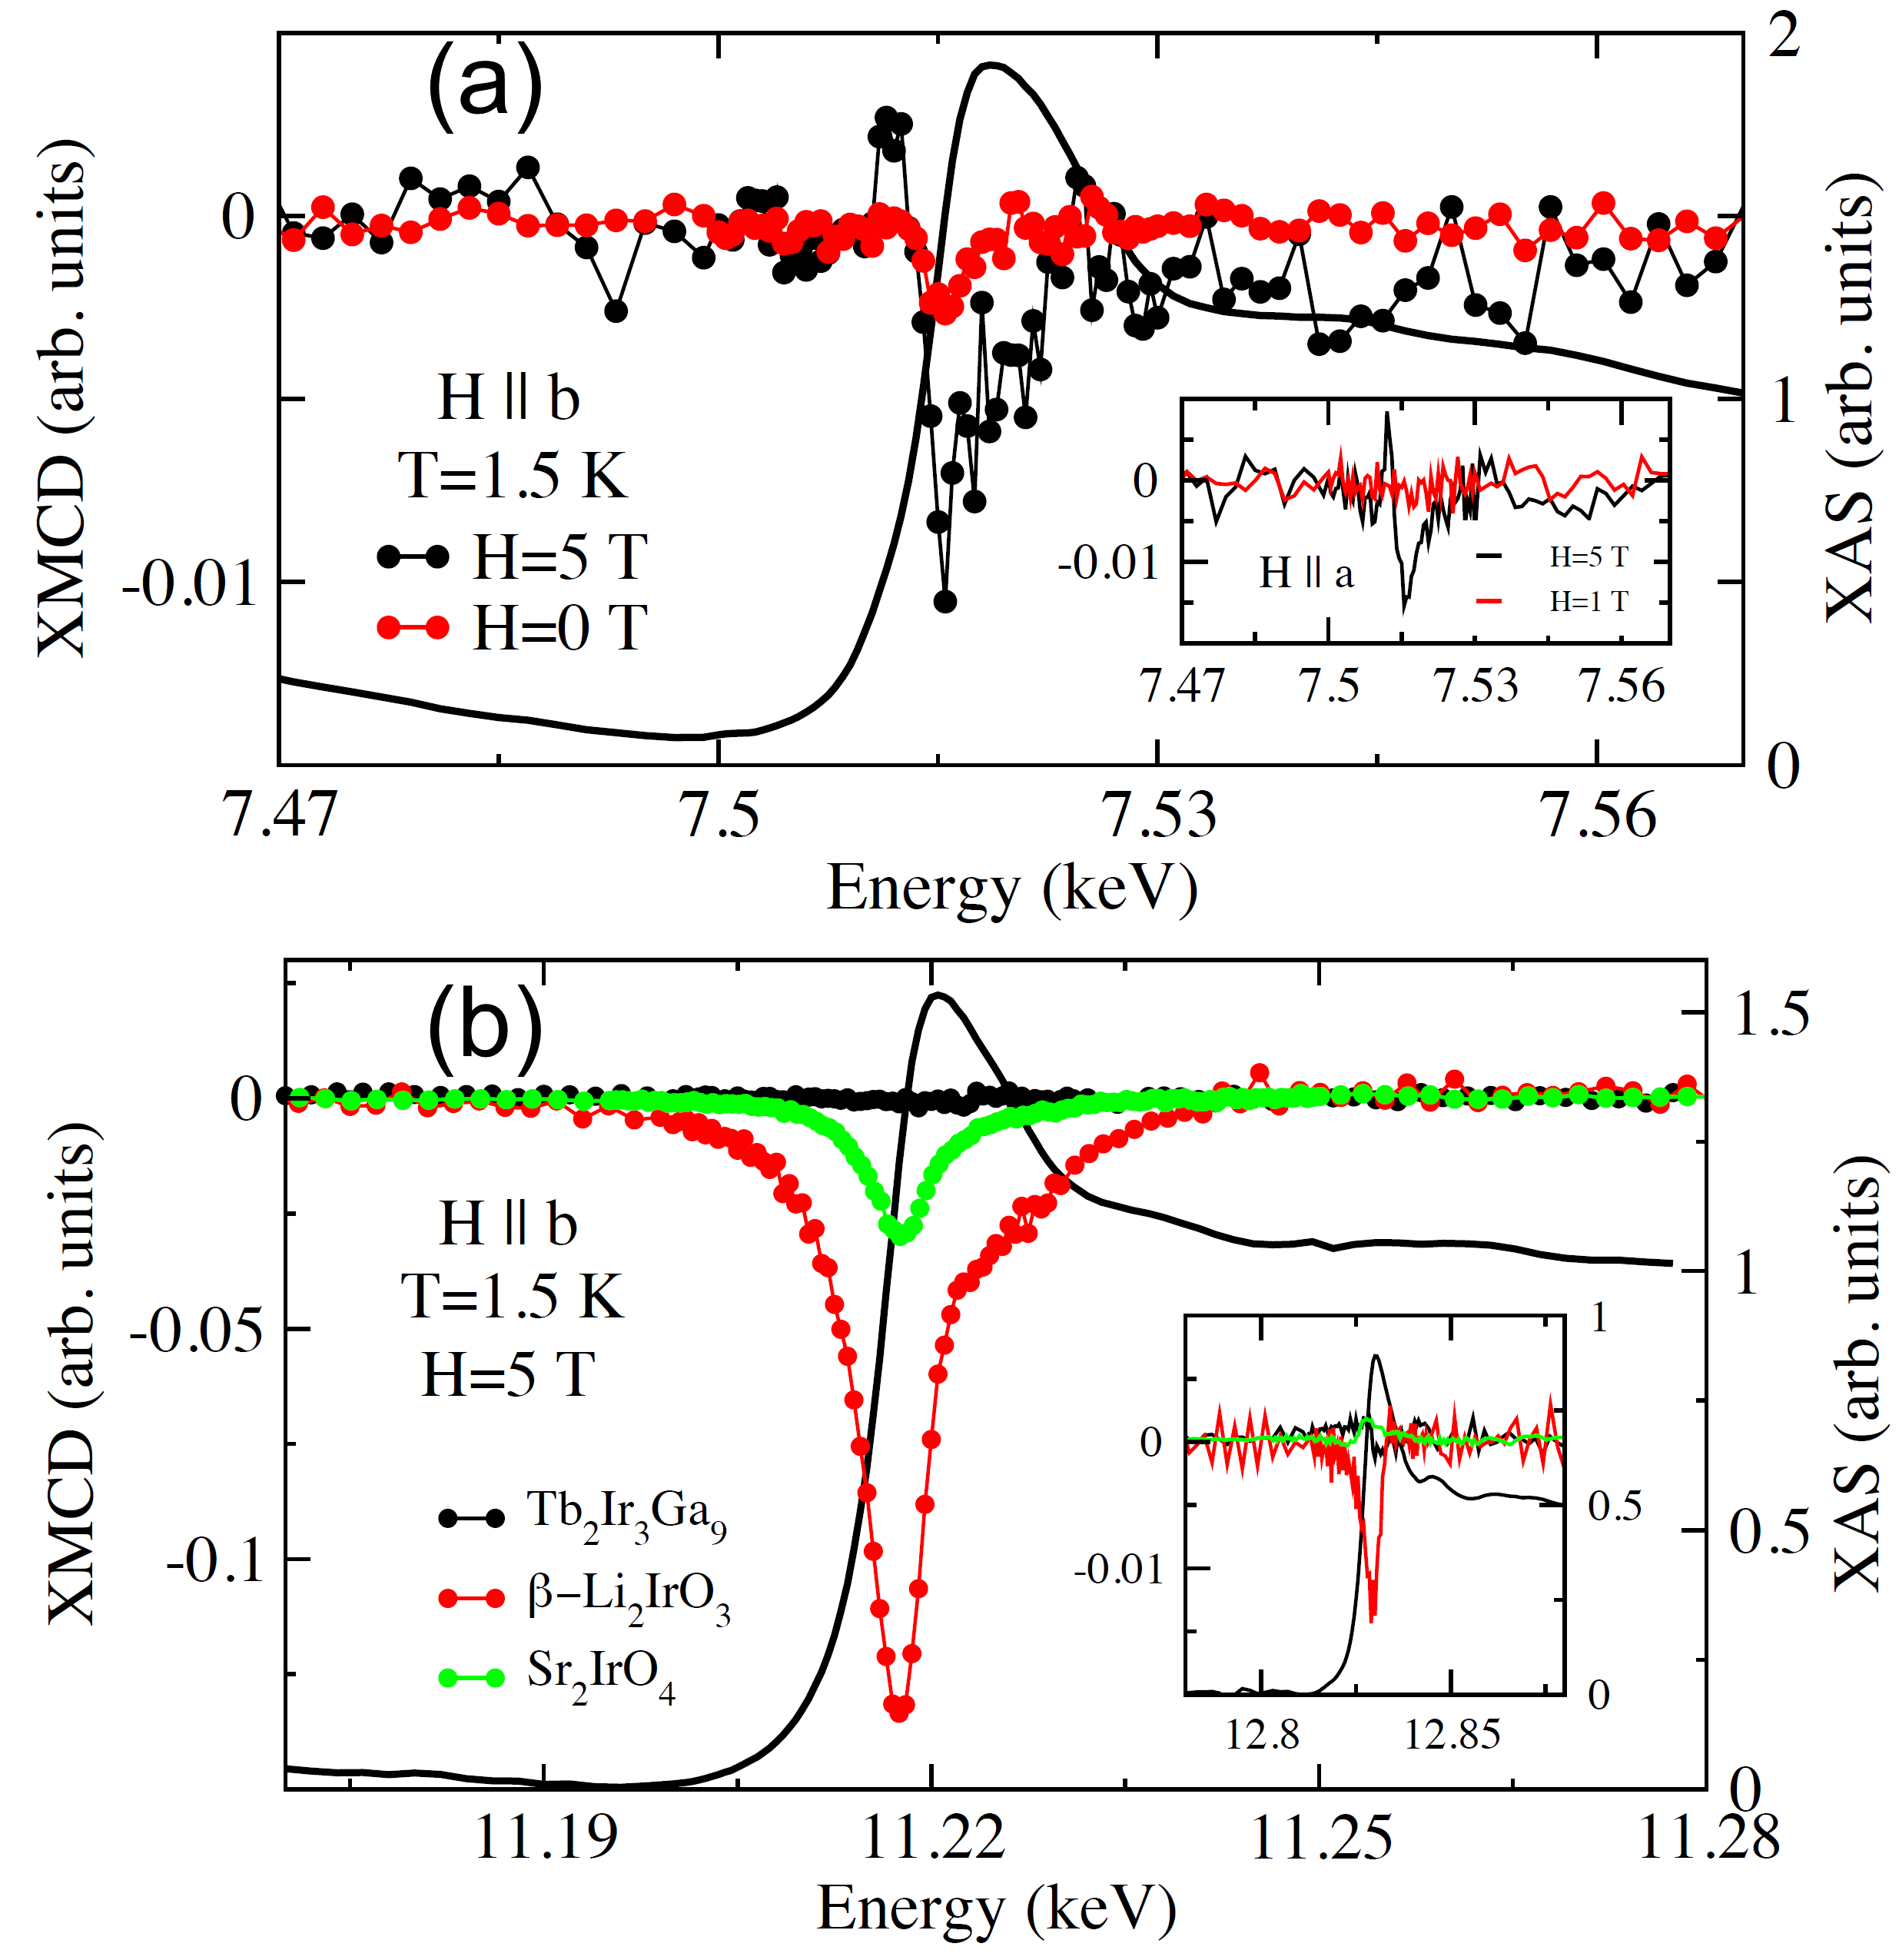
To more definitively explore the potential for Ir magnetism when the field is applied along the -axis, we have performed X-ray magnetic circular dichroism (XMCD) measurements at beamline 4-ID-D of the Advanced Photon Source. Data shown in the Fig. 6 are averages of data sets collected with opposite applied field directions. While the Tb XMCD data at selected applied field values are consistent with the magnetometry data for both crystal orientations, no detectable XMCD signals were found at Ir L-edges. We can put an upper limit 0.01 /Ir to the magnitude of any Ir magnetic moment by scaling to XMCD signals in -Li2IrO3 (Takayama et al., 2015) (0.35 /Ir) and Sr2IrO4 (Haskel et al., 2012) (0.05 /Ir). This indicates that the finite ferromagnetic response along b-axis is solely due to Tb moments either by a field induced canting of Tb spins or by a small but finite DM interaction between the nearest neighbors along the c-direction, or a combination of the two. We will discuss these possibilities further in section IV. The non-magnetic state of Ir is in accordance with our NPD data and the general consensus that the T atom in R2T3X9 is magnetically inactive (Gorbunov et al., 2018).
Electronic structure & Magnetism
Electronic structure calculations have been carried out within density functional theory (DFT) using the all-electron, full potential code WIEN2K (Blaha, 2001) based on the augmented plane wave plus local orbital (APW + lo) basis set (Sjöstedt et al., 2000). The Perdew-Burke-Ernzerhof (PBE) version of the generalized gradient approximation (GGA) (Perdew et al., 1996) was chosen as the exchange correlation potential. Spin-orbit coupling (SOC) was introduced in a second variational procedure (Singh and Nordström, 2006). The LDA+ scheme improves over GGA or LDA in the study of systems containing correlated electrons by introducing the on-site Coulomb repulsion U applied to localized electrons (e.g., ). We have performed calculations within the LDA+ ensatz (using the fully localized version for the double-counting correction) (Czyzyk and Sawatzky, 1994) taking a reasonable value for this -electron system (8 eV) comparable to the values obtained for TbN. A dense K-mesh of 161611, was used for the Brillouin zone sampling. An RmtKmax of 7 was chosen for all calculations. Muffin tin radii were 2.5 a.u. for Ir and Tb, 2.7 a.u. for Ga.
Using the experimental structure, DFT calculations were performed for a FM state, as well as for the collinear Néel AFM state proposed by neutrons (where each of the three types of bonds is AFM), and a collinear striped AFM phase. The AFM state proposed by neutrons is more stable than any other magnetic configuration tested by 16 meV/unit cell (u.c.). Once spin-orbit-coupling (SOC) is introduced, the preferred direction of the magnetization is the -axis with derived magnetocrystalline anisotropy energies MAE[100]-[010]= 0.35 meV/u.c., and MAE[100]-[001] = 0.75 meV/u.c. The obtained spin moment is 5.86 , and the orbital moment 1.34 (increased upon inclusion of a Coulomb to 6.07 and 1.40 , respectively). The total magnetic moment is then 7.2, and 7.5 for GGA and LDA+ calculations, respectively. Both agree with the ordered moment found by NPD and DC magnetization.
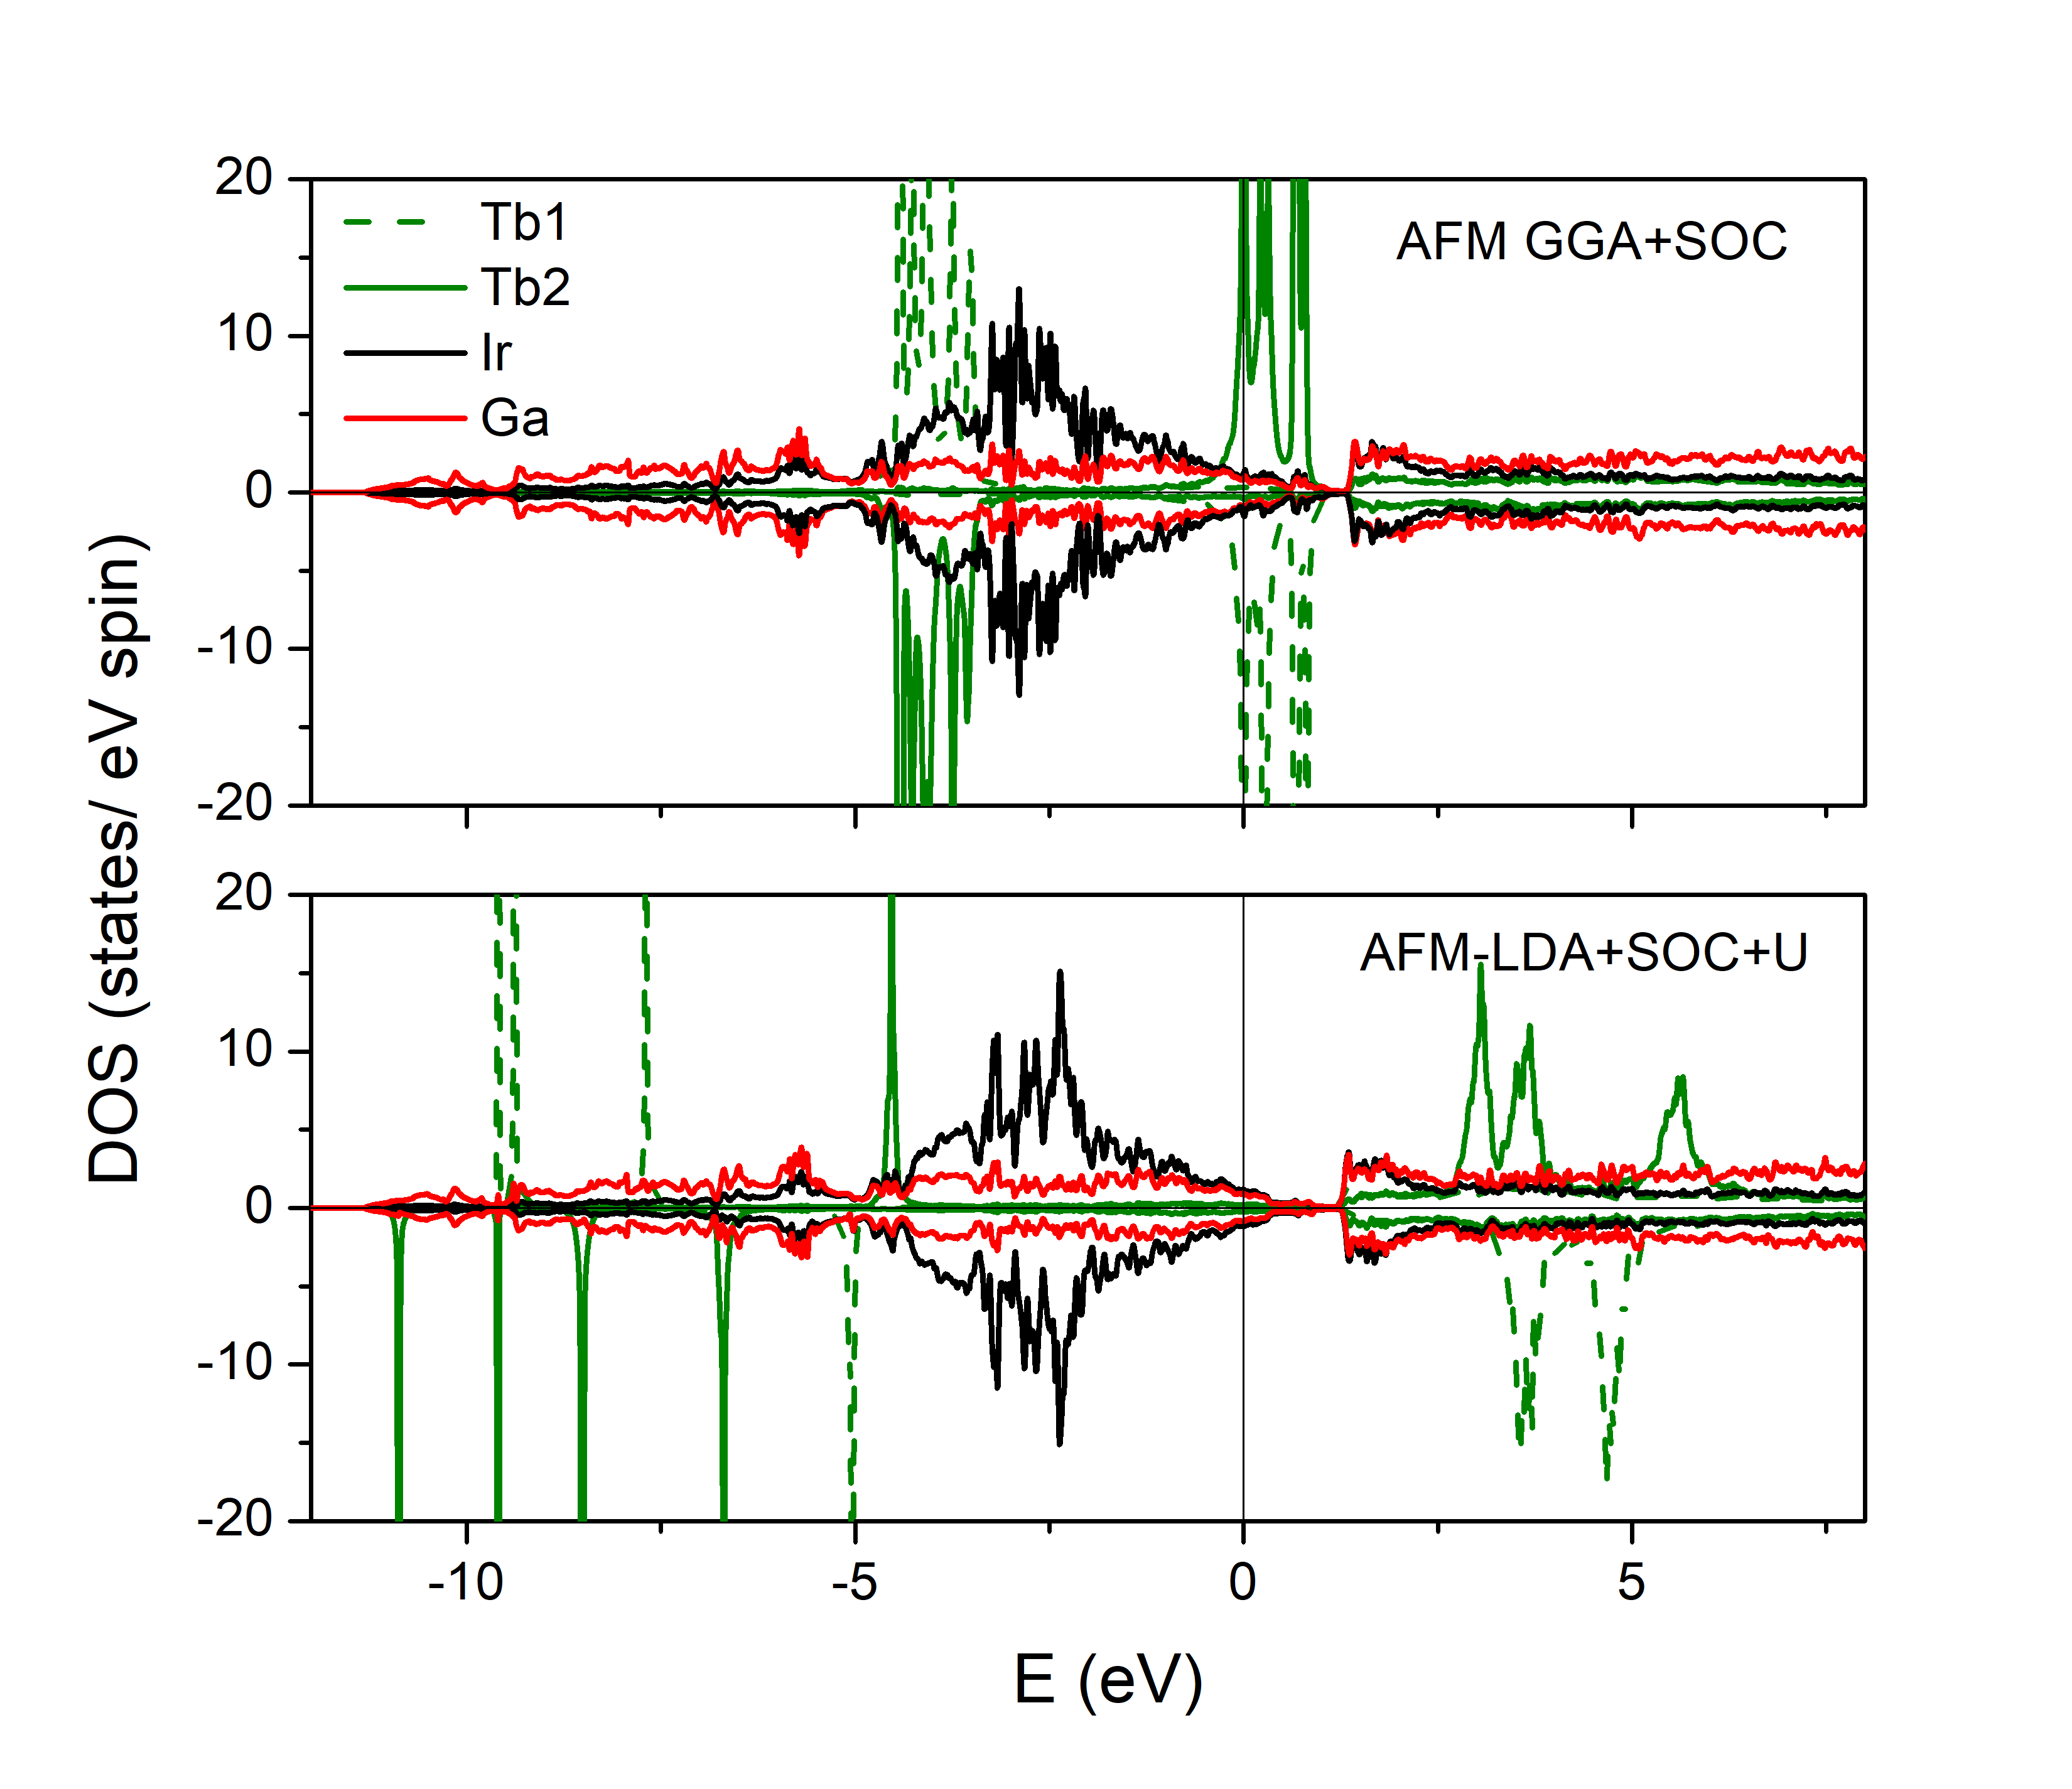
In the GGA calculation, as seen in Fig. 7, the minority spin channel for Tb atoms corresponding to their states, is pinned at the Fermi level (partially filled). Due to the highly localized character of the electrons, it is unlikely that the density of states can have a finite Tb- contribution at the Fermi level. In the LDA+U ground-state, there is no weight at the Fermi level (all the weight is Ir- and Ga-). There are instead different peaks of the -projected density of states well below and well above the Fermi level (shifted by the inclusion of a Coulomb ).
IV Phenomenological Model of magnetism in Tb2Ir3Ga9
A theoretical understanding of the magnetism in Tb2Ir3Ga9 confronts two constraints posed by the measurements discussed above. The first constraint posed is the absence of any phase transition when the field is applied along and -axes, as confirmed by the measurements of the critical fields in applied fields of up to 60 T. Another constraint is provided by the observed scaling of the critical fields when the external magnetic field is rotated by angle away from the axis in the plane. As shown in Fig. 3, measurements find that and are roughly independent of up to . This implies that only the component of the field along controls those phase transitions. Taken together, these two considerations suggest that the Tb moments can be approximately described as Ising spins aligned along . However, a simple Ising model cannot faithfully capture all of the features discussed above, and we now build a phenomenological model in accordance with these considerations. We take the four Tb ions in the unit cell to have “spins”
| (2) |
with , and (,)i are spherical polar coordinates. Elastic neutron measurements indicate that the zero-field state of the Tb ions has with and .
The Hamiltonian is given by
| (3) | |||||
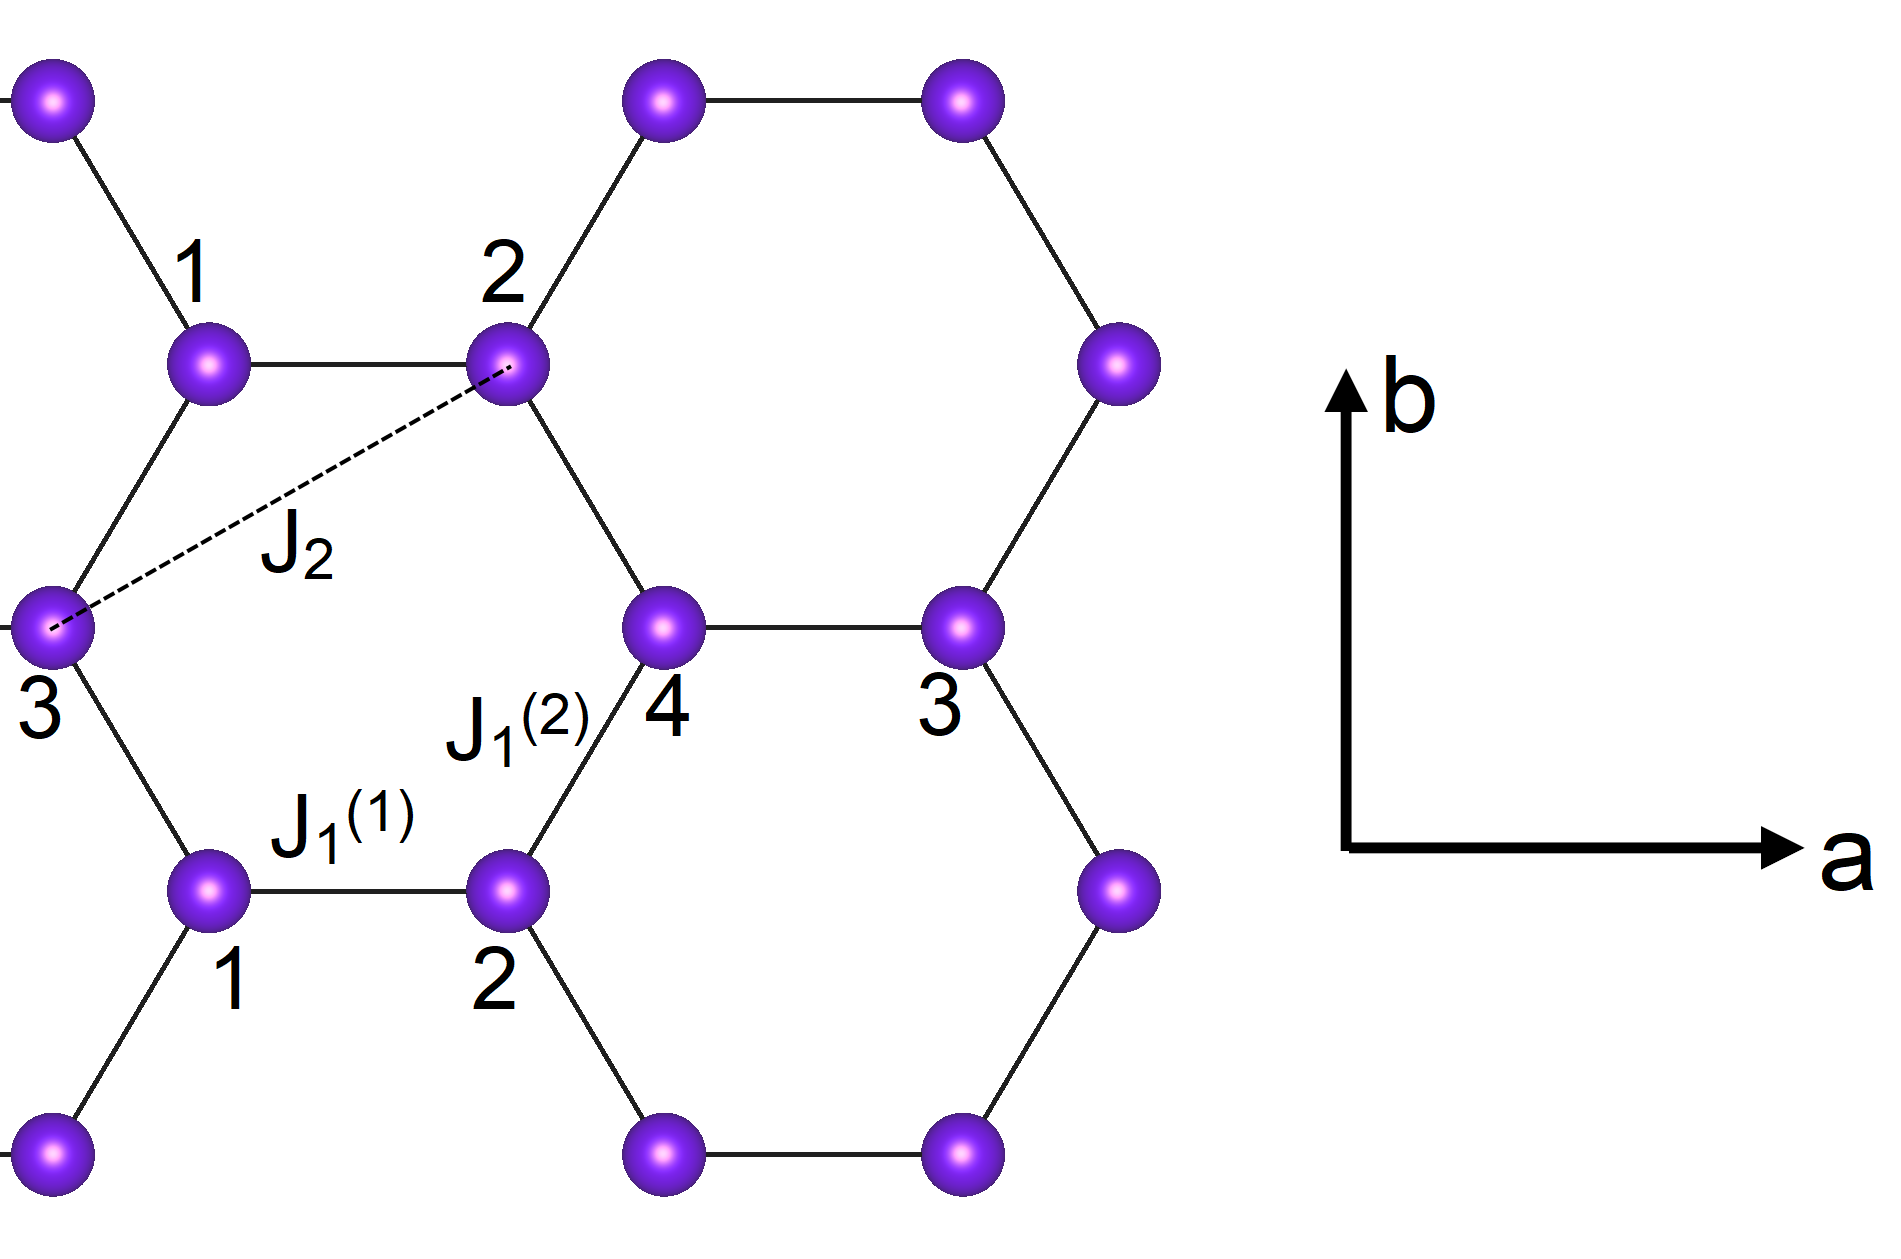
where the field is along the , , or direction and the exchange interactions are indicated in Fig. 8. The factors of avoid double counting.
First neighbors are coupled by both isotropic and directional exchange couplings. The latter couples spins along the direction of the bond so that
| (4) |
is a unit vector from site to site . To account for the orthorhombic distortion of the honeycomb lattice, we further break and into two parts: and acts between sites 1 and 2 or 3 and 4 along the axis while and act between sites 1 and 3 or 2 and 4 at 60∘ from the axis. Second neighbors 1 and 4 or 2 and 3 are coupled by . The easy-axis anisotropy aligns the spins along the axis due to the orthorhombic distortion of the lattice and the easy-plane anisotropy keeps the spins in the plane. The hexagonal anisotropy favors the spins to lie along the three pseudo-hexagonal axis at and . In terms of the spin angles, this energy can be writtten at each site.
The DM interactions along act only between first neighbors (with opposite signs between sites 1 and 2 and between 3 and 1 or 2 and 4) and produces the zero-field canted moment along . This DM interaction is allowed by the alternating positions of the Ir ions around each Tb-Tb bond.
This complex model is required to “tame” the magnetization so that no phase transition occurs when the field is applied along . A simpler model that neglects the directional exchange has a about 16 times greater. The best fits for this model are shown in Fig. 9. Notice that this model describes the experimental measurements in all three phases at 1.8 K. The -axis behavior, not shown, is a good fit to the data shown in Fig. 3b. The fits for the model were constrained by the requirement that ( or 2) are approximately constant as a function of , as measured experimentally. The scaled critical fields from the model are plotted as a function of in the inset of Fig. 9. The scaled fields deviate from their values only above about . We have neglected the presumably weak coupling between planes. While it is not known how the neighboring planes are magnetically configured, if they respond identically to the applied fields, then their exchange coupling will not change with field.
The fitted values of the parameters for the model are given in Table 2. The largest parameter is the easy-plane anisotropy meV, which keeps the Tb spins in the plane. The weak hexagonal anisotropy favors the spins to lie along the three hexagonal axis. Notice that all the exchange parameters are AFM. While the first-neighbor exchange between spins 1 and 2 or 3 and 4 contains both isotropic and directional contributions, the exchange between spins 1 and 3 or 2 and 4 is primarily directional with . The next nearest neighbor interaction 0 stabilizes the intermediate metamagnetic phase. With =0, Bc2 = Bc1 and the intermediate phase would be absent. We note that the extracted parameters are consistent with the observed transition temperature with 0.025 meV and the mean-field transition temperature (/3) (+1) = 1 meV or 11.6 K.
| parameter | value | ||
|---|---|---|---|
| -0.016 | |||
| -0.0004 | |||
| -0.024 | |||
| -0.063 | |||
| -0.0081 | |||
| 0.050 | |||
| -0.88 | |||
| 0.0065 |
V Conclusion
We have synthesized single crystals of the honeycomb lattice antiferromagnet Tb2Ir3Ga9 . The observed magnetism is highly anisotropic with an AFM transition at T12.5 K. Two step-like metamagnetic transitions were found when the magnetic field was applied along the magnetic easy -axis, reflecting the Ising nature of the Tb3+ quasidoublet. Neutron powder diffraction revealed the direction of the magnetic moment along the -axis, in accordance with the magnetization data. A broad peak found for the -axis susceptibility is attributed due to CEF effects, as is a similar broad maximum in the magnetic specific heat above the Néel transition. A phenomenological model was proposed that describes all of the magnetic data well, including the angle-dependence of the metamagnetic transitions. A small but finite DM interaction between nearest neighbors in Tb-Tb planes, which acts along -axis, was found to be essential in describing the observed scaling behavior of the metamagnetic transitions. Notably, the inclusion of a bond directional anisotropy to the magnetic exchange is essential to proper modeling of the data, highlighting that Tb2Ir3Ga9 joins the family of honeycomb magnets with such anisotropic exchange. Beyond this, the Ising behavior of the Tb moments and the honeycomb lattice arrangements of the Tb atoms make this compound a fertile ground to investigate the interplay among various magnetic interactions and crystal field effects. As such, field dependent neutron scattering experiments on single crystals are a logical next step toward understanding this honeycomb lattice system.
Acknowledgements.
This work was sponsored by the U.S. Department of Energy, Office of Science, Basic Energy Sciences, Materials Sciences and Engineering Division. A portion of this research used resources at Spallation Neutron Source, a DOE Office of Science User Facility operated by the Oak Ridge National Laboratory. Work performed at the National High Magnetic Field Laboratory, USA, was supported by NSF Cooperative Agreements DMR-1157490 and DMR-1644779, the State of Florida, U.S. DoE, and through the DoE Basic Energy Science Field Work Project Science in 100 T. Work at the APS was supported by the U.S. Department of Energy, Office of Science, under Contract No. DE-AC02-06CH11357. A.S.B. thanks ASU for startup funds. The authors would like to thank Dr. David Parker, ORNL, for useful discussions.References
- Kitaev (2006) A. Kitaev, Annals of Physics 321, 2 (2006).
- Chaloupka et al. (2010) J. Chaloupka, G. Jackeli, and G. Khaliullin, Phys. Rev. Lett. 105, 027204 (2010).
- Jackeli and Khaliullin (2009) G. Jackeli and G. Khaliullin, Phys. Rev. Lett. 102, 017205 (2009).
- Chun et al. (2015) S. H. Chun, J.-W. Kim, J. Kim, H. Zheng, C. C. Stoumpos, C. Malliakas, J. Mitchell, K. Mehlawat, Y. Singh, Y. Choi, et al., Nature Physics 11, 462 (2015).
- Kim et al. (2015) H.-S. Kim, V. S. V., A. Catuneanu, and H.-Y. Kee, Phys. Rev. B 91, 241110 (2015).
- Singh et al. (2012) Y. Singh, S. Manni, J. Reuther, T. Berlijn, R. Thomale, W. Ku, S. Trebst, and P. Gegenwart, Phys. Rev. Lett. 108, 127203 (2012).
- Xing et al. (2019) J. Xing, H. Cao, E. Emmanouilidou, C. Hu, J. Liu, D. Graf, A. P. Ramirez, G. Chen, and N. Ni, arXiv preprint arXiv:1903.03615 (2019).
- Lou and Chen (2019) Z.-X. Lou and G. Chen, arXiv preprint arXiv:1903.02530 (2019).
- Jang et al. (2019) S.-H. Jang, R. Sano, Y. Kato, and Y. Motome, Phys. Rev. B 99, 241106(R) (2019).
- Clark et al. (2019) L. Clark, G. Sala, D. D. Maharaj, M. B. Stone, K. S. Knight, M. T. Telling, X. Wang, X. Xu, J. Kim, Y. Li, et al., Nature Physics 15, 262 (2019).
- Grin et al. (1984) Y. N. Grin, R. Gladyshevsky, O. Sichevich, V. Zavodnik, Y. P. Yarmolyuk, and I. Rozhdestvenskaya, Kristallografiya 29, 893 (1984).
- Sichevych et al. (2006) O. Sichevych, W. Schnelle, Y. Prots, U. Burkhardt, and Y. Grin, Zeitschrift für Naturforschung B 61, 904 (2006).
- Gorbunov et al. (2018) D. I. Gorbunov, M. S. Henriques, N. Qureshi, B. Ouladdiaf, C. S. Mejía, J. Gronemann, A. V. Andreev, V. Petříček, E. L. Green, and J. Wosnitza, Phys. Rev. Materials 2, 084406 (2018).
- Gordon et al. (1996) R. A. Gordon, F. J. DiSalvo, R. Pöttgen, and N. E. Brese, Journal of the Chemical Society, Faraday Transactions 92, 2167 (1996).
- Dhar et al. (1999) S. Dhar, C. Mitra, P. Manfrinetti, A. Palenzona, and P. Bonville, Physica B: Condensed Matter 259, 150 (1999).
- Trovarelli et al. (1999) O. Trovarelli, C. Geibel, B. Buschinger, R. Borth, S. Mederle, M. Grosche, G. Sparn, F. Steglich, O. Brosch, and L. Donnevert, Phys. Rev. B 60, 1136 (1999).
- Routsi and Yakinthos (2001) C. Routsi and J. Yakinthos, Journal of alloys and compounds 323, 427 (2001).
- Okane et al. (2002) T. Okane, S.-I. Fujimori, A. Ino, A. Fujimori, S. K. Dhar, C. Mitra, P. Manfrinetti, A. Palenzona, and O. Sakai, Phys. Rev. B 65, 125102 (2002).
- Troć et al. (2007) R. Troć, O. Tougait, and H. Noël, Intermetallics 15, 1091 (2007).
- Niermann et al. (2004a) J. Niermann, B. Fehrmann, M. W. Wolff, and W. Jeitschko, Journal of Solid State Chemistry 177, 2600 (2004a).
- Stoe (2005) C. Stoe, Stoe & Cie GmbH, Darmatadt, Germany (2005).
- Sheldrick (2015) G. M. Sheldrick, Acta Crystallographica Section C: Structural Chemistry 71, 3 (2015).
- Grin and Rogl (1989) Y. Grin and P. Rogl, Inorganic Mater.(USSR) 25, 514 (1989).
- Singleton et al. (2004) J. Singleton, C. Mielke, A. Migliori, G. Boebinger, and A. Lacerda, Physica B: Condensed Matter 346, 614 (2004).
- Ghannadzadeh et al. (2011) S. Ghannadzadeh, M. Coak, I. Franke, P. Goddard, J. Singleton, and J. L. Manson, Review of Scientific Instruments 82, 113902 (2011).
- Altarawneh et al. (2009) M. Altarawneh, C. Mielke, and J. Brooks, Review of Scientific Instruments 80, 066104 (2009).
- Rodríguez-Carvajal (1993) J. Rodríguez-Carvajal, Physica B: Condensed Matter 192, 55 (1993).
- Haskel et al. (2007) D. Haskel, Y. Tseng, J. Lang, and S. Sinogeikin, Review of Scientific Instruments 78, 083904 (2007).
- Niermann et al. (2004b) J. Niermann, B. Fehrmann, M. W. Wolff, and W. Jeitschko, Journal of Solid State Chemistry 177, 2600 (2004b).
- (30) See Supplemental Material for (detail results of the symmetry-allowed basis vectors for Tb sites and single crystal XRD which includes atomic coordinates and bond lengths.).
- Buschinger et al. (1998) B. Buschinger, O. Trovarelli, M. Weiden, C. Geibel, and F. Steglich, Journal of alloys and compounds 275, 633 (1998).
- Moreno et al. (2005) N. O. Moreno, A. Lobos, A. A. Aligia, E. D. Bauer, S. Bobev, V. Fritsch, J. L. Sarrao, P. G. Pagliuso, J. D. Thompson, C. D. Batista, and Z. Fisk, Phys. Rev. B 71, 165107 (2005).
- Mahendiran et al. (2002) R. Mahendiran, A. Maignan, S. Hébert, C. Martin, M. Hervieu, B. Raveau, J. F. Mitchell, and P. Schiffer, Phys. Rev. Lett. 89, 286602 (2002).
- Maignan et al. (2002) A. Maignan, S. Hébert, V. Hardy, C. Martin, M. Hervieu, and B. Raveau, Journal of Physics: Condensed Matter 14, 11809 (2002).
- Tsutaoka et al. (2010) T. Tsutaoka, A. Tanaka, Y. Narumi, M. Iwaki, and K. Kindo, Physica B: Condensed Matter 405, 180 (2010).
- Maji et al. (2010) B. Maji, K. Suresh, and A. Nigam, EPL (Europhysics Letters) 91, 37007 (2010).
- Velez et al. (2010) S. Velez, J. M. Hernandez, A. Fernandez, F. Macià, C. Magen, P. A. Algarabel, J. Tejada, and E. M. Chudnovsky, Phys. Rev. B 81, 064437 (2010).
- Haldar et al. (2008) A. Haldar, K. G. Suresh, and A. K. Nigam, Phys. Rev. B 78, 144429 (2008).
- Diop et al. (2016) L. V. B. Diop, O. Isnard, and J. Rodríguez-Carvajal, Phys. Rev. B 93, 014440 (2016).
- Bud’ko et al. (1999) S. Bud’ko, Z. Islam, T. Wiener, I. Fisher, A. Lacerda, and P. Canfield, Journal of magnetism and magnetic materials 205, 53 (1999).
- Iwata et al. (1990) N. Iwata, K. Honda, T. Shigeoka, Y. Hashimoto, and H. Fujii, Journal of Magnetism and Magnetic Materials 90, 63 (1990).
- Gignoux and Schmitt (1995) D. Gignoux and D. Schmitt, Journal of Alloys and Compounds 225, 423 (1995).
- Hudis et al. (2006) J. Hudis, R. Hu, C. Broholm, V. Mitrović, and C. Petrovic, Journal of magnetism and magnetic materials 307, 301 (2006).
- Vinokurova et al. (1992) L. Vinokurova, V. Ivanov, and A. Szytula, Journal of alloys and compounds 190, L23 (1992).
- Cuartero et al. (2015) V. Cuartero, S. Lafuerza, G. Subías, J. García, E. Schierle, J. Blasco, and J. Herrero-Albillos, Phys. Rev. B 91, 165111 (2015).
- Gruber et al. (2008) J. B. Gruber, K. L. Nash, R. M. Yow, D. K. Sardar, U. V. Valiev, A. A. Uzokov, and G. W. Burdick, Journal of Luminescence 128, 1271 (2008).
- (47) K. Zvezdin and V. Kotov, Modern Magneto-Optics and Magneto Optical Materials, studies in condensed matter physics, 1997 (IOP Publishing Bristol and Philadelphia).
- Bouvier et al. (1991) M. Bouvier, P. Lethuillier, and D. Schmitt, Phys. Rev. B 43, 13137 (1991).
- O’Flynn et al. (2014) D. O’Flynn, M. Lees, and G. Balakrishnan, Journal of Physics: Condensed Matter 26, 256002 (2014).
- Wiener et al. (2000) T. A. Wiener, I. R. Fisher, S. L. Bud’ko, A. Kracher, and P. C. Canfield, Phys. Rev. B 62, 15056 (2000).
- Joshi et al. (2009) D. A. Joshi, A. K. Nigam, S. K. Dhar, and A. Thamizhavel, Phys. Rev. B 80, 054414 (2009).
- Germano and Butera (1981) D. J. Germano and R. A. Butera, Phys. Rev. B 24, 3912 (1981).
- Kumar et al. (2008) P. Kumar, K. Suresh, and A. Nigam, Journal of Physics D: Applied Physics 41, 105007 (2008).
- Wills (2000) A. Wills, Physica B: Condensed Matter 276, 680 (2000).
- Takayama et al. (2015) T. Takayama, A. Kato, R. Dinnebier, J. Nuss, H. Kono, L. S. I. Veiga, G. Fabbris, D. Haskel, and H. Takagi, Phys. Rev. Lett. 114, 077202 (2015).
- Haskel et al. (2012) D. Haskel, G. Fabbris, M. Zhernenkov, P. P. Kong, C. Q. Jin, G. Cao, and M. van Veenendaal, Phys. Rev. Lett. 109, 027204 (2012).
- Blaha (2001) P. Blaha, An augmented plane wave+ local orbitals program for calculating crystal properties (2001).
- Sjöstedt et al. (2000) E. Sjöstedt, L. Nordström, and D. Singh, Solid state communications 114, 15 (2000).
- Perdew et al. (1996) J. P. Perdew, K. Burke, and M. Ernzerhof, Phys. Rev. Lett. 77, 3865 (1996).
- Singh and Nordström (2006) D. Singh and L. Nordström, Planewaves Pseudopotentials and the LAPW Method, pringer (2006).
- Czyzyk and Sawatzky (1994) M. T. Czyzyk and G. A. Sawatzky, Phys. Rev. B 49, 14211 (1994).