New Type Ia Supernova Yields and the Manganese and Nickel Problems in the Milky Way and Dwarf Spheroidal Galaxies
Abstract
In our quest to identify the progenitors of Type Ia supernovae (SNe Ia), we first update the nucleosynthesis yields both for near-Chandrasekhar (Ch) and sub-Ch mass white dwarfs (WDs), for a wide range of metallicity, with our two-dimensional hydrodynamical code and the latest nuclear reaction rates. We then include the yields in our galactic chemical evolution code to predict the evolution of elemental abundances in the solar neighborhood and dwarf spheroidal (dSph) galaxies: Fornax, Sculptor, Sextans, and Carina. In the observations of the solar neighborhood stars, Mn shows an opposite trend to elements, showing an increase toward higher metallicities, which is very well reproduced by deflagration-detonation transition of Ch-mass WDs, but never by double detonations of sub-Ch-mass WDs alone. The problem of Ch-mass SNe Ia was the Ni over-production at high metallicities. However, we found that Ni yields of Ch-mass SNe Ia are much lower with the solar-scaled initial composition than in previous works, which keeps the predicted Ni abundance within the observational scatter. From the evolutionary trends of elemental abundances in the solar neighborhood, we conclude that the contribution of sub-Ch-mass SNe Ia in chemical enrichment is up to 25%. In dSph galaxies, however, larger enrichment from sub-Ch-mass SNe Ia than in the solar neighborhood may be required, which causes a decrease in [(Mg, Cr, Mn, Ni)/Fe] at lower metallicities. The observed high [Mn/Fe] ratios in Sculptor and Carina may also require additional enrichment from pure deflagrations, possibly as Type Iax supernovae. Future observations of dSph stars will provide more stringent constraints on the progenitor systems and explosion mechanism of SNe Ia.
26.30.-k,
1 Introduction
Although Type Ia Supernovae (SNe Ia) have been used as a standard candle to measure the expansion of the Universe, there is a small but significant variation in their luminosities. Brighter SNe Ia show a slower decay, which shows a correlation between the peak luminosity and light curve width (Phillips, 1993). The luminosity variation is empirically corrected in the supernova cosmology (Perlmutter et al., 1999; Riess et al., 1998), although the physical origin of the relation is uncertain. The dependence of this variation on the host galaxies has first been reported by Hamuy et al. (1996), where the mean peak brightness is dimmer in elliptical galaxies than in spiral galaxies. Umeda et al. (1999) provided the first theoretical explanation for this dependence, assuming that a smaller C/O ratio leads to a dimmer SN Ia (see also visualization in Fig. 7 of Nomoto et al. 2000). Similar dependencies of the luminosity variation on various properties of host galaxies are found in more recent observations (e.g., Childress et al., 2013), but the origin of the variation has not been confirmed yet.
The progenitor of SNe Ia is still a matter of big debate (see Hillebrandt & Niemeyer 2000; Maoz et al. 2014; Soker 2019 for a review). It is a combined problem of the progenitor systems and the explosion mechanism. In recent works, common progenitors are (1) deflagration or delayed detonation (DDT) of a near-Chandrasekhar (Ch)-mass carbon-oxygen (C+O) white dwarf (WD) in a single degenerate system (Whelan & Iben, 1973; Nomoto, 1982a), (2) sub-Ch-mass explosion in a double degenerate system (e.g., Iben & Tutukov, 1984; Webbink, 1984; Pakmor et al., 2012), (3) double detonations of sub-Ch-mass WDs in a single or double degenerate system (e,g, Nomoto, 1982b; Iben & Tutukov, 1991; Ruiter et al., 2014), (4) weak deflagration of a near-Ch or super-Ch mass WD with a low mass WD remnant in a single degenerate system, which possibly correspond to a Type Iax supernova (SN Iax, Foley et al., 2013; Meng & Podsiadlowski, 2014; Fink et al., 2014; McCully et al., 2014), and (5) delayed explosion of a rotating super-Ch-mass C+O WD (Benvenuto et al., 2015), which could be formed from merging of a C+O WD with the core of massive asymptotic giant branch (AGB) star during common envelope evolution (Soker, 2015).
For the nucleosynthesis yields of SNe Ia, the so-called W7 model (Nomoto et al., 1984; Thielemann et al., 1986; Nomoto et al., 1997; Iwamoto et al., 1999) has been the most favoured 1D model for reproducing the observed spectra of SNe Ia (Hoeflich & Khokhlov, 1996; Nugent et al., 1997). In recent works, 3D simulations of a delayed detonation in a Ch-mass WD and of a violent merger of two WDs (Röpke et al., 2012), and 2D simulations of a double detonation in a sub-Ch-mass WD (Kromer et al., 2010) can also give a reasonable match with observations. The advantage of the W7 model is that it also reproduces the Galactic chemical evolution (GCE) in the solar neighborhood, namely, the observed increase of Mn/Fe with metallicity as well as the decrease of elements (O, Mg, Si, S, and Ca) (Kobayashi et al., 2006); with the updated nucleosynthesis yields of core-collapse supernovae (with a mix of normal supernovae with erg and hypernovae with erg at stars), [Mn/Fe] is about at [Fe/H] , and increases toward higher metallicities because of the delayed enrichment of SNe Ia. However, there is a remaining problem in GCE with the W7 yields; the Ni/Fe ratio is higher than observed at [Fe/H] , which could be solved with DDT models (e.g., Iwamoto et al., 1999). An updated GCE model with the DDT yields from Seitenzahl et al. (2013) was shown in Sneden et al. (2016), which indeed gives Ni/Fe ratios closer to the observational data.
In contrast to these Ch-mass models, sub-Ch-mass models, which have been re-considered for SNe Ia with a number of other observational results such as supernova rates (e.g., Maoz et al., 2014) and the lack of donors in supernovae remnants (Kerzendorf et al., 2009), do not match the GCE in the solar neighborhood. The Mn production from sub-Ch-mass models is too small to explain the observations in the solar neighborhood (Seitenzahl et al., 2013). SNe Iax could compensate this with their large Mn production, but their rate seems to be too low for the solar neighborhood (Kobayashi et al., 2015, 2019, hereafter K19).
Recently, dwarf spheroidal galaxies (dSphs) have been used as another site for constraining nucleosynthesis yields because of their low metallicities. Using our GCE model, Kobayashi et al. (2015) showed that a mix of sub-Ch-mass SNe Ia and SNe Iax may be able to explain the scatter in the observed abundance ratios, which was confirmed by a stochastic chemical evolution model in Cescutti & Kobayashi (2017). Recently, Kirby et al. (2019) used a large sample of observational data and concluded that sub-Ch-mass SNe Ia are the main enrichment source in dSphs.
In this paper, we test SN Ia progenitor models using updated SN Ia yields sets both for Ch and sub-Ch mass explosions. The yields are calculated with our new 2D explosion and nucleosynthesis code (Leung & Nomoto, 2018) for a wide range of metallicity (§2). Using a GCE model (Kobayashi et al., 2000), we show the evolution of elemental abundances ratios of iron-peak elements in the solar neighborhood (§3) and dSphs (§4), and put a constraint on the explosion models of SNe Ia comparing with observed stellar abundances. §5 gives our conclusions.
| Model | mechanism | Ni) | |||||||||
|---|---|---|---|---|---|---|---|---|---|---|---|
| Near-Ch-mass model | DDT | 30 | 1.38 | 0 | 1900 | 17.7 | 12.7 | 0.78 | 0.63 | ||
| Sub-Ch-mass model | DD | 0.32 | 1.0 | 0.05 | 6200 | 10.2 | 8.7 | 0.98 | 0.63 |
2 Nucleosynthesis yields
Here we briefly describe the methods for producing the representative SN Ia models using both Ch and sub-Ch mass C+O WD. Detailed model descriptions and parameter studies can be found in Leung & Nomoto (2018, hereafter LN18) and Leung & Nomoto (2020, hereafter LN19), respectively.
2.1 Methods
We use our own two-dimensional hydrodynamics code, primarily developed to model SNe Ia (Leung et al., 2015a). The code has been applied to various types of SN explosions, including sub-luminous SNe Ia (Leung et al., 2015b), near-Ch-mass SNe Ia (Nomoto & Leung 2017a; LN18) sub-Ch-mass SNe Ia (LN19) and electron-capture SNe (Nomoto & Leung, 2017b; Leung & Nomoto, 2019; Leung et al., 2020). The code includes the necessary physics such as the flame-capturing scheme by the level-set method (Reinecke et al., 1999b) with reinitilization (Sussman et al., 1994), sub-grid turbulence (Clement, 1993; Niemeyer et al., 1995; Schmidt et al., 2006), and the three-step simplified nuclear reaction scheme (Calder et al., 2007). In contrast to Calder et al. (2007), we choose to record the chemical composition in the hydrodynamical simulations explicitly; our hydrodynamical code includes a simplified 7-isotope network of 4He, 12C, 16O, 20Ne, 24Mg, 28Si, and 56Ni (Eq.8 of LN18, see also Timmes et al., 2000) with their three-step scheme.
For post-processing nucleosynthesis, we use a larger 495-isotope network for nuclear reactions, containing isotopes from 1H to 91Tc. We use the tracer particle scheme (Travaglio et al., 2004), which records the thermodynamic trajectory as a function of time. We also use the nuclear reaction network (Timmes, 1999) to compute the exact nucleosynthesis yields. Nucleosynthesis yield tables are obtained after short-life radioactive isotopes have decayed111The decay time was years in LN18 and LN19, but is years in this paper, which results in a significant difference in Co yields.. Note that 26Al and 60Fe yields are added to those of 26Mg and 60Ni, respectively, in GCE calculation.
2.2 Near-Chandrasekhar-Mass White Dwarf
For near-Ch-mass models, we first construct an isothermal hydrostatic equilibrium C+O WD. In this paper, we assume the central density g cm-3 with uniform temperature K (Nomoto, 1982a). The composition is assumed to be uniform as C) = O) = for the metallicities of and . The component is scaled to the solar abundances (Lodders, 2010) in this paper, which gives a significant difference in the nucleosynthesis yields. With , the benchmark model is selected by requiring three conditions: 1) it has a yield of 56Ni 0.6 as found in typical SNe Ia (Li et al., 2011b; Piro et al., 2014); 2) it has a comparable Mn production at the solar metallicity; 3) it does not severely over-produce stable Ni.
In Table 1 we tabulate the fundamental stellar parameters and the resultant explosion energies of our benchmark models for Ch and sub-Ch mass SNe Ia. It can be seen that the nucleosynthesis yields of the near-Ch-mass model satisfy these three criteria of the benchmark models.
In LN18 we have computed 45 models of SNe Ia using near-Ch-mass C+O WDs as the progenitors. In view of the diversity of observed SNe Ia, an extended parameter space, including a central densities of to g cm-3 (corresponding to initial masses of 1.30 - 1.38 ), metallicities from (22Ne) 0 to 5 222The solar metallicity was 0.02 and the other elements were not included in the initial composition in LN18 and LN19, which gives a significant difference in 58Ni yields., C/O mass ratios from 0.3 to 1, and different ignition kernels from the centered flame to the off-centered flame have been surveyed. We have then shown that the central density and metallicity are important parameters that strongly affect nucleosynthesis yields; higher central density allows larger production in neutron-rich isotopes such as 50Ti, 54Cr, 58Fe, and 64Ni, while higher metallicity mostly enhances isotopes related to the direct product of 22Ne, such as 50V, 50Cr, 54Fe, and 58Ni.
For the explosion mechanism, in this paper the turbulent deflagration model with deflagration-detonation transition (DDT) (see e.g. Khokhlov, 1991; Golombek & Niemeyer, 2005; Röpke & Niemeyer, 2007; Seitenzahl et al., 2013) is adopted for the following two reasons. First, the multi-dimensional pure turbulent deflagration (PTD) model (Reinecke et al., 1999a, 2002a, 2002b; Röpke et al., 2007; Ma et al., 2013; Fink et al., 2014) is very likely to leave a remnant and its explosion is weak. The low ejecta mass may not be important for chemical enrichment compared to other explosion models. Second, the gravitationally confined detonation (GCD) model (Plewa et al., 2004; Jordan et al., 2008; Meakin et al., 2009; Jordan et al., 2012; Seitenzahl et al., 2016) tends to produce very strong explosions with a small amount of neutron-rich isotopes, including Mn. As discussed in Seitenzahl et al. (2013), there is not yet another major site for the production of Mn. Therefore, we focus on the DDT model, which is more robust in producing iron-peak elements, although the PTD was also investigated in LN18.
In the core of near-Ch-mass C+O WDs, we introduce an initial carbon deflagration. The flame structure is a “three-finger” structure as in Reinecke et al. (1999a). Other flame structures were also investigated in LN18 and we showed that the overall abundance pattern is less sensitive to the initial flame structure.
The deflagration starts at the center of the WD and makes the star expand slowly, so that the core is always the place of highest central density and temperature. At second after the deflagration started, the DDT occurs. The detonation provides a strong shock for compressing the surrounding material. This causes a sharp rise in the global maximum density and temperature ( and , respectively), which leads to a “wiggling” rise in the central density and temperature from 1 - 2 seconds. Beyond seconds, the star enters homologous expansion and observable exothermic nuclear reactions take place (see Figs. 2, 3, 25, and 26 of LN18 for the density, temperature, energy, and luminosity evolution).
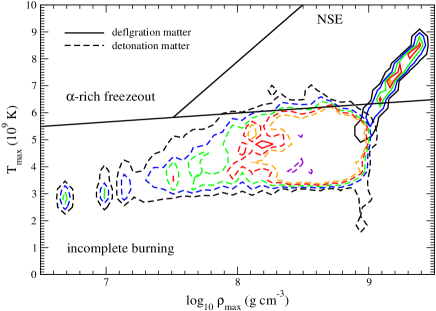
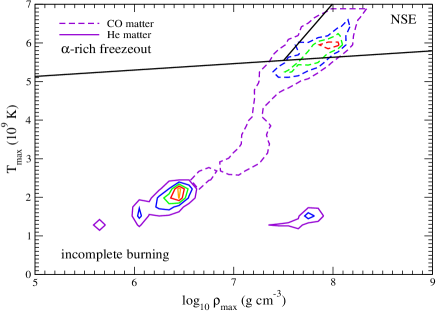
In Figure 1 we show the distribution of against for the near-Ch-mass benchmark model according to the thermodynamic trajectories of the tracer particles. There are two populations of tracer particles. For g cm-3, there is a tight relation of increasing with . This corresponds to the particles being incinerated by the deflagration wave. Due to the sub-sonic nature, no shock wave is created during its propagation. The particles are burnt according to their local density. On the other hand, for particles with g cm-3, spans a wider range. This corresponds to the particles being incinerated by the detonation wave. Because there is more than one C-detonation triggered during the explosion, the collision of shock waves provide an observable shock heating, which creates the spectra as seen in the figure.
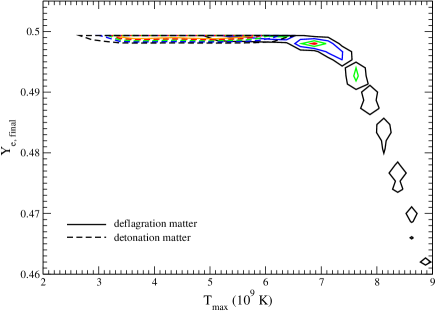
In Figure 2 we show the distribution of the electron fraction, , against for the tracer particles. It can be seen again, that there are two populations of particles. At K, drops towards higher from the initial 0.5 to . This corresponds to the particles incinerated by the deflagration wave at high densities, where electron capture can efficiently take place. The other population corresponds to the particles burnt by the detonation wave or by the deflagration wave with a low density. Electron capture occurs at a much slower rate, so that stays between and at K.
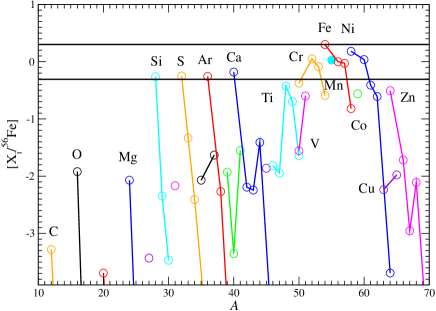
The nucleosynthesis yields of the benchmark model are shown in Figure 3, where mass ratios scaled to the solar ratios, [Fe], are plotted against the mass number. The two horizontal lines correspond to twice- and half-solar ratios. Due to the fast detonation wave, very small amounts of C, O, and Ne are left in the WD. The detonation wave mostly burns matter at a low density and produces intermediate mass elements from Si to Ca close to the solar ratios. One can also see a healthy production of iron peaked elements from Cr to Ni, except mild over-production of 54Fe and 58Ni. Heavier iron-peak elements such as Co and Zn are under-produced.
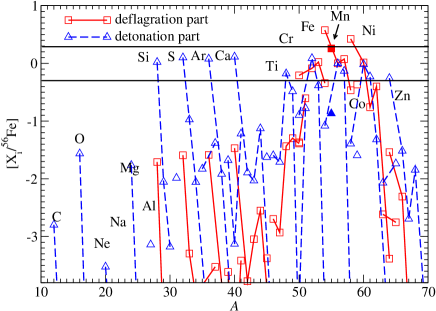
In Figure 4 we plot the same abundances split into the deflagration and detonation components. As noted previously, the detonation (dashed line) mainly burns the low density matter, and small amounts of C, O and Ne are left. It mostly produces the intermediate mass elements, in particular 28Si, 32S, 36Ar and 40Ca, with the values even higher than the solar ratios. The detonation wave also produces some iron-peak elements very close to the solar ratios. On the other hand, the deflagration wave (solid line) burns mainly high density matter and no fuel is left. It also produces very little intermediate mass elements. However, electron capture occurs mainly in matter burnt by the deflagration, where the iron-peak elements, including neutron-rich ones such as 54Fe, 55Mn, and 58Ni, are largely enhanced.
2.3 Sub-Chandrasekhar-Mass White Dwarf
For the sub-Ch-mass models, we construct a two-layer WD with carbon-oxygen in the core and pure helium in the envelope. The helium layer has to be thin (e.g., Fig. 7), and in this paper we adopt . Note that this value is smaller than assumed in the binary population synthesis model by Ruiter et al. (2011, ) and is consistent with other previous works on explosions (Bildsten et al., 2007; Shen & Bildsten, 2009; Fink et al., 2010; Kromer et al., 2010; Woosley & Kasen, 2011). The total WD masses including the He layer are 0.9, 0.95, 1.0, , and . The assumption of the composition is the same as near-Ch-mass models in §2.2 but with the metallicities of , 0.001, 0.002, 0.004, 0.01, , and . For , the benchmark model is selected to produce a normal SN Ia of 56Ni mass . It is known that sub-Ch-mass models cannot produce sufficient Mn for explaining the solar abundance (Seitenzahl et al., 2013). Thus, we do not impose any constraint on the Mn production. Again, we also require stable Ni not to be over-produced.
In LN19 we have computed a series of 40 models of SNe Ia using sub-Ch mass C+O WDs as the progenitors. A wide range of models with a progenitor mass from 0.9 - 1.2 has been computed for metallicities from 0 to 5 333The initial composition and the decay time are updated in this paper, similar to near-Ch-mass models., C/O mass ratios from 0.3 to 1.0, and He envelope masses from 0.05 to 0.2 . The initial mass and metallicity strongly affects nucleosynthesis yields. Unlike the near-Ch-mass models where the central density determines the occurrence of electron capture, the initial mass determines the 56Ni production, and the abundance pattern mainly depends on the scaling with 56Fe. Therefore, compared to the near-Ch-mass models, there is a smaller variety of abundance patterns for sub-Ch-mass models because of its pure detonation nature, where most matter does not have a sufficiently high density for rapid electron capture before it cools down by expansion.
For the explosion mechanism, in this paper the double detonation model is used, where the carbon detonation is triggered by helium detonation. In LN19, multiple types of detonation-triggers were investigated; one bubble (a spherical shell), multiple bubbles, and a belt-shaped helium detonation at the beginning of the simulations. Although this affects the minimum helium mass required for detonation, for the models with the abundance patterns of iron-peak elements are not so different, and thus we only use the spherical one (“S”-type in LN19) in this paper.
The simulation starts from a He detonation in a 100km spherical shell just outside of the C+O core. Since it is super-sonic, both central density and temperature of the WD remain unchanged for the first 1 second, although the global maximum temperature () gradually decreases. Once the shock wave reaches the centre, the central C-detonation is triggered, and the central temperature and density rapidly increase. After that the expansion allows the matter to cool down rapidly. Both central and global maximum densities drop together, showing that the core has relaxed and starts its expansion (see Figs. 5, 6, and 7 of LN19 for the temperature, energy, and luminosity evolution).
As in Figure 1, Figure 5 shows the distribution of against for the sub-Ch-mass benchmark model. Due to the detonation nature, there is always a wide spectrum of for a given . This means that the detonation waves inside the stars can efficiently re-heat the matter, even when the matter is completely burnt. Compared to the near-Ch-mass model, this model can achieve similar even with a lower . This is because part of the tracer particles can encounter much stronger shock heating due to geometric convergence, especially near the center.
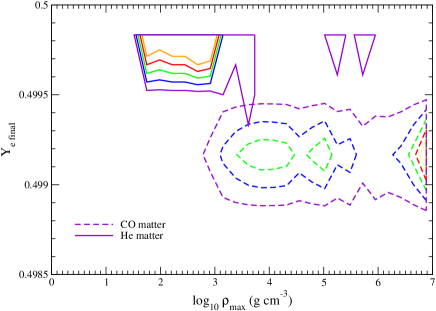
As in Figure 2, Figure 6 shows the distribution of . Compared to the near-Ch-mass counterpart, there are much less tracer particles where significant electron capture takes place. Although the maximum can be comparable to the near-Ch-mass model, the high density is due to shock compression and the time duration for the particle to remain in such a density is comparatively short. Therefore, the fluid elements have less time to carry out weak interactions than in the near-Ch-mass model. Therefore, only a few particles can be found at relatively low as . Note that the range of is much smaller than in Fig. 2.
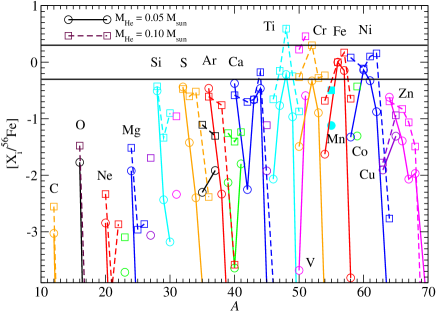
The nucleosynthesis yields, [Fe], are shown in Figure 7 for the sub-Ch mass benchmark model (solid line), comparing to the model with a thicker helium envelope. The star is completely burnt, and only small amounts of C, O, and Ne are left. Intermediate mass elements from Si to Ca show the ratios close to half-solar values. With (dashed line), there is a large enhancement of 48Ti, 51V, and 52Cr. This is related to the helium detonation, especially during the end of He detonation. The iron-peak elements are also healthily produced, except for Mn.
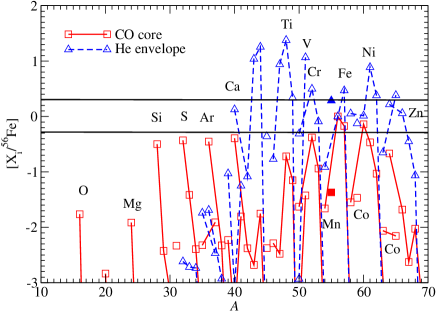
In Figure 8 we plot [Fe] for the sub-Ch-mass benchmark model with the He- and C-detonation components, separately. Again, in the C-detonation component (solid line), since low density matter in the core is also detonated, small amounts of C, O, and Ne remain. Intermediate mass elements are still produced. Sc, Ti, and Cr are under-produced, unlike the full abundance profile in Fig. 7. Among iron-peak elements, only 57Fe and 60Ni are sufficiently produced. On the other hand, the He-detonation (dashed line) produces a very different abundance pattern. Intermediate mass elements are significantly under-produced. In contrast, there is a large enhancement of Ti, Cr, and V, with ratios to 56Fe as large as times the solar values. Iron-peak elements from Mn to Zn look enhanced, but this is due to the small production of 56Ni. Note that the mass of the He envelope is 20 times smaller than that of the C+O core.
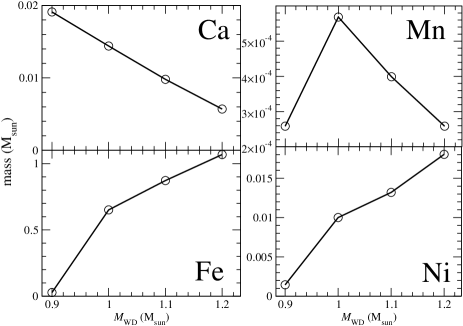
In Figure 9 we plot the total yielded mass of Ca, Mn, Fe and Ni in the ejecta for our sub-Ch-mass models as a function of WD mass. Clear trends can be observed for all elements. The mass yields of Fe and Ni are monotonically increasing against WD, while that of Ca is monotonically decreasing. In contrast, Mn mass increases and then decreases with a transition at . These trends show how the C-detonation strength contributes to the formation and destruction of elements during nucleosynthesis. For the intermediate mass elements such as Si, S, and Ca, when the WD mass increases the C+O-fuel is more likely to undergo complete burning until NSE, and thus the nuclear reactions do not stop at Ca but continue to form iron-peak elements. This also explains the monotonic increase in Fe and Ni with WD mass. The falling part of Mn is also a consequence of the strong C-detonation, which gives more NSE-burning instead of -rich freezeout. The rising part of Mn is caused by suppression of the incomplete and complete Si-burning at the globally low density in low mass WDs.
2.4 Comparison between Benchmark Models
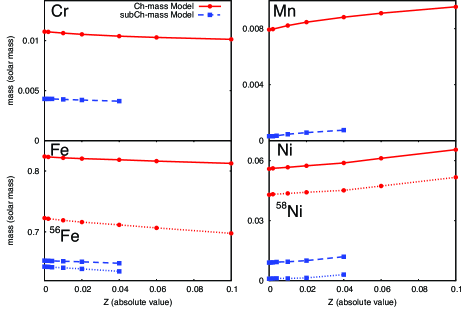
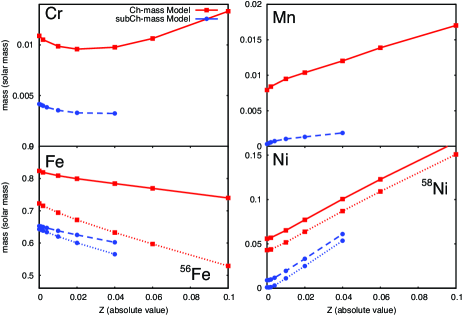
Finally, in Figure 10, we plot the total yielded masses of Cr, Mn, Fe, and Ni in the Ch and sub-Ch mass models as a function of initial metallicity . The metallicity dependence is significantly different from the yields in LN19, which are shown in Figure 11 for comparison. In general, Cr, Mn, Ni are produced more in near-Ch-mass models than in sub-Ch-mass models by a factor of , respectively, and the metallicity dependence for Mn and Ni is stronger (i.e., Z=0 to Z=0.04) in sub-Ch-mass models than in near-Ch-mass models.
The total Cr mass decreases when increases. This trend comes from the the lower energy releases with higher . At in Figure 11, however, Cr mass increases with . For these near-Ch-mass models, when further increases, deflagration is further suppressed, leaving more matter to be burnt by detonation. Note that Cr is produced not only by deflagration and but also by detonation (Fig. 4).
The total Mn mass increases monotonically with because the initial 22Ne is the seed of 55Mn. Mn is much more produced in near-Ch-mass models than in sub-Ch-mass models. This is due to electron capture during the initial deflagration phase, where more matter can have the required to form Mn. In near-Ch-mass models, Mn is mainly produced by NSE during deflagration via 52Fe(,p)55Co, and a ten times smaller amount of Mn can also be produced by incomplete Si-burning at detonation (Fig. 4) depending on . In sub-Ch-mass models, Mn mostly comes from incomplete Si-burning at He detonation (Fig. 8), which also depends on .
The total Fe mass decreases monotonically with because most Fe comes from 56Fe, most of which comes from decay of 56Ni (which has ). This isotope is produced by the ash in detonation which enters the NSE region. Increasing metallicity lowers the original of the fuel. As a result, even without significant electron capture compared to the deflagration ash, the high metallicity automatically suppresses production of 56Ni, and hence decreases total Fe mass.
The total 58Ni mass increases monotonically with , because the initial 22Ne is connected to 58Ni directly by an -chain (e.g., 54Fe()58Ni). However, this trend becomes much weaker if we adopt the solar composition for the initial metallicity (Fig. 10). Higher metallicity models have a slightly stronger detonation, which also enhances 58Ni production. 58Ni is produced in NSE by the deflagration in near-Ch-mass models (Fig. 4) independent of , and also by incomplete Si-burning at detonation in near-Ch and sub-Ch mass models, depending on (Fig. 8).
3 Galactic Chemical Evolution
| SN, Ch only | 5 | 4.7 | - | - |
|---|---|---|---|---|
| SN, 75% sub-Ch | 5 | 4.0 | - | - |
| SN, 50% sub-Ch | 5 | 3.2 | - | - |
| SN, sub-Ch only | 5 | 1.0 | - | - |
| Fornax | 10 () | 25 | 5 | 12 |
| Fornax, no sub-Ch | 10 () | 15 | 5 | 12 |
| Sculptor | 1 | 50 | 1 | 9 |
| Sculptor, no sub-Ch | 1 | 40 | 1 | 9 |
| Sextans | 0.5 | 100 | 1.4 | 7 |
| Sextans, no sub-Ch | 0.5 | 70 | 1.4 | 7 |
| Carina | 0.1 () | 200 | 5 | 12 |
| 100 () | ||||
| Carina, no sub-Ch | 0.1 () | 100 | 5 | 12 |
| 100 () | ||||
| Carina, Iax*50 | 0.1 () | 400 | 5 | 12 |
| 100 () |
3.1 The GCE code
Since nucleosynthesis yields are significantly different between Ch and sub-Ch mass SNe Ia, changing the relative contribution results in different elemental abundance ratios at a given metallicity. The evolutionary tracks of elemental abundance ratios depend on the star formation history. However, the star formation history can be tightly constrained from the other independent observations, namely, the metallicity distribution function of stars in the system considered, and in the solar neighborhood, only a small variation is possible for the evolutionary tracks of elemental abundance ratios (see Appendix A). Therefore, the elemental abundance ratios in the solar neighborhood have been used as the most stringent constraint for the nucleosynthesis yields of core-collapse supernovae (e.g., Timmes et al., 1995; Kobayashi et al., 2006; Romano et al., 2010) and for the progenitor models of SNe Ia (e.g., Matteucci & Greggio, 1986; Kobayashi et al., 1998).
The evolutionary tracks of elemental abundance ratios are calculated with GCE models (Tinsley, 1980; Pagel, 1997; Matteucci, 2001), and our basic equations are described in Kobayashi et al. (2000). The code follows the time evolution of elemental and isotopic abundances in a system where the interstellar medium (ISM) is instantaneously well mixed (and thus it is also called a “one-zone” model). No instantaneous recycling approximation is adopted and thus chemical enrichment sources with long time-delays such as SNe Ia are properly included.
The stellar physics/empirical relations included in our GCE models are as follows; The star formation rate (SFR) is proportional to the gas fraction, which evolves with inflow and outflow to/from the system considered as well as mass-loss from dying stars and supernova explosions. The Kroupa initial mass function (IMF) is adopted (Kobayashi et al., 2011, hereafter K11). The nucleosynthesis yields of core-collapse supernovae, Type II supernovae and hypernovae (HNe), are also taken from K11444The yield table is identical to that in Nomoto et al. (2013). but with failed supernovae at (K19). The HN fraction depends on the metallicity; , and for , and (Kobayashi & Nakasato, 2011). Then, the gas infall and star formation timescales, and , are determined to match the observed metallicity distribution function (MDF) of the system. As shown in Appendix A, the set of and can be uniquely determined from the MDF (Fig.25), and we chose and for our fiducial model (K11). Our conclusions are not affected by this choice of these parameters.
3.2 SN Ia model
For Ch-mass SNe Ia (), we introduced our formulation for the rate in K98, and the details are discussed in Kobayashi & Nomoto (2009, hereafter KN09). The lifetime distribution function (also called delay-time distribution, DTD) is calculated with Eq.[2] in KN09; it multiplies the mass functions of primary and secondary stars, and gives a very similar results to the formula in Greggio & Renzini (1983). The main difference is that we include the metallicity dependence of secondary mass ranges due to the requirements of the WD optically-thick winds (Kobayashi et al., 1998) and the mass-stripping on the binary companion stars (KN09). As a result, our SN Ia rate drops at lower [Fe/H] than (i.e., ). Without this metallicity effect on the SN Ia rate, it is not possible to reproduce the observed [O/Fe]–[Fe/H] relation in the solar neighborhood (K98, see also Fig.15). This metallicity cut is not inconsistent with the observed metallicities of host galaxies (KN09), although such metallicity dependence has not yet been seen in the observations of SN Ia rates. In the observed mass-metallicity relation of galaxies, the stellar metallicity of [Fe/H] corresponds to a stellar mass of (Zahid et al., 2017), above which the specific SN Ia rate increases toward lower-mass galaxies but is uncertain below this mass (Brown et al., 2019).
The range of lifetimes are determined from the mass ranges of secondary stars (K09). As a result, the main sequence (MS) starWD systems have timescales of Gyr, which are dominant in star-forming galaxies and correspond to the observed “prompt” population (Mannucci et al., 2006; Sullivan et al., 2006), while the red giant (RG) starWD systems have lifetimes of Gyr, which are dominant in early-type galaxies and correspond to the “delayed” population. The shortest lifetime depends on the maximum secondary mass, which depends the progenitor metallicity (KN09). The longest lifetime is determined from the minimum secondary mass, which is independent of metallicity. At high metallicity, stellar luminosity is lower due to the higher opacity, which results in a longer stellar lifetime. Therefore, our SN Ia lifetime becomes as long as 20 Gyr at solar metallicity. This metallicity dependent lifetime was not taken into account in Hachisu et al. (2008).
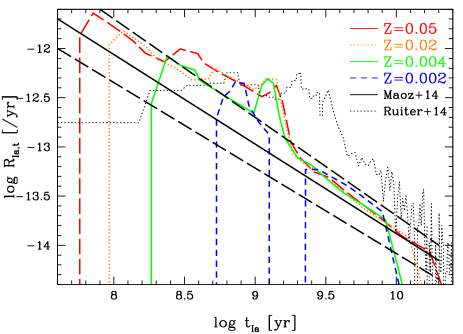
Finally, the normalization, i.e., the absolute rate of (Ch-mass) SNe Ia, is determined by two binary parameters respectively for the MS+WD and RG+WD systems, and . The set of and can be uniquely determined from the [O/Fe]–[Fe/H] relation at [Fe/H] (Fig.26), and we chose and for our fiducial model. This choice does not affect our conclusions either, as shown in Figure 26 of Appendix A. The binary parameters include not only binary fractions, but also separations and any other conditions that successfully lead SN Ia explosions, and the numbers are defined as the fractions of WDs that eventually explode as SNe Ia at . At , the resultant delay-time/lifetime distribution is very similar to that derived from observed supernova rates in nearby galaxies (Maoz et al., 2014). Figure 12 shows the comparison of observational and theoretical distributions to ours.
For sub-Ch-mass SNe Ia, we used the same formula for single degenerate systems in Kobayashi et al. (2015). In this paper, however, in order to include sub-Ch-mass SNe Ia both from single and double degenerate systems, we use the “observed” delay-time distribution function instead; the rate is at 1 Gyr, proportional to over 0.04-20 Gyr, independent of metallicity. For single degenerate systems, the rate could be higher for lower metallicities because the maximum secondary mass becomes lower (see Fig.1 of Kobayashi et al. 2015). For double degenerate systems, however, no such a metallicity dependence is expected, but this should be studied in more details with binary population synthesis. For sub-Ch-mass SNe Ia, the nucleosynthesis yields not only depend on metallicity but also depend on the masses of the primary WD. Since the mass distribution of primary WDs is uncertain, we add the contributions from , and WDs respectively with 10%, 40%, 40%, and 10% for our 2D double detonation yields. With this weighting, on average sub-Ch-mass SNe Ia give less Fe mass per event than for Ch-mass SNe Ia.
3.3 Star Formation History
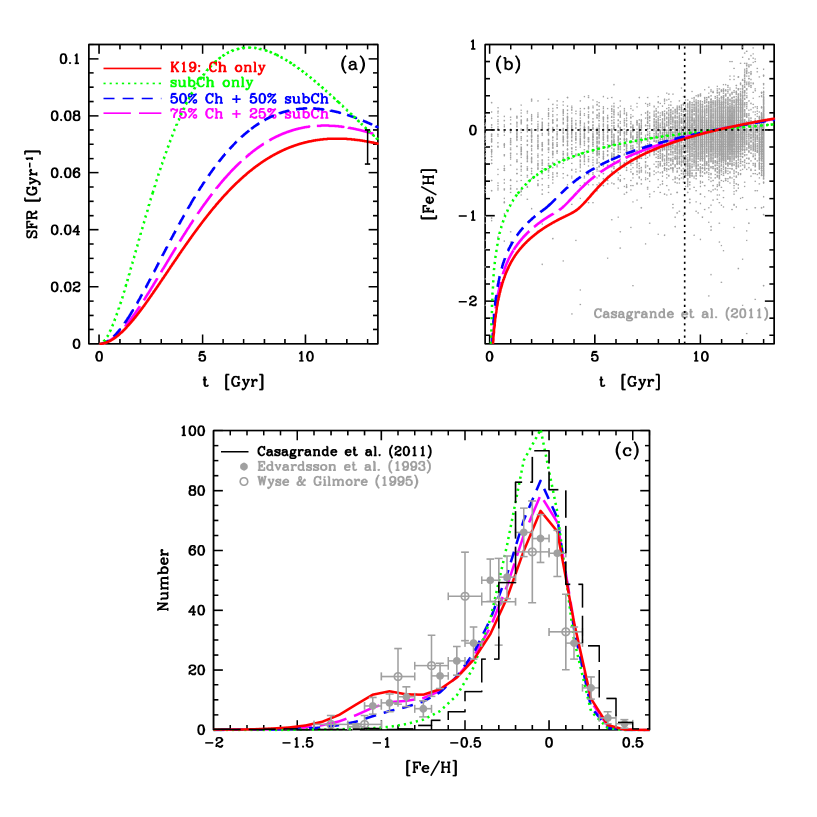
In this paper, we show four GCE models with Ch-mass SNe Ia only (solid lines), sub-Ch-mass SNe Ia only (dotted lines), 50% each contribution (short-dashed lines), and 75% Ch-mass and 25% sub-Ch-mass SNe Ia contributions (long-dashed lines). For each case, star formation and infall timescales are chosen to reproduce the observed metallicity distribution function (Fig. 13c), as well as the present SFR (Fig. 13a) and the solar metallicity at 4.6 Gyr ago (Fig. 13b). In the models with sub-Ch-mass SNe Ia, because of lower Fe production (on average), higher SFRs are required to obtain the same peak metallicity of the MDF, compared with the model with Ch-mass SNe Ia only (Table 2).
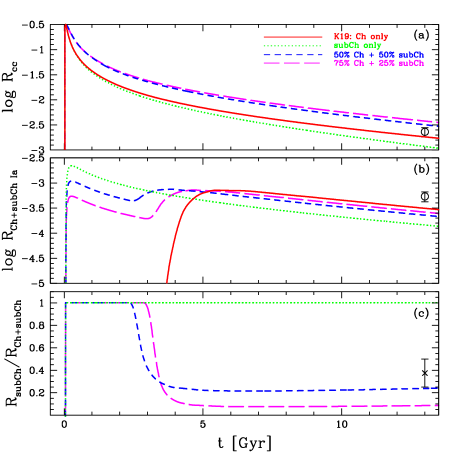
Figure 14 shows supernova rate histories. Reflecting the small difference in the SFRs, there is also a small difference in the core-collapse supernova rates (panel a). The middle panel shows the total SN Ia rates. With the “observed” delay-time distribution, sub-Ch-mass SNe Ia start to occur Gyr after the onset of galaxy formation, and the rate monotonically decreases as a function of time. Therefore, with a larger fraction of sub-Ch-mass SNe Ia, the total SN Ia rate becomes higher at early epochs. This means that the ISM reaches [Fe/H] earlier, Ch-mass SNe Ia start to occur earlier with our progenitor model, and thus the second peak caused by Ch-mass SNe Ia also appears earlier. The model with Ch-mass SNe Ia only gives the best match to the observed rate for Milky-Way type galaxies. Note that, however, this is not a totally fair comparison since the observed values are for the entire galaxy while the model is for the solar neighborhood.
It is difficult to observationally estimate the sub-Ch-mass fraction in the total SN Ia rate; it requires estimating ejecta mass from supernova light curves modelling as well as handling the selection bias of observed supernovae. Scalzo et al. (2014) estimated the sub-Ch-mass fraction at 25-50% in their unbiased sample of spectroscopically normal SNe Ia. The bottom panel shows the fraction of sub-Ch-mass SNe Ia to the total SNe Ia rate for our models, which evolves as a function of time. It is 100% at the beginning, while it decreases once Ch-mass SNe Ia starts to occur. At present, 50% GCE contribution of sub-Ch-mass SNe Ia results in 25% of sub-Ch-mass fraction in the SN Ia rate (blue short-dashed line), which is in reasonable agreement with the observational estimate. This fraction also depends on the evolutionary phase of the galaxy, and hence on the type/mass of the host galaxies. On the other hand, the observational estimate of the sub-Ch-mass fraction is for the average of various types/masses of galaxies with various stellar ages. Because of these reasons, we do not adopt the “observed” sub-Ch-mass fraction, but instead aim to constrain the fraction using GCE modes.
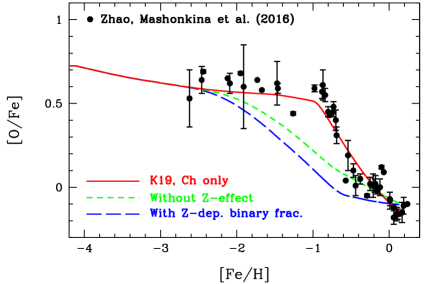
Figure 15 shows the resultant [O/Fe]–[Fe/H] relations for the models with Ch-mass SNe Ia only. Without the metallicity effect on the WD winds, it is not possible to reproduce the observed evolutionary change of [O/Fe] at [Fe/H] (see §3.4 for the observational data). As noted above, changing star formation timescale would not solve this problem, while reproducing the observed MDF (see also Fig.25). Recently, metallicity dependence of the binary fraction is indicated from observations (Moe et al., 2019), where the binary fraction is higher at lower metallicities. If we scale our binary parameter ( and ) to the observed metallicity-dependent binary fraction, then there are many more SNe Ia at earlier epochs, which decreases the [O/Fe] ratios even further away from the observational data. Therefore, it is necessary to include our metallicity effect of Ch-mass SNe Ia in order to reproduce this most important observation of GCE.
3.4 Elemental Abundance Ratios
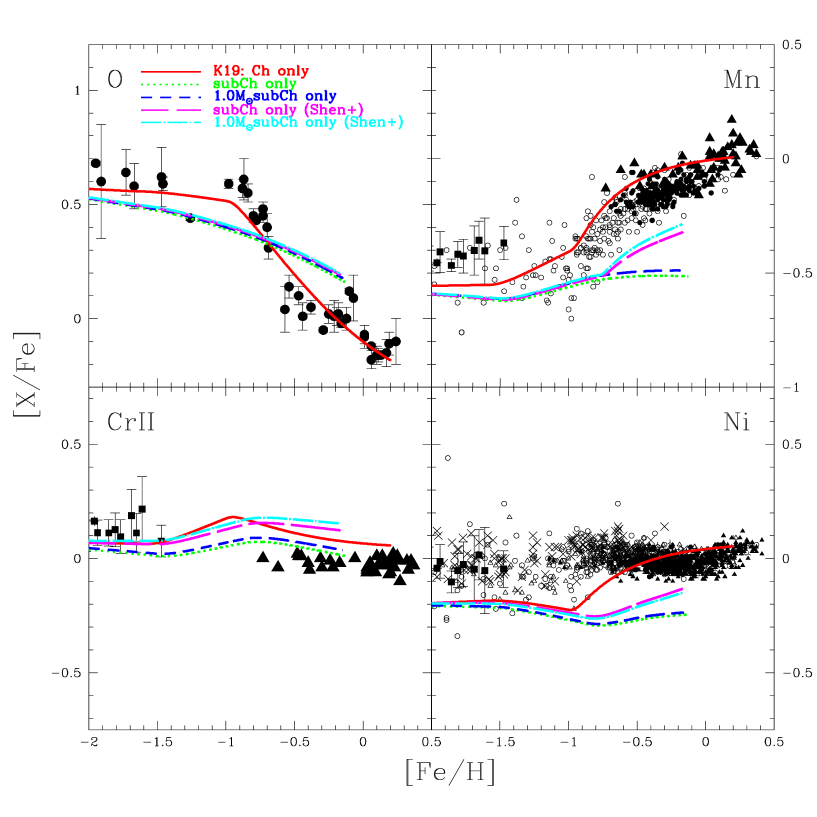
Not only [O/Fe] ratios but also abundance ratios among iron-peak elements are the key to constrain the fraction of sub-Ch-mass SNe Ia. For the elemental abundance ratios of individual stars, the most accurate observational data, i.e., high-resolution observations with star-by-star analysis, are available for the solar neighborhood. We take the non-local-thermodynamic equilibrium (NLTE) abundances for oxygen (Zhao et al., 2016), while LTE abundances are used for iron-peak elements (e.g., Reddy et al., 2003; Feltzing et al., 2007; Bensby et al., 2014; Reggiani et al., 2017). The NLTE effects of iron-peak abundances could also be important. It is worth noting, however, that the effects may not be so large with the updated atomic data (Sneden et al. 2016, but see Bergemann & Gehren 2008). The exception is for Cr, and we plot Cr II observations (see Kobayashi et al. 2006 for the comparison between Cr I and Cr II observations).
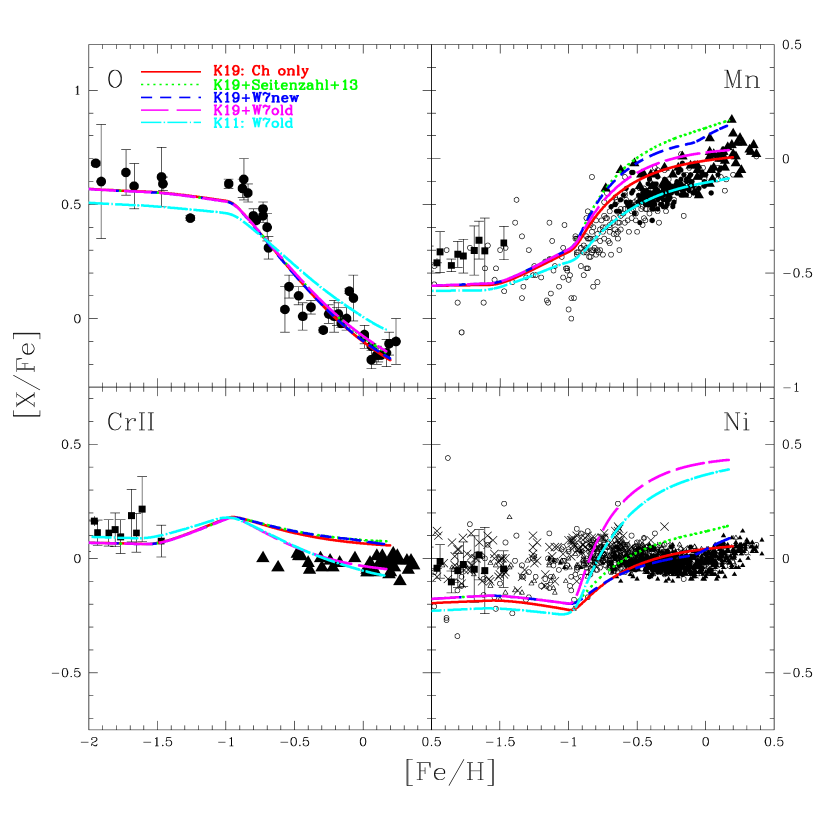
Figure 16 shows the evolution of elemental abundances against [Fe/H] for the models with various yields of Ch-mass SNe Ia. [O/Fe] shows a decrease from [Fe/H] to higher [Fe/H], while [Mn/Fe] shows an increase; these opposite behaviours are well reproduced by the delayed enrichment of SNe Ia. The observed [Ni/Fe] ratios show a constant value of over all the metallicity range. It has been known that the W7 yields (Nomoto et al., 1997; Iwamoto et al., 1999) over-produce Ni by dex (magenta long-dashed and cyan dot-dashed lines; see also Fig. 24 of Kobayashi et al. 2006). This Ni over-production problem is mostly solved with the updated nuclear reaction rates, mainly due to the lower electron-capture rates (blue dashed lines)555The updated W7 yields were presented in Nomoto & Leung (2018) and LN18, which are re-calculated with new initial composition and decay time in this paper.. becomes higher approaching to 0.5, which gives lower [(Ni, Co)/Fe] and higher [(Cr, Mn)/Fe]. Our 2D DDT yields of give very similar results (red solid lines) as the updated W7 yields, but the [Mn/Fe] ratio is reduced by 0.1 dex because of slower flame speed in our more realistic 2D model, which gives a better agreement with observations. The 3D DDT yields from Seitenzahl et al. (2013) also give very similar results (green dotted lines) as our 2D DDT yields but with 0.1 dex higher [(Mn, Ni)/Fe] ratios. This is probably because their multi-ignitions result in more material to be burnt by deflagration waves.
In summary, with the updated electron-capture rates, these three models (W7, 2D DDT, and 3D DDT) of Ch-mass SNe Ia give the elemental abundance ratios within the observational scatters in the solar neighborhood, and our 2D DDT gives the best fit to [Mn/Ni] ratios at [Fe/H] . The [Ni/Fe] ratio still shows a mild increase from to with [Fe/H]. Whether this is inconsistent or not depends on the yields of core-collapse supernovae that determine the plateau value of [Ni/Fe] at [Fe/H] . Since both Ni and Fe are formed at the innermost regions of core-collapse supernovae, multidimensional effects can change the Ni/Fe ratios.
Although the star formation history is the same as in K11 (cyan dot-dashed lines) and K19 (red solid lines), the K19 model is updated by including faint supernovae, a metal-dependent HN fraction, and different SN Ia parameters. These result in a slightly higher time-integrated SN Ia rate with slightly later start (see Fig.14), which leads to the lower [O/Fe] and higher [(Mn, Ni)/Fe] ratios than in the K11 model, at [Fe/H] . The better match of Ni is not due to the GCE modelling; the K19 model with the old W7 yields (magenta long-dashed lines) still shows the over-production of Ni.
Figure 17 shows the impact of sub-Ch-mass SNe Ia on GCE models. There are two problems when compared with observations. First of all, the decrease of Fe yield results in a much shallower [O/Fe] slope. The difference around [Fe/H] is caused by the metal-independent delay-time distribution adopted for sub-Ch-mass SNe Ia; sub-Ch-mass SNe Ia occur earlier than Ch-mass SNe Ia in the solar neighborhood models. Secondly, the [Mn/Fe] ratio is much lower, giving almost no increase at [Fe/H] , which cannot explain the observations. For Ni, if the Ni/Fe ratio of core-collapse supernovae becomes 0.2 dex higher, sub-Ch-mass SNe Ia might not be inconsistent with the observations. The [Cr/Fe] is 0.05 dex lower than the Ch-mass model, which is more consistent with the observations.
As noted in §3.2, there is a WD mass dependence on the yields of sub-Ch-mass SNe Ia, and WD models gives relatively high Mn/Fe ratios (Fig. 9). Even if we include WDs only (blue short-dashed lines), our conclusion is unchanged; only with sub-Ch-mass SNe Ia, it is impossible to produce enough Mn to explain the observations in the solar neighborhood.
Our 2D yields are notably different from the 1D detonation yields from Shen et al. (2018) (magenta long-dashed lines), with which [(Cr, Mn, Ni)/Fe] ratios are higher than in our models. Here we add the contributions from , and WDs respectively with 5%, 5%, 10%, 40%, and 40%. The difference is not caused by this summation; for the model with only (cyan dot-dashed lines), we also find the same difference between our yields and Shen et al. (2018)’s yields. Note that their yields were calculated using their 1D code without any He layer, and with the initial metallicity given by 22Ne only. Although a larger network is included during hydrodynamical calculation, the network during post-processing is smaller than ours.
In summary, compared with observations, none of these sub-Ch-mass SN Ia models (1D and 2D) show better a match than in the Ch-mass SN Ia model (red solid lines). Sub-Ch-mass SNe Ia may help further in solving the Ni over-production problem, at the expense of reproducing the observed [/Fe] and [Mn/Fe]. Then, the next question is what fraction of SNe Ia can come from sub-Ch-mass WDs?
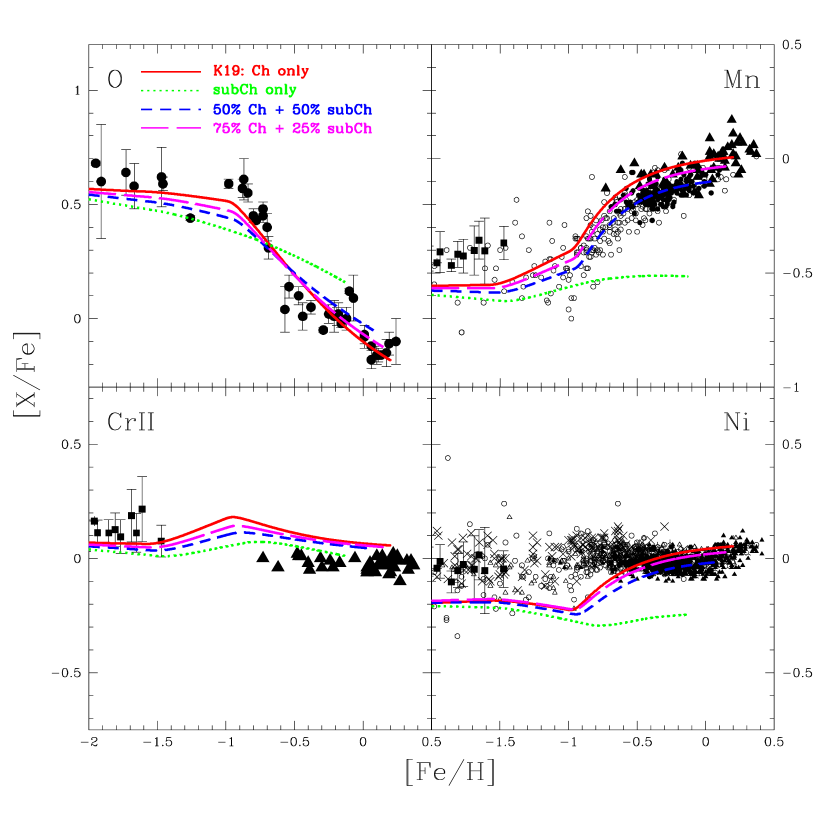
Figure 18 shows the evolution of elemental abundance ratios with varying the fraction of sub-Ch-mass SNe Ia. If 50% of the delay-time distribution comes from sub-Ch-mass SNe Ia, the [O/Fe] slope with [Fe/H] is too shallow, although the [(Mn, Ni)/Fe] ratios are within the scatters of observational data. With 25% sub-Ch-mass SNe Ia and 75% Ch-mass SNe Ia, it is possible to reasonably reproduce all observational constraints.
4 Dwarf Spheroidal Galaxies
Detailed elemental abundances are also obtained for the stars in dSph galaxies (e.g., Tolstoy et al., 2009), and from the observed abundance patterns, it has been debated if dSphs galaxies are the building blocks of the Galactic halo or not. The very different abundance patterns of the stars in ‘classical’ dSphs (with relatively large stellar masses) suggest that dSphs are not the building blocks666Metal-poor stars of ultra-faint dSph galaxies can still be the building blocks., but instead they provide an independent constraint on stellar physics at a different environment.
DSph galaxies are not a homogeneous population but have formed with a variety of star formation histories, and various chemical evolution models have been presented (e.g., Carigi et al., 2002; Lanfranchi et al., 2006; Cescutti et al., 2008; Vincenzo et al., 2014). Because of the shallow potential well, the ISM can be easily blown away due to supernova feedback after the initial star burst. In addition to the description in §3.1, outflow is also included, proportional to the SFR, i.e., the gas fraction of the system, with a timescale . If supernova energies are accumulated, star formation can be totally quenched. This is called galactic winds, and the epoch is defined with . In order to constrain GCE model parameters, it is necessary to have a number of observational constraints such as MDFs, and thus we model four dSphs galaxies, Fornax, Sculptors, Sextans, and Carina, which have stellar masses of , and (McConnachie, 2012). Stellar age distributions have also been estimated comparing photometric data to stellar evolutionary tracks, which are also used for constraining model parameters. The adopted parameters are summarized in Table 2.
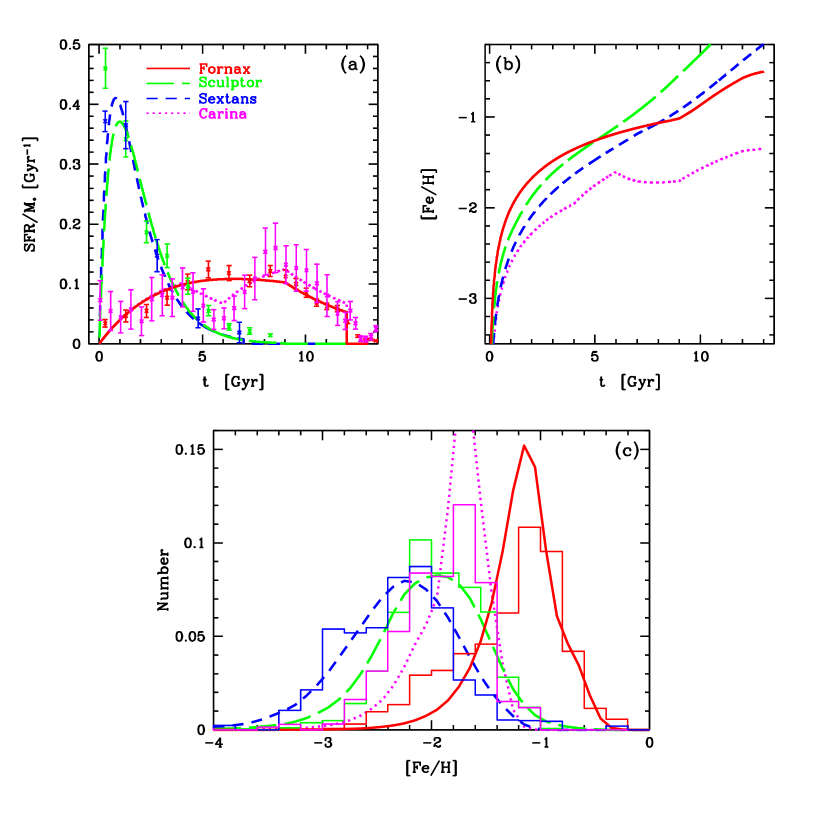
Figure 19 shows the adopted observational constraints of SFRs and MDFs, as well as the model predictions of age-metallicity relations, for the fiducial models of these four dSph galaxies. The resultant formation histories can be summarised as follows. The models for Sculptor and Sextans are very similar; both are formed by a rapid infall and star formation with a strong outflow. Since the star formation efficiency in Sextans is lower than in Sculptor, the average [Fe/H] of the MDF is dex lower, which is probably due to the mass difference of the systems. The models for Fornax and Carina are also similar; both have extended star formation histories with longer infall timescales. Since the star formation efficiency in Carina is lower than in Fornax, the peak [Fe/H] of the MDF is dex lower, which is also due to the mass difference of the systems. There is also an outflow, but this is weaker than in Sculptor and Sextans. Through dynamical interaction, it is possible to have multiple gas infalls in dSph galaxies. The observed age distribution of Carina is well reproduced by two infalls, one with a short timescale and another with a much longer timescale at time Gyr.
Because of the reasons described in the next section, in these fiducial models, the 100% contribution of sub-Ch-mass SNe Ia is added on top of the contributions from core-collapse supernovae and Ch-mass SNe Ia777For the solar neighborhood models in §3, the total SN Ia rate is fixed and only the relative contribution from Ch and sub-Ch mass SNe Ia is varied. (or SN Iax for Sculptor). In the predicted iron abundance evolutions (panel b), chemical enrichment timescales are shorter for more massive systems. In observational data, the age–metallicity relations should have steeper slopes at Gyr, although for such old stars it is very difficult to estimate age and metallicity independently. The three dSph galaxies (except for Carina) reached [Fe/H] at 5 to 10 Gyrs, and after that the iron abundance evolution is speeded up because of Ch-mass SNe Ia. In Carina, however, [Fe/H] never reaches as in the observed MDF (panel c), and thus there is no enrichment from Ch-mass SNe Ia888Note that, however, in more realistic hydrodynamical simulations (e.g., Kobayashi & Nakasato, 2011), Ch-mass SNe can occur at [Fe/H] due to inhomogeneous enrichment, and [/Fe] can show a decrease in the case of strong supernova feedback..
4.1 Elemental Abundance Ratios
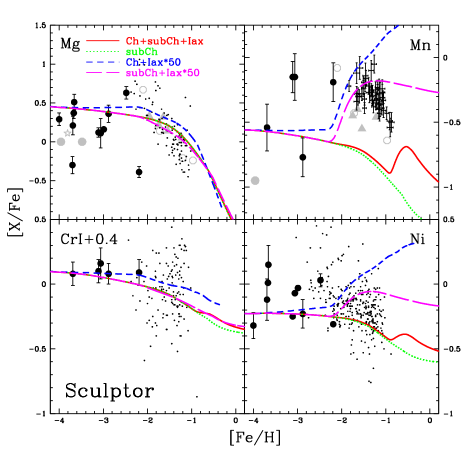
As in §3.4, abundance ratios among iron-peak elements are the key to constrain the contribution of various types of SNe Ia in dSph galaxies. However, it is much harder to estimate these abundance ratios because of the distance of the systems (the only observed stars are red-giants) and the limited samples of each system. In particular, NLTE analysis has been made only for a small number of stars. For constraining models, Mg NLTE abundances and Ni LTE abundances are taken from Mashonkina et al. (2017), which uses the same NLTE model as in Zhao et al. (2016) for the solar neighborhood. Mn and Cr data are taken from Jablonka et al. (2015) also with their LTE analysis. Cr abundances are obtained from the Cr I lines, which are known to underestimate Cr abundances, and a +0.4 dex shift is applied as in Kobayashi et al. (2006). LTE Mn abundances are also taken from North et al. (2012). A few more stars are taken from the data compilation by Venn et al. (2012), and a large sample from medium-resolution spectra by Kirby et al. (2019).
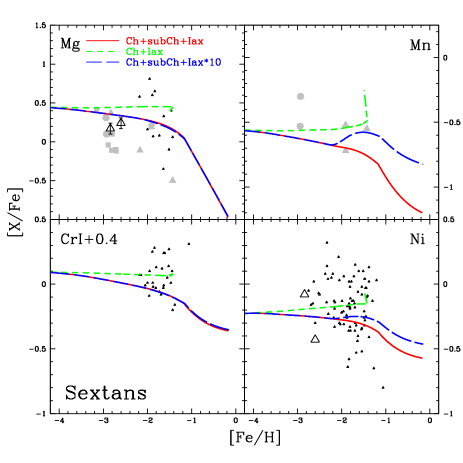
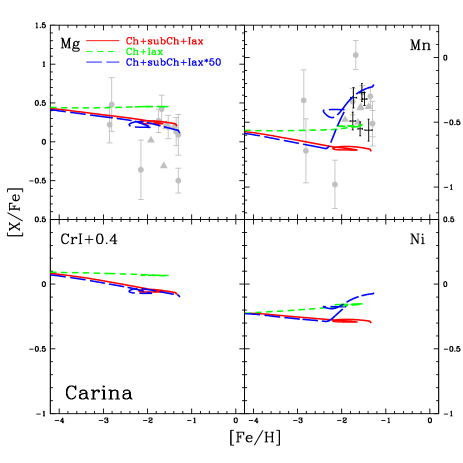
Figures 20-23 show the evolutions of elemental abundances for these four dSph models, with varying the contributions of various types of SNe Ia. As for the solar neighborhood models, the elemental abundance ratios at [Fe/H] are determined from the IMF-weighted yields of core-collapse supernovae. The predicted ratios cannot be rejected by these small sample of observations, but lower [Mg/Fe] ratios might be preferred, which could be produced with an IMF truncated at (Kobayashi et al., 2006; Nomoto et al., 2013). Around [Fe/H] , [X/Fe] starts to decrease in the models with sub-Ch-mass SNe Ia, while [X/Fe] stays constant without sub-Ch-mass SNe Ia. This transition is caused by the shortest lifetime, which is set at 0.04 Gyr as in the “observed” delay-time distribution (Maoz et al., 2014) for sub-Ch-mass SNe Ia in our models (§3.2). Around [Fe/H] , [(Mn, Ni)/Fe] rapidly increases in the models with Ch-mass SNe Ia, while [X/Fe] stays constant without Ch-mass SNe Ia. This transition is caused by the metallicity effect of Ch-mass SNe Ia in our models.
As in Kobayashi et al. (2015), we call pure deflagrations of hybrid C+O+Ne WDs “SNe Iax” and use the nucleosynthesis yields from Fink et al. (2014), which can produce very high [Mn/Fe] ratios at [Fe/H] . In the fiducial models of this paper, the SN Iax rate is determined from the calculated mass range of hybrid WDs (K19), which is much narrower and gives a lower SN Iax rate than in Kobayashi et al. (2015). The normalization is given by the same binary parameters for Ch-mass C+O WDs; and .
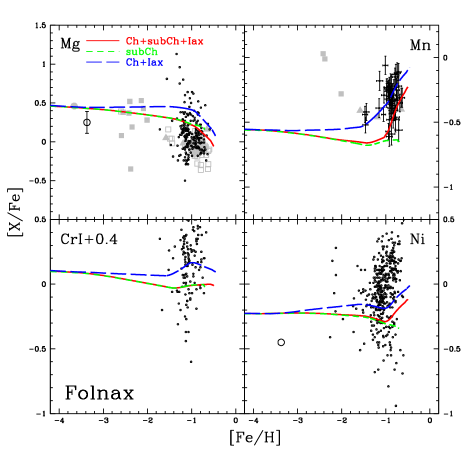
In Figure 20 for Fornax, the observed [Mg/Fe] ratios seem to decrease from [Fe/H] toward higher metallicities, which cannot be reproduced without sub-Ch-mass SNe Ia (blue long-dashed lines). The model with only sub-Ch-mass SNe Ia (green short-dashed lines) cannot reproduce the monotonic increase of [Mn/Fe] from [Fe/H] to , and thus it is necessary to include Ch-mass SNe Ia as well. The model including all three SN Ia channels (red solid lines) are in good agreement not only with [Mg/Fe] but also with [Mn/Fe] ratios. Some of the stars with very high [Mn/Fe] ratios at [Fe/H] might be locally enriched by SNe Iax. The errors of the other iron-peak elements are too large to place further constraints.
Also in Figure 21 for Sculptor, the observed [Mg/Fe] decreases at [Fe/H] , which cannot be reproduced without sub-Ch-mass SNe Ia. The observed [Mn/Fe] ratios are highest around [Fe/H] , and then sharply decreases until [Fe/H] . This is not reproduced with the model including all three SN Ia channels (red solid lines). Obviously, without Ch-mass SNe Ia, [Mn/Fe] monotonically decreases (green dotted lines). The SN Iax is a potentially good source to reproduce this [Mn/Fe] evolution but a higher rate is required. If we multiply the SN Iax rate by a factor of 50, then, it is possible to reproduce the rapid increase of [Mn/Fe] from [Fe/H] to (blue short-dashed lines). Then, in order to reproduce the [Mn/Fe] decrease from [Fe/H] to , it is better to exclude normal Ch-mass SNe Ia (magenta long-dashed lines).
In Figure 22 for Sextans, the observed [Mg/Fe] ratios cannot be reproduced without sub-Ch-mass SNe Ia (green short-dashed lines), but are in reasonably good agreement with the model including all three SN Ia channels (red solid lines). The observed [Mn/Fe] can be better explained if the SN Iax rate is boosted by 10 times (blue long-dashed lines). In Figure 23 for Carina, the observed scatters are larger than the ranges of [X/Fe] evolutions, and the inhomogeneous enrichment should be important (Venn et al., 2012). Nonetheless, the model including all three SN Ia channels (red solid lines) is closer to the observed [Mg/Fe] ratios, while the model without sub-Ch-mass SNe Ia is better for the observed [Mn/Fe] ratios (green short-dashed lines). Similar to Sculptor, with a 50 boosted SN Iax rate (blue long-dashed lines), the model is in good agreement with the observations both for [Mg/Fe] and [Mn/Fe]. In summary, for all four dSphs we have modelled, [Mg/Fe] ratios can be well reproduced with larger enrichment from sub-Ch-mass SNe Ia than in the solar neighborhood. However, with sub-Ch-mass SNe Ia, [Mn/Fe] ratios become too low, which can be solved with additional enrichment from SNe Iax.
4.2 The Mn/Fe–Ni/Fe diagram
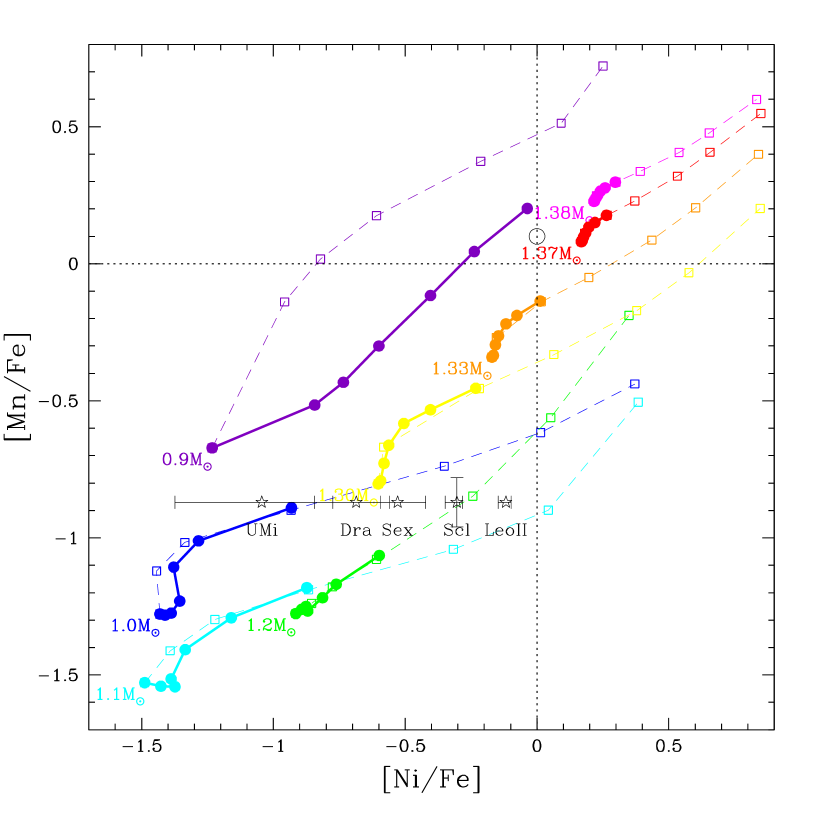
Mn and Ni are the key elements to constrain the enrichment sources in dSphs, and we present a useful diagram in Figure 24. We show our nucleosynthesis yields of near-Ch and sub-Ch mass models for various WD masses and initial metallicities in the diagram of [Mn/Fe] vs [Ni/Fe]. The near-Ch-mass models with different WD masses are calculated with changing central densities of WDs (LN18). The solid lines are for the new yields in this paper, while the dashed lines are for LN18 and LN19 yields with only 22Ne for the component of the initial composition. There is an almost linear trend where both [Mn/Fe] and [Ni/Fe] increase with higher metallicities (see Fig. 10 for the reasons). At a given metallicity, [Mn/Fe] and [Ni/Fe] are higher for less massive WDs in sub-Ch-mass models, but for more massive WDs in near-Ch-mass models.
The dotted lines denote the solar ratios, and the large open circle indicates the average SN Ia yields in the solar neighborhood at [Fe/H] . It is clear that there is no single model that can simultaneously reproduce the Mn/Fe and Ni/Fe ratios, but the Ch-mass model (red solid line) is the closest. sub-Ch-models (purple solid line) with the highest metallicity () is also close, but WDs should be rare because of the low iron mass, and is even rarer at such high metallicities.
The stars with errorbars show the empirical SN Ia yields obtained from the observed evolutionary trends in dSphs. Only Ni/Fe values are estimated for 5 dSphs (Scl, LeoII, Dra, Sex, UMi) (Kirby et al., 2019), and the Mn/Fe value in Scl (de los Reyes et al., 2020) is used for all dSphs in this figure. The low Mn/Fe and Ni/Fe can be better explained with sub-Ch-mass models. Note that, however, the initial composition of the nucleosynthesis calculation is crucial for this argument; with simplified models with only 22Ne, the observational data of dSphs could be well reproduced with low-metallicity sub-Ch-mass SNe Ia, while with more realistic solar-scaled initial composition, the dSphs data can be better reproduced with metal-rich sub-Ch-mass SNe Ia. Normal Ch-mass SNe Ia (, red solid line) clearly cannot reproduce the dSphs data, which is consistent with our GCE results in Figs. 20-23.
5 Conclusions
In our quest to identify the progenitors of SNe Ia, we first update the nucleosynthesis yields both for Ch and sub-Ch mass C+O WDs, for a wide range of metallicity, with our two-dimensional hydrodynamical code (Leung et al., 2015a) and the latest nuclear reaction rates. In particular, new electron capture rates even change the W7 yields significantly for Cr, Mn, and Ni. For the explosion mechanism, deflagration-detonation transition is used for Ch-mass SNe Ia (LN18), while the double detonation model with the carbon detonation triggered by helium detonation is used for sub-Ch-mass SNe Ia (LN19). The helium envelope has to be as thin as ; otherwise, Ti, V, and Cr would be over-produced at [Fe/H] (Fig. 7).
We then include the nucleosynthesis yields in our galactic chemical evolution code (Kobayashi et al., 2000) to predict the evolution of elemental abundances in the solar neighborhood and dSph galaxies. For Ch-mass SNe Ia, the timescale of supernovae is mainly determined from the metallicity-dependent secondary mass range of our single degenerate model (Kobayashi et al. 1998; KN09). For sub-Ch-mass SNe Ia, we use the delay-time distribution estimated from observed supernova rates (Maoz et al., 2014). Including failed supernovae, the star formation histories are assumed in order to reproduce other observational constraints such as the metallicity distribution functions (K19).
In the observations of the solar neighborhood stars, Mn shows an opposite trend to elements, showing an increase toward higher metallicities, which is very well reproduced by Ch-mass SNe Ia, but never by sub-Ch-mass SNe Ia alone. Mn is mainly produced by NSE during deflagrations in Ch-mass WDs where electron captures lower the electron fraction of the incinerated matter, and the double-detonation models for sub-Ch-mass WDs do not have enough material with such a low electron fraction. A small amount of Mn can also be produced by incomplete Si-burning during detonations, depending on the initial metallicity.
Previously, the problem with Ch-mass SNe Ia was the over-production of Ni at high metallicities, which is not observed. In this paper, however, we find that Ni yields of Ch-mass SNe Ia are much lower than in previous works when we use a more realistic initial composition of WDs (i.e., not 22Ne but the solar-scaled composition), which keeps the predicted Ni abundance within the observational scatter. Among Ch-mass models, W7, 2D DDT, and 3D DDT give the elemental abundance ratios within the observational scatters in the solar neighborhood, and our 2D DDT gives the best fit to [Mn/Ni] ratios at [Fe/H] . We also find that both for Ch and sub-Ch mass SNe Ia, the metallicity dependence of Mn and Ni is much weaker than in previous works (Fig. 10).
From the evolutionary trends of elemental abundance ratios in the solar neighborhood, we conclude that the contribution of sub-Ch-mass SNe Ia in chemical enrichment is up to 25%. In dSph galaxies, however, the contribution of sub-Ch-mass SNe Ia seems to be higher than in the solar neighborhood, which is consistent with the low-metallicity inhibition of our single-degenerate scenario for Ch-mass SNe Ia. In dSphs, sub-Ch-mass SNe Ia cause a decrease of [(, Cr, Mn, Ni)/Fe], while so-called SNe Iax can increase Mn and Ni abundances if they are pure deflagrations. Among dSphs, all galaxies we model in this paper (Fornax, Sculptor, Sextans, and Carina) seem to require larger enrichment from sub-Ch-mass SNe Ia than in the solar neighborhood. The observed [Mn/Fe] ratios in Sculptor and Carina may also require additional enrichment from SNe Iax. Future observations of a large number of stars in dSphs would provide more stringent constraints on the progenitor systems and explosion mechanism of SNe Ia.
Within the one-zone GCE framework, it is not possible to reproduce the observed elemental abundance ratios of dSph stars (Figs. 20-23) only by the variations of IMF and SFRs among dSph galaxies. Different SFRs could change the relative contribution between core-collapse supernovae and SNe Ia, and thus could change [Mg/Fe] ratios at a given time (or [Fe/H]). At the same time (or [Fe/H]), [(Cr, Mn, Ni)/Fe] ratios should also be similarly affected by SNe Ia. IMF variation mostly appears as the mass dependence of nucleosynthesis yields of core-collapse supernovae, and thus could change the normalization of abundance ratios. During core-collapse supernova explosions, Cr and Mn are synthesized in incomplete Si-burning regions, while Ni and Fe are synthesized in complete Si-burning regions, and thus [Cr/Mn] and [Ni/Fe] do not vary more than dex (Kobayashi et al., 2006). In this paper we show that the contributions from different sub-types of SNe Ia could explain the variations among [(Mg, Cr, Mn, Ni)/Fe] ratios. Note that, however, in more realistic chemodynamical simulations, selective metal-loss could be caused by supernovae feedback in a shallow potential well, which might explain some of these variations in elemental abundances of dSph stars.
Appendix A GCE Parameter Dependence
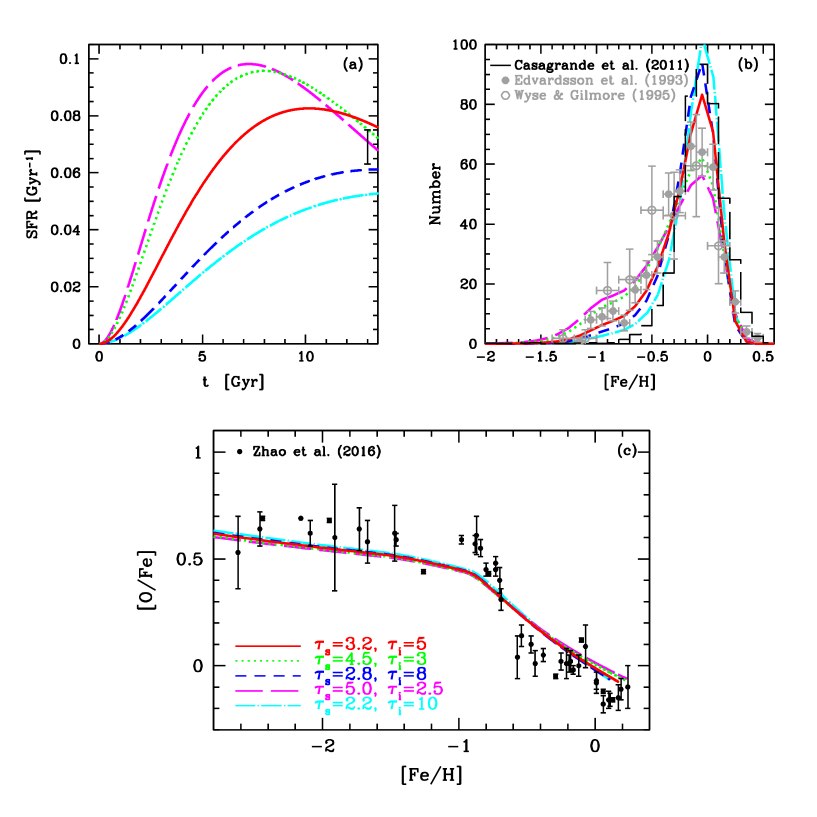
In our solar neighborhood models, there are only two free parameters: the timescales of infall and of star formation in Gyrs (§3.1). Figure 25 shows our chemical evolution models varying the two timescales, including 50% sub-Ch-mass SNe Ia. We choose the set of these timescales in order to match the observed MDF (panel b). The peak [Fe/H] of the MDF provide ‘net’ yields, which corresponds to the average stellar metallicity and depends only on nucleosynthesis yields, outflow (metal loss), and the IMF (Tinsley, 1980). Therefore, can be determined uniquely with a given . A shorter value is required for a longer , which results in more rapid star formation (panel a). However, the evolution of [O/Fe] as a function of [Fe/H] becomes almost identical, independent of the choice of these parameters. This is because the MDF tells how quickly the star formation and chemical enrichment from core-collapse supernovae (which produce O) takes place, relative to the timescale of Ch and sub-Ch mass SNe Ia (which produce Fe). This is why our conclusions using GCE models constrained with MDFs are robust. In this paper, in order to compare the models varying sub-Ch-mass SNe Ia, we choose the models with Gyr in Table 2.
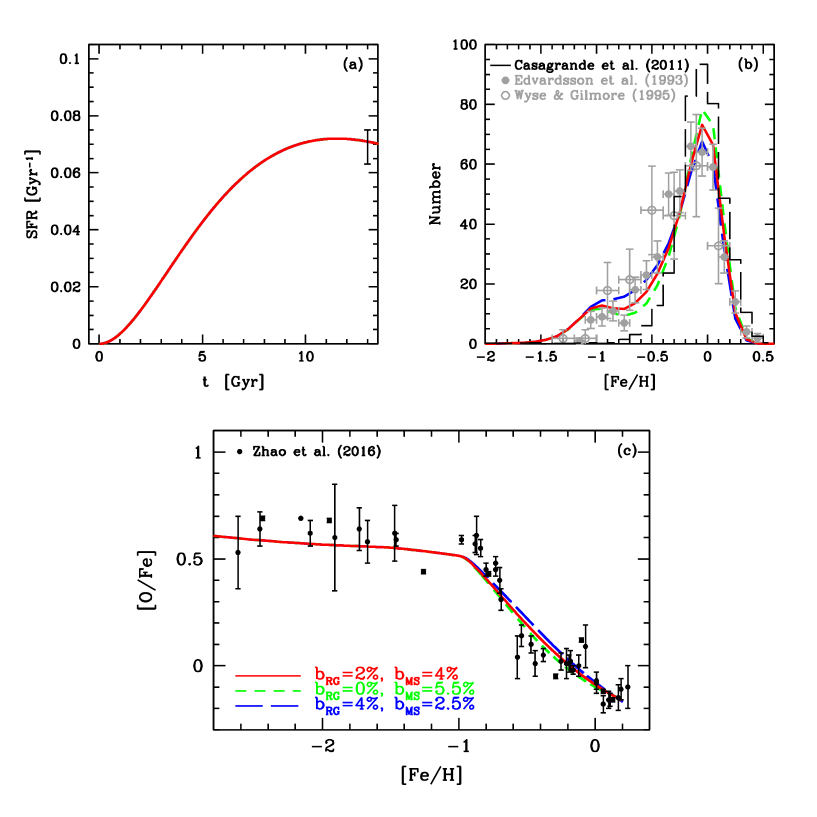
In our Ch-mass SN Ia model, the total number of SNe Ia are given by two binary parameters, and respectively for MS+WD and RG+WD systems (§3.2), and the ratio is theoretically uncertain. Figure 26 shows our chemical evolution models varying the two binary parameters, including Ch-mass SNe Ia only. We first choose the set of these binary parameters in order to reproduce the slope of [O/Fe] ratios against [Fe/H] (panel c). A smaller value (blue long-dashed lines) gives a slightly shallower curve of the [O/Fe]–[Fe/H] relation. Note that since the time-delay is different for MS+WD and RG+WD systems, the total number of SNe Ia exploded by present is not simply the summation of the two numbers. We then choose the fiducial values from the shape of the MDF; a smaller value gives a larger number of metal-poor stars because the iron production becomes slower on the average. The model with and gives the best match with the observed MDF in the solar neighborhood, and thus we use this set for the fiducial model.
For dSph galaxies, the peak [Fe/H] of the MDFs is lower than in the solar neighborhood, which requires outflows, provided the same nucleosynthesis yields and IMF. We consider two forms of outflows: one is the outflow proportional to the SFR, described by a timescale , and the other is the galactic wind set by (§4). The value of is chosen to match the peak [Fe/H] of the MDF (Fig. 19c), while the value of is chosen to reproduce the lack of young stars in the observations (Fig. 19a). Although there are more free parameters, because there are more observational constraints for dSphs than in the solar neighborhood, it is possible to choose the best parameter set. In dSphs, SFRs are estimated not only at present but for the entire history, and from the shape and are constrained. In general, slower star formation (with longer and/or ) leads to too low SFRs at Gyr, while faster star formation (with shorter and/or ) leads to too low SFRs at Gyr.
References
- Bensby et al. (2003) Bensby, T., Feltzing, S., & & Lundström, I. 2003, A&A, 410, 527
- Bensby et al. (2014) Bensby, T., Feltzing, S., & Oey, M. S. 2014, A&A, 562, A71
- Benvenuto et al. (2015) Benvenuto, O. G., Panei, J. A., Nomoto, K., Kitamura, H., & Hachisu, I. 2015, ApJ, 809, L6
- Bergemann & Gehren (2008) Bergemann, M., & Gehren, T. 2008, A&A, 492, 823
- Bildsten et al. (2007) Bildsten, L., Shen, K. J., Weinberg, N. N., & Nelemans, G. 2007, ApJ, 662, L95
- Brown et al. (2019) Brown, J. S., Stanek, K. Z., Holoien, T. W. S., et al. 2019, MNRAS, 484, 3785
- Calder et al. (2007) Calder, A. C., Townsley, D. M., Seitenzahl, I. R., et al. 2007, ApJ, 656, 313
- Carigi et al. (2002) Carigi, L., Hernandez, X., & Gilmore, G. 2002, MNRAS, 334, 117
- Cescutti & Kobayashi (2017) Cescutti, G., & Kobayashi, C. 2017, A&A, 607, 23
- Cescutti et al. (2008) Cescutti, G., Matteucci, F., Lanfranchi, G. A., & McWilliam, A. 2008, A&A, 491, 401
- Childress et al. (2013) Childress, M., Aldering, G., Antilogus, P., et al. 2013, ApJ, 770, 108
- Clement (1993) Clement, M. J. 1993, ApJ, 406, 651
- de Boer et al. (2014) de Boer, T. J. L., Tolstoy, E., Lemasle, B., et al. 2014, A&A, 572, A10
- de Boer et al. (2012a) de Boer, T. J. L., Tolstoy, E., Hill, V., et al. 2012a, A&A, 544, A73
- de Boer et al. (2012b) —. 2012b, A&A, 539, A103
- de los Reyes et al. (2020) de los Reyes, M. A. C., Kirby, E. N., Seitenzahl, I. R., & Shen, K. J. 2020, arXiv e-prints, arXiv:2001.01716
- Feltzing et al. (2007) Feltzing, S., Fohlman, M., & Bensby, T. 2007, A&A, 467, 665
- Fink et al. (2010) Fink, M., Röpke, F. K., Hillebrandt, W., et al. 2010, A&A, 514, A53
- Fink et al. (2014) Fink, M., Kromer, M., Seitenzahl, I. R., et al. 2014, MNRAS, 438, 1762
- Foley et al. (2013) Foley, R. J., Challis, P. J., Chornock, R., et al. 2013, ApJ, 767, 57
- Fulbright (2000) Fulbright, J. P. 2000, AJ, 120, 1841
- Golombek & Niemeyer (2005) Golombek, I., & Niemeyer, J. C. 2005, A&A, 438, 611
- Greggio & Renzini (1983) Greggio, L., & Renzini, A. 1983, A&A, 118, 217
- Hachisu et al. (2008) Hachisu, I., Kato, M., & Nomoto, K. 2008, ApJ, 679, 1390
- Hamuy et al. (1996) Hamuy, M., Phillips, M. M., Suntzeff, N. B., et al. 1996, AJ, 112, 2391
- Hillebrandt & Niemeyer (2000) Hillebrandt, W., & Niemeyer, J. C. 2000, ARA&A, 38, 191
- Hoeflich & Khokhlov (1996) Hoeflich, P., & Khokhlov, A. 1996, ApJ, 457, 500
- Iben & Tutukov (1984) Iben, Jr., I., & Tutukov, A. V. 1984, ApJS, 54, 335
- Iben & Tutukov (1991) —. 1991, ApJ, 370, 615
- Iwamoto et al. (1999) Iwamoto, K., Brachwitz, F., Nomoto, K., et al. 1999, ApJS, 125, 439
- Jablonka et al. (2015) Jablonka, P., North, P., Mashonkina, L., et al. 2015, A&A, 583, A67
- Jordan et al. (2008) Jordan, IV, G. C., Fisher, R. T., Townsley, D. M., et al. 2008, ApJ, 681, 1448
- Jordan et al. (2012) Jordan, IV, G. C., Graziani, C., Fisher, R. T., et al. 2012, ApJ, 759, 53
- Kerzendorf et al. (2009) Kerzendorf, W. E., Schmidt, B. P., Asplund, M., et al. 2009, ApJ, 701, 1665
- Khokhlov (1991) Khokhlov, A. M. 1991, A&A, 245, 114
- Kirby et al. (2019) Kirby, E. N., Xie, J. L., Guo, R., et al. 2019, ApJ, 881, 45
- Kobayashi et al. (2019) Kobayashi, C., Karakas, A. I., & Lugaro, M. 2019, submitted to ApJ (K19)
- Kobayashi et al. (2011) Kobayashi, C., Karakas, A. I., & Umeda, H. 2011, MNRAS, 414, 3231 (K11)
- Kobayashi & Nakasato (2011) Kobayashi, C., & Nakasato, N. 2011, ApJ, 729, 16
- Kobayashi & Nomoto (2009) Kobayashi, C., & Nomoto, K. 2009, ApJ, 707, 1466 (KN09)
- Kobayashi et al. (2015) Kobayashi, C., Nomoto, K., & Hachisu, I. 2015, ApJ, 804, L24
- Kobayashi et al. (2000) Kobayashi, C., Tsujimoto, T., & Nomoto, K. 2000, ApJ, 539, 26
- Kobayashi et al. (1998) Kobayashi, C., Tsujimoto, T., Nomoto, K., Hachisu, I., & Kato, M. 1998, ApJ, 503, L155
- Kobayashi et al. (2006) Kobayashi, C., Umeda, H., Nomoto, K., Tominaga, N., & Ohkubo, T. 2006, ApJ, 653, 1145
- Kromer et al. (2010) Kromer, M., Sim, S. A., Fink, M., et al. 2010, ApJ, 719, 1067
- Lanfranchi et al. (2006) Lanfranchi, G. A., Matteucci, F., & Cescutti, G. 2006, A&A, 453, 67
- Lee et al. (2009) Lee, M. G., Yuk, I.-S., Park, H. S., Harris, J., & Zaritsky, D. 2009, ApJ, 703, 692
- Leung et al. (2015a) Leung, S.-C., Chu, M.-C., & Lin, L.-M. 2015a, MNRAS, 454, 1238
- Leung et al. (2015b) —. 2015b, ApJ, 812, 110
- Leung & Nomoto (2018) Leung, S.-C., & Nomoto, K. 2018, ApJ, 861, 143 (LN18)
- Leung & Nomoto (2019) —. 2019, PASA, 36, e006
- Leung & Nomoto (2020) —. 2020, ApJ, 888, 80 (LN19)
- Leung et al. (2020) Leung, S.-C., Nomoto, K., & Suzuki, T. 2020, ApJ, 889, 34
- Li et al. (2011a) Li, W., Chornock, R., Leaman, J., et al. 2011a, MNRAS, 412, 1473
- Li et al. (2011b) Li, W., Leaman, J., Chornock, R., et al. 2011b, MNRAS, 412, 1441
- Lodders (2010) Lodders, K. 2010, Ap & SS, 16, 379
- Ma et al. (2013) Ma, H., Woosley, S. E., Malone, C. M., Almgren, A., & Bell, J. 2013, ApJ, 771, 58
- Mannucci et al. (2006) Mannucci, F., Della Valle, M., & Panagia, N. 2006, MNRAS, 370, 773
- Maoz et al. (2014) Maoz, D., Mannucci, F., & Nelemans, G. 2014, ARA&A, 52, 107
- Mashonkina et al. (2017) Mashonkina, L., Jablonka, P., Sitnova, T., Pakhomov, Y., & North, P. 2017, A&A, 608, A89
- Matteucci (2001) Matteucci, F. 2001, The Chemical Evolution of the Galaxy (Kluwer Academic Pub.)
- Matteucci & Greggio (1986) Matteucci, F., & Greggio, L. 1986, A&A, 154, 279
- McConnachie (2012) McConnachie, A. 2012, AJ, 144, 4
- McCully et al. (2014) McCully, C., Jha, S. W., Foley, R. J., et al. 2014, Nature, 512, 54
- Meakin et al. (2009) Meakin, C. A., Seitenzahl, I., Townsley, D., et al. 2009, ApJ, 693, 1188
- Meng & Podsiadlowski (2014) Meng, X., & Podsiadlowski, P. 2014, ApJ, 789, L45
- Moe et al. (2019) Moe, M., Kratter, K. M., & Badenes, C. 2019, ApJ, 875, 61
- Niemeyer et al. (1995) Niemeyer, J. C., Hillebrandt, W., & Woosley, S. E. 1995, ApJ, 452, 769
- Nomoto (1982a) Nomoto, K. 1982a, ApJ, 253, 798
- Nomoto (1982b) —. 1982b, ApJ, 257, 780
- Nomoto et al. (1997) Nomoto, K., Iwamoto, K., Nakasato, N., et al. 1997, Nuclear Physics A, 621, 467
- Nomoto et al. (2013) Nomoto, K., Kobayashi, C., & Tominaga, N. 2013, ARA&A, 51, 457
- Nomoto & Leung (2017a) Nomoto, K., & Leung, S.-C. 2017a, Handbook of Supernovae, 483
- Nomoto & Leung (2017b) —. 2017b, Handbook of Supernovae, 1275
- Nomoto & Leung (2018) —. 2018, Space Sci. Rev., 214, 67
- Nomoto et al. (1984) Nomoto, K., Thielemann, F.-K., & Yokoi, K. 1984, ApJ, 286, 644
- Nomoto et al. (2000) Nomoto, K., Umeda, H., Kobayashi, C., et al. 2000, American Institute of Physics Conference Series, 522, 35
- North et al. (2012) North, P., Cescutti, G., Jablonka, P., et al. 2012, A&A, 541, 45
- Nugent et al. (1997) Nugent, P., Baron, E., Branch, D., Fisher, A., & Hauschildt, P. H. 1997, ApJ, 485, 812
- Pagel (1997) Pagel, B. E. J. 1997, Nucleosynthesis and Chemical Evolution of Galaxies (Cambridge Unv. Press)
- Pakmor et al. (2012) Pakmor, R., Kromer2, M., Taubenberger, S., et al. 2012, ApJ, 747, L10
- Perlmutter et al. (1999) Perlmutter, S., et al. 1999, ApJ, 517, 565
- Phillips (1993) Phillips, M. M. 1993, ApJ, 413, L105
- Piro et al. (2014) Piro, A. L., Thompson, T. A., & Kochanek, C. S. 2014, MNRAS, 438, 3456
- Plewa et al. (2004) Plewa, T., Calder, A. C., & Lamb, D. Q. 2004, ApJ, 612, L37
- Reddy & Lambert (2008) Reddy, B. E., & Lambert, D. L. 2008, MNRAS, 391, 95
- Reddy et al. (2006) Reddy, B. E., Lambert, D. L., & Prieto, C. A. 2006, MNRAS, 367, 1329
- Reddy et al. (2003) Reddy, B. E., Tomkin, J., Lambert, D. L., & Prieto, C. A. 2003, MNRAS, 340, 304
- Reggiani et al. (2017) Reggiani, H., Meléndez, J., Kobayashi, C., Karakas, A., & Placco, V. 2017, A&A, 611, 74
- Reinecke et al. (1999a) Reinecke, M., Hillebrandt, W., & Niemeyer, J. C. 1999a, A&A, 347, 739
- Reinecke et al. (2002a) —. 2002a, A&A, 386, 936
- Reinecke et al. (2002b) —. 2002b, A&A, 391, 1167
- Reinecke et al. (1999b) Reinecke, M., Hillebrandt, W., Niemeyer, J. C., Klein, R., & Gloebl, A. 1999b, A&A, 347, 724
- Riess et al. (1998) Riess, A. G., et al. 1998, AJ, 116, 1009
- Romano et al. (2010) Romano, D., Karakas, A. I., Tosi, M., & Matteucci, F. 2010, A&A, 522, 32
- Röpke et al. (2007) Röpke, F. K., Hillebrandt, W., Schmidt, W., et al. 2007, ApJ, 668, 1132
- Röpke & Niemeyer (2007) Röpke, F. K., & Niemeyer, J. C. 2007, A&A, 464, 683
- Röpke et al. (2012) Röpke, F. K., Kromer, M., Seitenzahl, I. R., et al. 2012, ApJ, 750, L19
- Ruiter et al. (2011) Ruiter, A. J., Belczynski, K., Sim, S. A., et al. 2011, MNRAS, 417, 408
- Ruiter et al. (2014) Ruiter, A. J., Belczynski, K., Sim, S. A., Seitenzahl, I. R., & Kwiatkowski, D. 2014, MNRAS, 440, L101
- Scalzo et al. (2014) Scalzo, R. A., Ruiter, A. J., & Sim, S. A. 2014, MNRAS, 445, 2535
- Schmidt et al. (2006) Schmidt, W., Niemeyer, J. C., Hillebrndt, W., & Roepke, F. K. 2006, A&A, 450, 283
- Seitenzahl et al. (2013) Seitenzahl, I. R., Cescutti, G., Roepke, F. K., Ruiter, A. J., & Pakmor, R. 2013, A&A, 559, L4
- Seitenzahl et al. (2016) Seitenzahl, I. R., Kromer, M., Ohlmann, S. T., et al. 2016, A&A, 592, A57
- Shen & Bildsten (2009) Shen, K. J., & Bildsten, L. 2009, ApJ, 699, 1365
- Shen et al. (2018) Shen, K. J., Boubert, D., Gänsicke, B. T., et al. 2018, ApJ, 865, 15
- Sneden et al. (2016) Sneden, C., Cowan, J. J., Kobayashi, C., et al. 2016, ApJ, 817, 53
- Soker (2015) Soker, N. 2015, MNRAS, 450, 1333
- Soker (2019) —. 2019, MNRAS, 2415
- Starkenburg et al. (2010) Starkenburg, E., Hill, V., Tolstoy, E., et al. 2010, A&A, 513, A34
- Sullivan et al. (2006) Sullivan, M., Le Borgne, D., Pritchet, C. J., et al. 2006, ApJ, 648, 868
- Sussman et al. (1994) Sussman, M., Smereka, P., & Osher, S. 1994, J. of Comp. Phys., 114, 146
- Thielemann et al. (1986) Thielemann, F.-K., Nomoto, K., & Yokoi, K. 1986, A&A, 158, 17
- Timmes et al. (1995) Timmes, F., Woosley, S., & Weaver, T. 1995, ApJS, 98, 617
- Timmes (1999) Timmes, F. X. 1999, ApJ, 124, 241
- Timmes et al. (2000) Timmes, F. X., Hoofman, R. D., & Woosley, S. E. 2000, ApJS, 129, 377
- Tinsley (1980) Tinsley, B. M. 1980, Fundamentals of Cosmic Phisics Vol.5, p.287
- Tolstoy et al. (2009) Tolstoy, E., Hill, V., & Tosi, M. 2009, ARA&A, 47, 371
- Travaglio et al. (2004) Travaglio, C., Hillebrandt, W., Reinecke, M., Thielemann, F.-K., et al. 2004, ApJ, 425, 1029
- Umeda et al. (1999) Umeda, H., Nomoto, K., Kobayashi, C., Hachisu, I., & Kato, M. 1999, ApJ, 522, L43
- Venn et al. (2012) Venn, K. A., Shetrone, M. D., Irwin, M. J., et al. 2012, ApJ, 751, 102
- Vincenzo et al. (2014) Vincenzo, F., Matteucci, F., Vattakunnel, S., & Lanfranchi, G. A. 2014, MNRAS, 441, 2815
- Webbink (1984) Webbink, R. F. 1984, ApJ, 277, 355
- Whelan & Iben (1973) Whelan, J., & Iben, Jr., I. 1973, ApJ, 186, 1007
- Woosley et al. (1973) Woosley, S. E., Arnett, W. D., & Clayton, D. D. 1973, ApJS, 26, 231
- Woosley & Kasen (2011) Woosley, S. E., & Kasen, D. 2011, ApJ, 734, 38
- Zahid et al. (2017) Zahid, H. J., Kudritzki, R.-P., Conroy, C., Andrews, B., & Ho, I. T. 2017, ApJ, 847, 18
- Zhao et al. (2016) Zhao, G., Mashonkina, L., Yan, H. L., et al. 2016, ApJ, 833, 225