DEVELOPING THE PHYSICAL UNDERSTANDING OF INTERMEDIATE POLARS:
AN X-RAY STUDY OF TV COL AND V2731 OPH
Abstract
X-rays in intermediate polars (IPs) originate in a compact region near the surface of a magnetic white dwarf (WD) and interact with the complex environment surrounding the emission region. Here we report a case study of two IPs, TV Col and V2731 Oph with selected archival X-ray observations (NuSTAR, Swift, Suzaku, and XMM-Newton). For TV Col, we were successful in simultaneously accounting for the primary X-rays, the secondary X-rays due to Compton scattering and fluorescence, and the effects of local absorbers. In this case, we were able to demonstrate that the shock height is small, based on the high reflection amplitude, and hence the maximum temperature of the post-shock region can be used to derive the WD mass of 0.7350.015 M⊙. Despite the high specific accretion rate required to explain the small shock height, we do not detect any spin modulation in our NuSTAR data, consistent with the modest amount of complex absorption seen spectroscopically. We argue that our results are robust because they are based on the joint temporal-spectral analysis of broadband X-ray data. The spectrum of V2731 Oph is more highly absorbed. Through our analysis of the Suzaku data, we present a spectral model with nitrogen overabundance without the previously claimed soft blackbody that should be further explored. We have been unable to constrain reflection amplitude for V2731 Oph; this and the detection of spin modulation above 10 keV suggest that it may have a tall shock, hence we only derive a lower limit to the mass of its WD ( 0.9 M⊙).
1 Introduction
Intermediate Polars (IPs) are a subgroup of Cataclysmic Variables (CVs) in which a moderately magnetic (105-7 G) white dwarf (WD) accretes matter via Roche-lobe overflow from a companion, usually a low-mass star on or near the main sequence. An accretion disk is usually formed and its inner part is truncated by the magnetic field, which channels the gas in accretion columns towards the magnetic poles of the WD. Strong shocks are formed in the columns, heating up the gas to a high temperature defined in the first order by the depth of gravitational potential well of the WD (T MWD/RWD). The shocked gas subsequently settles onto the WD surface as it is cooled by radiating X-rays and cyclotron emission. Thus the X-ray emission is intrinsically multi-temperature in nature.
Information on the accretion geometry and the white dwarf mass is encoded in the intrinsic emission and its subsequent interaction with its surroundings. The observed radiation in IPs has a significant contribution from X-ray photons that have interacted with the environment, including the stellar surface of the WD itself, the accretion column, the accretion disk, and any circumstellar medium that might exist. Part of the interacting X-rays suffers photoelectric absorption inducing a deficit in the observed X-rays which is more pronounced for softer photons. Another part is reflected and results in excess in the continuum around 10–30 keV as a Compton hump and in fluorescent emission lines, notably the Fe K line at 6.4 keV. The description of both components, absorption and reflection, is necessary for an in-depth understanding of the accretion geometry and characteristics of the intrinsic X-rays, which can also lead to the determination of the WD mass. This task requires wide-bandpass spectroscopy covering both soft and hard X-rays – especially because the partial-covering absorption, expected in IPs due to their complex environment, can have a similar effect on the spectral shape around the Fe K edge as reflection.
The advent of imaging hard X-ray observations using NuSTAR has allowed the detailed investigation of X-ray spectra of IPs, including both absorption and reflection (Mukai et al., 2015). While other recent papers have concentrated on deriving the white dwarf mass using hard X-ray spectroscopy (Shaw et al., 2018), including the effects of tall shocks and small inner radius of the disk (Suleimanov et al., 2019), concerns remain that such investigations can be compromised if inadequate attention is paid to the complex interplay of absorption, reflection, and the intrinsic spectral shape. Here we present our detailed analysis of wide band X-ray spectra of two IPs, TV Col and V2731 Oph, to test the potential degeneracy in spectral analysis results. We also follow Mukai et al. (2015) in analyzing the hard X-ray spin modulation as a method to break the degeneracy.
2 The targets
According to GAIA DR2 parallax, TV Col is at a distance of 513 pc (Gaia Collaboration et al., 2016, 2018). The system has been investigated with many X-ray observatories since its first detection with the Ariel V satellite (2A 0526-328; Cooke et al., 1978). EXOSAT observations ( 2–10 keV) revealed it to be an absorbed hard X-ray emitter with flux modulated at 1,911 s, interpreted as the white dwarf spin period (Schrijver et al., 1987). Based on the energy-dependent pulse profile from EXOSAT data, Norton & Watson (1989) argued for the presence of a complex absorption structure that could be explained by a partial-covering absorption. The spin period was refined to 1,909.72.5 s by Rana et al. (2004) from a nearly sinusoidal modulation by using RXTE, ROSAT, and ASCA data, which also showed the 5.5 h orbital modulation. The authors also claimed the presence of a strong attenuation of the X-rays and signals of partial-covering absorption from hardness ratio variations, and spin modulation decreasing with energy. Broadband RXTE spectra (PCA and HXTE; 3–100 keV) confirmed that TV Col is a hard, thermal, X-ray source presenting a clear Fe K complex (Suleimanov et al., 2005). A single temperature thermal fit of the high energy BAT/Swift (15–195 keV) data resulted in a temperature of T = 21.62.4 keV (Brunschweiger et al., 2009). An analysis of the Suzaku data in the 3–50 keV range, with the inclusion of a partial-covering absorber, indicated a shock temperature T = 45.7 keV in a plasma with a subsolar abundance (0.49 Z☉; Yuasa et al., 2010).
At a distance of 2300 pc (Gaia Collaboration et al., 2016, 2018), V2731 Oph is the most hard X-ray luminous IP known (log L 33.9 for 1 kpc; Pretorius & Mukai, 2014). First investigated in X-rays by de Martino et al. (2008) using XMM-Newton and INTEGRAL observations, V2731 Oph was revealed to have a complex X-ray emission. The investigation in a broadband energy (0.2-100 keV) showed two optically thin plasma components, one cold (T 0.2 keV) and another hot (T 60 keV), with an additional contribution of a hot blackbody (T 90 eV). The intrinsic X-rays suffer the effects of a complex (local) distribution of cold intervening material plus a warm absorber, the latter being suggested by an OVII absorption edge at 0.74 keV. As with TV Col, the pulse modulation for V2731 Oph depends on the energy. In the case of V2731 Oph, the X-rays are spin modulated (128.020.02 s), while UV emission is unmodulated at the 3 level (de Martino et al., 2008).
More recently, both TV Col and V2731 Oph were observed with NuSTAR and investigated in the 3-50 keV band by Hailey et al. (2016) in the context of the X-ray emission of the Galactic center. We revisit those observations for a more in-depth investigation of the X-ray reflection and absorption in these systems, and consequently the characterization of IPs in general. We include in the investigation the Swift/XRT observation carried out during the NuSTAR observation of TV Col, and we show that the inclusion of soft X-rays is crucial to disentangle the effects of absorption and reflection in IP systems. For the same reason, we discuss the constraints imposed by previous XMM-Newton, Suzaku, and Swift observations of V2731 Oph. Also, contrary to the previous study with NuSTAR data (Hailey et al., 2016), we fit the spectra using the cooling flow model that takes into account the ionized Fe K lines.
3 Observations and data reduction
Details of the X-ray observations used in this investigation are given in Table 1. TV Col was observed by the NuSTAR satellite on 2014-05-11 for 49.7 ks (ObsID 30001020002). The system was also simultaneously observed by the Neil Gehrels Swift Observatory (hereafter Swift) for 1.9 ks on 2014-05-12 (ObsID 00080734001). For the first time, we explored the corresponding NuSTAR FPMA/FPMB and Swift/XRT datasets to carry out consistent wide-band spectroscopy from 0.35 to 75 keV. We also investigate five other Swift/XRT observations in order to obtain clues on the spectral variations of the source.
We investigated V2731 Oph using a NuSTAR observation carried out for 50 ks on 2014-05-14 (ObsID 30001019002), for which there is no contemporaneous X-ray observation with another satellite. However, we used archival observations, namely XMM-Newton/EPIC (2005-08-29, by 13.5 ks; ObsID 0302100201), Suzaku (2009-02-16, by 32.9 ks; ObsID 403026010), and the longest Swift (2007-02-23, by 12.8 ks; ObsID 00035086002) observations in order to evaluate the source in soft X-rays and discuss implications to the description of the system.
The data reduction followed standard procedures with the appropriated tools (with HEASOFT-v6.22 for the NuSTAR, Swift, and Suzaku data, and SAS-v16.1.0 for the XMM-Newton data), with the latest calibration files that were available in 2017 November. We use different extraction regions for the NuSTAR modules, FPMA and FPMB, based on their individual images, to accommodate the relative astrometric offset between them.
All spectra from both TV Col and V2731 Oph were binned such that each energy bin contains at least 25 counts, except for the Swift/XRT data of TV Col. For those data a 5 counts limit was adopted as enforcing 25 counts per bin, making Gaussian errors a reasonable approximation, would have meant too few spectral bins for the spectrum to be useful. Spectral fits were done with Xspec v12.9.1m by using the -squared as fit and test statistics, but applying the C statistic for the fit in all cases in which the Swift/XRT data of TV Col were investigated – as it is appropriate to low count per energy bin, following the deviation from Gaussian to Poisson data.
| ObsID | Date | Exposure | |
|---|---|---|---|
| TV Col | |||
| Swift | 00035282001 | 2007-03-30 | 7 ks |
| 00035282002 | 2007-04-23 | 0.8 ks | |
| 00037150002 | 2007-12-21 | 19.4 ks | |
| 00037150003 | 2007-12-27 | 4.6 ks | |
| 00037150005 | 2008-01-14 | 5.3 ks | |
| 00080734001 | 2014-05-12 | 1.9 ks | |
| NuSTAR | 30001020002 | 2014-05-11 | 49.7 ks |
| V2731 Oph | |||
| XMM-Newton | 0302100201 | 2005-08-29 | 13.5 ks |
| Swift | 00035086002 | 2007-02-23 | 12.8 ks |
| Suzaku | 403026010 | 2009-02-16 | 32.9 ks |
| NuSTAR | 30001019002 | 2014-05-14 | 50 ks |
Notes: The covered energy range was 0.3-10 keV for the XMM-Newton, Swift, and Suzaku satelites; for NuSTAR, it was 3–60 keV for TV Col and 3–75 keV (or 20–75 keV; see text) for V2731 Oph.
| Target | Model | Description |
| TV Col | M1 | constant*phabs*[(apec or mkcflow) + gauss] |
| M2 | constant*phabs*[reflect*(apec or mkcflow) + gauss] | |
| M3 | constant*phabs*pwab*[(apec or mkcflow) + gauss] | |
| M4 | constant*phabs*pwab*[reflect*(apec or mkcflow) + gauss] | |
| M5 | constant*phabs* pwabs*[reflect*(apec or mkcflow) + (apec or bbody) + gauss] | |
| V2731 Oph | M6 | constant*phabs*pwab*edge*(apec+mkcflow+bbody+gaussian) |
| M7 | constant*phabs*pwab*edge*(apec+reflect*mkcflow+bbody+gaussian) | |
| M8 | constant*phabs*pwab*edge*(vapec+vmcflow+gaussian) | |
| M9 | constant*phabs*pwab*edge*(vapec+vmcflow+bbody+gaussian+gaussian+gaussian) |
4 X-ray spectroscopy
Throughout this work, we use xspec and models available within it to carry out modeling of XMM-Newton, Swift, Suzaku, and NuSTAR X-ray spectra. Two optically thin thermal models were used – a single temperature apec model and a multi-temperature cooling flow model with mkcflow, also based on apec (with switch parameter equal to 2), which is model M1. In addition, an optically thick blackbody model, bbody, was included as necessary. The abundance table applied in both optically thin thermal models was that of Asplund et al. (2009). The redshift required by construction in the mkcflow model cannot be zero. It was assumed to be 8.586710-8 for TV Col and 5.36710-7 for V2731 Oph, as estimated from the GAIA DR2 distances (513 pc and 2300 pc, respectively; Gaia Collaboration et al., 2016, 2018) and standard cosmological values of xspec. The low temperature of the mkcflow was fixed to the minimum value allowed by the model (T = 80.8 eV).
The interaction of the radiation with matter was accounted by the following models. For the photoelectric absorption by cold matter, we use both the single absorber phabs and the complex absorber pwab (Done & Magdziarz, 1998) components. The usual partial covering absorber models (either the pcfabs multiplicative model or the partcov convolution model combined with any absorption model) represent two lines of sights, one with and one without an intervening absorber. However, the absorption in the pre-shock accretion columns of magnetic CVs requires a model with a continuous distribution of covering fraction as a function of column height. Done & Magdziarz (1998) developed pwab to represent this situation in which the covering fraction is assumed to be a power-law function of the column ( index, from a minimum (NH,min) to a maximum (NH,max) equivalent hydrogen columns). An edge component was used to account for a warm absorber, only necessary in the case of V2731 Oph, associated with the OVII absorption edge at 0.74 keV. The reflect model was applied when investigating reflection of X-rays in the systems – in all cases keeping the (unconstrained) inclination angle () of the reflecting surface equal to the default value in the model, such that cos() is equal to 0.45.
The gauss model was used to describe the 6.4 keV fluorescence iron line, with the line energy (Ec) and width () fixed to 6.4 keV and 0.01 keV, respectively. An energy-independent multiplicative factor, the constant model, was included to account for the cross-calibration uncertainties of the different instruments (namely, the impact on normalization in spectral modeling) when two or more spectra were used in simultaneous fits. constant also helps with source flux variability, since the observations are not all simultaneous. All parameters cited above as being fixed were not constrained when they were allowed to vary freely during the fit.
We notice that the statistical significance for the NuSTAR and Swift simultaneous fit of the TV Col spectra is biased to the NuSTAR data, and thus the visual check was crucial to choose between the models. For TV Col, we started with the simplest model based on single absorption for the two optically thin thermal models cited above (apec and mkcflow; M1), then adding the reflection model (M2), replacing reflection model by the partial-covering model (M3), and finally using both partial-covering and reflection models (M4). In all cases, a Gaussian line at 6.4 keV was added to describe the Fe K fluorescence feature. Some Swift spectra of TV Col presented an excess in soft X-rays which was accounted for as an additional thermal component (M5). Thus, the four initial models are a subgroup of M5 as described in Table 2. For V2731 Oph, the starting point was the result of de Martino et al. (2008) from XMM-Newton and INTEGRAL data. Finally, the model applied to the system was: constant*phabs*pwab*edge*(mkcflow+apec+bbody+ gaussian). Table 2 summarizes the models.
When using the reflect component we extended the energy range over which the model is calculated to 100 keV, because photons with energies above the instrumental coverage can be Compton down-scattered to the energy range which is covered by the instrument (command energies extend high 100.0, in xspec). The output spectrum was limited to 80 keV to speed up the calculation of the spectrum (command xset reflect_max_e 80.0 in xspec).
4.1 TV Col
TV Col is among the brightest hard X-ray IPs (Pretorius & Mukai, 2014). Its X-rays are due to optically-thin, thermal plasma, as supported by the strong Fe K line complex. Because its Galactic latitude of -30.6 deg and distance of 513 pc, most of the interstellar medium (ISM) in its direction is between us and TV Col. However, the system occupies a relatively unobscured part of the Galaxy with an integrated HI column density estimate of only 2.391020 cm-2 (Kalberla et al., 2005). Thus, the X-rays from TV Col are only slightly affected by the ISM and any absorption we measure is due to local contributions. These circumstances make it an ideal target for a detailed study of intrinsic absorbers in the system and therefore of reflection effects. We base our spectral analysis on these two premises and proceed from the simplest model to more complex ones, until satisfactory fits were obtained.
4.1.1 Broad band spectroscopy from simultaneous Swift and NuSTAR observations
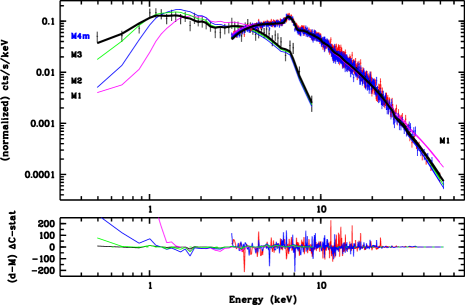
We first investigate TV Col by simultaneously fitting the contemporaneous NuSTAR (FPMA + FPMB; 3–60 keV) and Swift/XRT spectra (0.35–10 keV; Sect. 3) that together covered the wide energy range from 0.35 to 60 keV. The iron line complex (via NuSTAR) and the soft part of the spectrum (via XRT) were always included, which played a key role in disentangling the models.
A thermal model affected by a single absorption component (M1) with either apec and mkcflow does not describe the data. It fails in the description of the continuum, especially at low energies (see Fig. 1). However, this simple model immediately revealed the presence of a complex absorption pattern in the system. This model underestimates the flux for E 1.5 keV appreciably, showing that the absorber with a high column density that is required to explain the spectral shape at higher energies absorbs too many soft photons. Similar results were obtained when including the reflection component (M2). The fit was substantially improved when the reflection component was replaced by the partial-covering model (M3), but still yielded an unacceptable description for energies up to 6 keV, below which the model oscillates between underestimating and overestimating the flux. Finally, the reflection was added to M3, by using the M4 model. This model significantly improved the fit over the whole spectrum, as described below.
| Component | Parameter | Value |
| phabs | NH (1022 cm-2) | 0.0239(∗) |
| pwab | NH,min (1022 cm-2) | 10-7 (∗) |
| NH,max (1022 cm-2) | 10.5 | |
| -0.41 | ||
| reflect | relrefl | 0.88 |
| cos() | 0.45 (∗) | |
| mkcflow | kTlow (keV) | 0.0808 (∗) |
| kTmax (keV) | 31.0 | |
| Z (Z⊙) | 0.49 | |
| redshift | 1.19710-7 (∗) | |
| switch | 2 | |
| /d.o.f. | 0.95/1007 |
Notes: (*) fixed parameter (see text).
Contrary to the first three models, M4 describes the continuum from 0.35 to 60 keV (see Fig. 1). The distinction between the model M4 using apec (M4a) or mkcflow (M4m) comes from the description of the Fe K complex and the surrounding continuum. While the spectral fit from apec substantially underestimates the flux from the ionized Fe XXV line, the mkcflow model describes both it and the Fe XXVI lines and results in a better description of the continuum at 4–8 keV – M4m, the assumed model for TV Col in this work, resulting in of 0.95 for 1007 degrees of freedom.
We present the best-fit parameters for M4m in Table 3. The equivalent hydrogen column from the phabs model is constrained to be less than 3.01020 cm-2 such that any intrinsic absorption would be mitigated by the effect of the dominant local partial-covering absorber. Thus, although the values of all parameters are still mutually consistent at 1, we assume a conservative upper limit by fixing the column value to the total Galactic column in the direction of TV Col (2.391020 cm-2; Kalberla et al., 2005). This procedure improves the determination of the absorption derived from the partial-covering absorption pwab model, resulting in NH,max = 1.051023 cm-2 and = 0.41. The primary source of X-rays is a high-temperature plasma with an abundance of 0.490.04 times the solar values, cooling down from a maximum temperature T of 31.01.1 keV. If we take this as the measurement of the gravitational potential at the surface of the WD, then its mass is 0.7350.015 M⊙ (following Aizu, 1973). Our subsequent analysis justifies this assumption, as we discuss in Section 6.2.
We find that the reflection of the primary X-rays makes a non-negligible contribution to the observed X-rays. According to the best-fit model (M4m), the reflection amplitude is constrained to be 0.88. The reflection accounts for about 16% out of a total unabsorbed flux of 1.3710-10 erg s-1 cm-2 at 0.3–75 keV, increasing to 30% out of a total of 5.310-11 erg s-1 cm-2 at 10–50 keV (and 7.6% out of 7.910-11 erg s-1 cm-2 at 0.3–10 keV). TV Col was observed with a luminosity of 4.31033 erg s-1 at 0.3–75 keV on 2014-05-11/12, and a bolometric X-ray luminosity of (4.60.3)1033 erg s-1.
The NuSTAR data suggest a pronounced fluorescent iron line at 6.4 keV with an equivalent width (EW) estimated in 179 eV. As we show below, this value is significantly higher than that derived for V2731 Oph with the same instrument, even though V2731 Oph is significantly more absorbed than TV Col. Thus, the fluorescent line at least for TV Col seems to have the contribution not only from the absorber but also from the reflector.
4.1.2 Spectral evolution from Swift/XRT observations
We investigated individually five other archival Swift/XRT observations of TV Col in order to evaluate its spectral evolution (Table 1). Thermal models resulted in unconstrained values for the plasma temperature and abundance while they are consistent with those obtained from the simultaneous NuSTAR and Swift observations. Subsequently, we fitted the spectra by assuming the model M4m, keeping fixed the plasma temperature and abundance values of the mkcflow and the parameters of the reflect component to those determined previously from the NuSTAR/Swift observations of 2014-05-11/12, presented in Table 3. We also adopted the same fixed parameter values as done previously for the M4m model. The best-fit spectral parameters are summarized in Table 4.
There is an excess emission below 1 keV that indicates the presence of an additional thermal component for two observations (0003715002 and 0003715005), and which is suspected for two others (00035282001 and 0003715003). Its description suggests that it is more likely due to a cool optically thin plasma (T 0.15 keV) but a blackbody emission (T 0.12 keV) cannot be ruled out. No strong change in spectral shape of TV Col is observed in the first five Swift observations listed in Table 1 but they still exhibit variability in the absorbers and also in the unabsorbed flux at 0.3-10 keV. Remarkably, during the fifth observation, the values increased by 50–100%.
| pwab | apec | bbody | ||||
| Swift/XRT | NH,max | T | T | Funabs,0.3-10keV | /d.o.f. | |
| (ObsID) | (1022 cm-2) | (keV) | (keV) | (10-11 erg cm-2 s-1) | ||
| 00035282001 | 13.8 | -0.41 | … | … | 6.5 | 1.04/398 |
| 12.7 | -0.38 | 0.14 | … | 6.7 | 1.04/396 | |
| 12.7 | -0.38 | … | 0.11 | 6.6 | 1.04/396 | |
| 00035282002 | 13.6 | -0.40 | … | … | 6.9 | 0.88/65 |
| 00037150002 | 17.2 | -0.37 | 0.18 | … | 8.6 | 1.12/689 |
| 15.9 | -0.35 | … | 0.12 | 8.5 | 1.13/689 | |
| 00037150003 | 13.4 | -0.35 | 0.18 | … | 7.8 | 1.01/297 |
| 10.1 | -0.23 | … | 0.15 | 7.9 | 1.01/297 | |
| 00037150005 | 25.3 | -0.43 | 0.15 | … | 11.2 | 1.00/389 |
| 31.7 | -0.45 | … | 0.09 | 11.6 | 1.03/389 | |
Notes: from M4m or M5 (see Table 2).
4.2 V2731 Oph
It is clear from the investigation of TV Col that a simultaneous or at least contemporaneous broadband coverage is essential in describing the effects of both absorption and reflection of X-rays and hence in characterizing the system. Even though V2731 Oph has been observed with high signal-to-noise ratio in soft and hard X-rays, the coverage in both energy bands with different satelites was not contemporaneous.
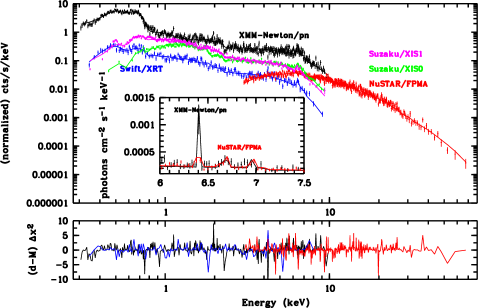
We started by comparing the previous XMM-Newton observation (carried out on 2005-08-29) already reported by de Martino et al. (2008) with the Suzaku (2009-02-16; Yuasa et al., 2010) and the longest Swift (2007-02-23) archival observations of V2731 Oph (Table 1). Those observations were investigated separately and, subsequently, via a joint fit with the 20-75 keV NuSTAR (2014-05-14) spectra. For the purpose of obtaining the based fit of the XMM-Newton data below 10 keV, we fit them jointly with the NuSTAR spectra restricted to 20-75 keV range, allowing us to utilize the parameters that best describe the high energy shape of the spectrum. In this procedure, we ignored the NuSTAR data below 20 keV, because of our suspicion (later confirmed) that there is more spectral variability at low energies. We then proceeded with an investigation of the NuSTAR observations of the system separately using the whole available spectral range (3-75 keV), and then with the Swift and Suzaku spectra, also separately, in all cases fixing the values of the cooling flow component to those derived from the simultaneous fit of the XMM-Newton and the 20-75 keV NuSTAR spectra. Figure 2 shows the spectra.
4.2.1 Clues about the spectral evolution
As reported by de Martino et al. (2008), an XMM-Newton observation revealed a complex X-ray spectrum of V2731 Oph. A good fit required multiple thermal plasma components, with both a cold and another hot optically thin plasmas, and an additional blackbody emission. Once produced, the X-rays are affected by a complex distribution of cold matter and also suffers absorption from a warm material, as indicated by the OVII absorption edge at 0.74 keV. The authors showed that the spectral distribution is well explained using the model wabs*pcfabs*edge(mekal+bbody+mekal+gaussian).
We first applied the model used by de Martino et al. (2008) to carry out a simultaneous fit of the three EPIC XMM-Newton spectra (pn, MOS1, and MOS2) and reproduced their results. However, in the following we adopt the (updated) phabs model instead of wabs, and the (more appropriate) pwab model in the place of pcfabs. Also, we replace the apec describing the hottest thermal component by a mkcflow model, in line with the case of our other target, TV Col, and as it is expected for IPs. Thus, the final model is M6: constant*phabs*pwab*edge*(mkcflow+apec+bbody+ gaussian).
The model M6 describes the XMM-Newton data well, resulting in = 1.05 for 834 degrees of freedom, but the hottest component of the mkcflow component converged to the hard limit of T = 79.9 keV. The coldest component, as for the case of TV Col, was not constrained and therefore fixed to T = 80.8 eV. We added to the fit the NuSTAR spectra limited to the 20–75 keV energy range. This inclusion improves the statistic to = 1.01, for 962 degrees of freedom, while resulting in well-constrained values (Table 5). Starting with the plasma parameters, the temperature derived from the mkcflow model peaks at T = 47.6 keV. A cold (T = 0.17 keV), optically thin plasma component is necessary to account for a substantial part of the 0.5–1.5 keV range which is not described by the mkcflow model even taking its low temperature as a free parameter during the fit. A fit without the cold plasma, but with the low temperature left to vary free, only achieves = 1.15. On the other hand, we confirm that a blackbody component (with T = 0.094 keV) is a good description for the excess emission in soft X-rays, not explained by the optically thin plasma emission. However, this is unphysical for a white dwarf, as it is argued at the end of this section. In terms of absorption, the modeling with pwab resulted in a complex structure with NH,max = 1561022 cm-2 and = -0.68. Although poorly constrained, the lower limit to NH,max is still high: at least 1024 cm-2. The NH,min parameter, unconstrained, was fixed to 1015 cm-2 – the minimum value allowed by the model. The phabs resulted in the equivalent to NH = (3.30.2)1021 cm-2. Such a value is higher than the total Galactic HI column density in the direction of V2731 Oph of about 1.6 cm-2 estimated by Kalberla et al. (2005) but slightly lower than the value of 3.9 cm-2 as derived from the 3D Dust Mapping with Pan-STARRS 1111http://argonaut.skymaps.info/ (Green et al., 2018). The abundance was tied to the apec and mkcflow models, resulting in Z = 0.300.09 Z⊙. This value is consistent with the two values reported by de Martino et al. (2008), of 0.33 Z⊙ from the 0.3-10 keV XMM-Newton EPIC data alone and 0.40Z⊙ when the 20-100 keV INTEGRAL/ISGRI spectrum was also included in the analysis. The energy of the edge component was fixed at 0.74 keV (corresponding to the OVII absorption edge reported by de Martino et al., 2008).
The aim of this analysis is to compare how the spectral energy distribution has evolved when comparing observations carried out at different epochs. In this exercise we explore the longest archival Swift observations and the Suzaku observation of V2731 Oph, verifying the consistency of the spectra with the model used to describe the 0.3–10 keV XMM-Newton plus the 20–75 keV NuSTAR spectra.
We first investigate the Swift/XRT spectrum (ObsID 00035086002). The model and values derived from the joint XMM-Newton and NuSTAR analysis, keeping only the normalization as free parameters, results in an unacceptable description of the Swift spectrum ( = 3.18). The statistic is slightly improved when allowing the parameter of the phabs to vary ( = 2.54). No improvement is obtained by assuming the NH,max parameter of the pwab free during the fit, while it is not constrained, but a significant improvement is obtained allowing the to vary ( = 1.59) – keeping the lower limit for the absorption still fixed. The statistic improves to = 1.14 when the absorption depth of the edge component is also a free parameter. Allowing the plasma temperature of the apec component to also vary improves the fit description ( = 1.06). On the other hand, there is no improvement when allowing the temperature of the bbody component and the high temperature parameter of the mkcflow model to vary. As their values are consistent with those derived from the XMM-Newton plus NuSTAR analysis, we kept them fixed to the corresponding values. The best-fit spectral parameters are summarized in Table 5. The analysis revealed a significant change in the partial-covering absorption and in the temperature of the cold plasma component, while the spectral energy distribution of hard X-rays remained essentially unchanged.
| phabs | pwab1 | edge2 | apec | bbody | mkcflow3 | ||||
| NH | NH,max | abs. depth | T | T | Tmax | 4 | /d.o.f. | ||
| (1022 cm-2) | (0.74 keV) | (keV) | () | ||||||
| Without reflect from M6 and its variants: | |||||||||
| Model: constant*phabs*pwab*edge*(apec + mkcflow + bbody + gaussian) | |||||||||
| XMM + NuSTAR5 | 0.33 | 156 | -0.68 | 1.86 | 0.17 | 0.094 | 47.6 | 0.30 | 1.01/962 |
| Swift | 0.29 | 1566 | -0.75 | 1.46 | 0.64 | 0.0942 | 47.66 | 0.306 | 1.02/150 |
| Model: constant*pwab*edge*(apec + mkcflow + bbody + gaussian) | |||||||||
| Suzaku (XIS0+3) | … | 1566 | -0.78 | 0.72 | 0.25 | 0.21 | 47.66 | 0.306 | 1.06/1663 |
| Suzaku (XIS0+1+3) | … | 1566 | -0.80 | 0.75 | 0.28 | 0.18 | 47.66 | 0.306 | 1.18/2574 |
| Model: constant*pwab*(mkcflow + gaussian) | |||||||||
| NuSTAR (3-75 keV) | … | 753 | -0.68 | … | … | … | 47.66 | 0.306 | 1.00/782 |
| NuSTAR (3-75 keV) | … | 766 | -0.68 | … | … | … | 46.7 | 0.306 | 1.02/781 |
| With reflect from M7 and its variants: | |||||||||
| Model: constant*phabs*pwab*edge*(apec + reflect*mkcflow + bbody + gaussian) | |||||||||
| XMM + NuSTAR5 | 0.36 | 150 | -0.76 | 1.83 | 0.17 | 0.093 | 54.5 | 0.23 | 0.98/962 |
| XMM + NuSTAR5 | 0.36 | 121 | -0.76 | 1.83 | 0.17 | 0.092 | 55.1 | 0.306 | 0.98/963 |
| Swift | 0.59 | 1216 | -0.93 | 1.28 | 0.22 | 0.04 | 55.16 | 0.306 | 0.97/149 |
| Model: constant*pwab*edge*(apec + reflect*mkcflow + bbody + gaussian) | |||||||||
| Suzaku (XIS0+3) | … | 1216 | -0.88 | 0.74 | 0.25 | 0.20 | 55.16 | 0.306 | 1.05/1663 |
| Suzaku (XIS0+1+3) | … | 1216 | -0.90 | 0.74 | 0.30 | 0.18 | 55.16 | 0.306 | 1.18/2574 |
| Model: constant*pwab*(reflect*mkcflow + gaussian) | |||||||||
| NuSTAR (3-75 keV) | … | 848 | -0.82 | … | … | … | 55.16 | 0.306 | 0.96/782 |
| NuSTAR (3-75 keV) | … | 895 | -0.82 | … | … | … | 55.8 | 0.306 | 0.98/781 |
Notes:
1 NH,min = 1015 cm-2;
2 threshold energy equal to 0.74 keV;
3 Tlow = 80.8 eV;
4 tied to the apec, mkcflow, and, when present, reflect components, for all the elements;
5 using only the 20-75 keV NuSTAR spectra (FPMA and FPMB);
6 fixed to the values of the joining XMM + NuSTAR analysis.
For the reflect component, when applied, the reflection scaling factor is equal to 1 and cos() = 0.45.
The lack of coverage for E 3 keV from NuSTAR data does not allow a reliable determination of the flux at 0.3-10 keV.
For the Suzaku analysis, see text.
We extended the same methodology to the Suzaku XIS0, XIS1, and XIS3 spectra. Allowing only the normalization to vary during the fit resulted in = 6.30. As for the XRT spectrum, the description is improved when allowing the absorption column of the phabs ( = 3.70), the parameter of the pwab model ( = 2.34), the absorption depth of the edge component ( = 1.54), and the plasma temperature of the apec component ( = 1.42) to vary. The column derived from the phabs model is virtually equal to zero (NH 1016 cm-2) and unphysical, and this component was removed without impacting the fit. The lower limit of the absorption in the phabs converges to the minimum value when assumed as a free parameter. In contrast with the Swift spectrum, the fit for the Suzaku spectra is statistically improved when the temperature of the bbody component is free during the fit (T 0.18 keV; = 1.22). Table 5 includes the best-fit parameters of the Suzaku observation.
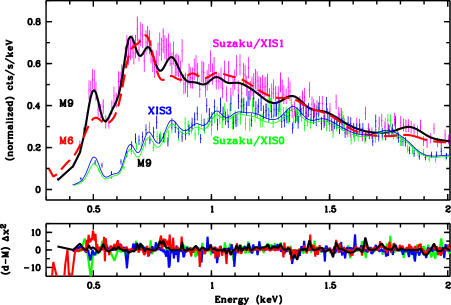
However, there are four significant issues with the fit to the Suzaku data. First, the model underestimates the flux around 0.5 keV and also around 0.8 keV (see Fig. 3). Second, the column density for the phabs component is unrealistically low in comparison with the total Galactic HI column density in this direction ( 1.6 cm-2 according to Kalberla et al. (2005) and 3.9 cm-2 from the 3D Dust Mapping with Pan-STARRS 1, by Green et al. (2018)). Given the large distance to V2731 Oph (at least 2 kpc), we expect that a substantial fraction of this column is between V2731 Oph and the solar system. The fact that NH for the phabs component was negligible when fitting the Suzaku data, while it was higher than the Galactic value in the XMM-Newton and Swift data, points to a possible problem with the fit. Third, the blackbody temperature, already worryingly high in the XMM-Newton fit, is so high to be clearly unphysical for a white dwarf (Williams et al., 1987); we will return to this point in Section 6.1. Fourth, this model does not fit the XIS1 data, which show significant residuals below 0.8 keV, especially around 0.5 keV. While some cross-calibration issues among the XIS units of Suzaku are commonly seen, what we see in V2731 Oph is far beyond residuals seen in other Suzaku observations. One likely explanation is that the model is wrong but nevertheless works well enough, phenomenologically, with XMM-Newton, Swift/XRT and Suzaku XIS0+XIS3 data (Table 5). In fact, the best-fit spectral parameters from the XIS0+XIS3 data with M6 and M7-like models are similar to those obtained from the XIS0+XIS1+XIS3 data. Because the Suzaku/XIS1, using an advanced backside-illuminated (BI) CCD chip, has a relatively high effective area below 0.8 keV and a superior spectral resolution at these energies than those of the other cameras used in this work, some inadequacies of these models becomes readily visible in the XIS1 data. Thus, we explore in the next section an alternative spectral description to V2731 Oph.
| M8 | M8 | M9 | ||
| XMM + NuSTAR1 | Suzaku | Suzaku | ||
| (XIS0+1+3) | (XIS0+1+3) | |||
| phabs | ||||
| NH (1022 cm-2) | 0.14 | 0.004 | 0.29 | |
| pwab2 | ||||
| NH,max (1022 cm-2) | 612 | 374 | 68 | |
| -0.63 | -0.79 | -0.77 | ||
| edge3 | ||||
| Abs. depth (0.74 keV) | 1.49 | 0.52 | 0.97 | |
| vapec | ||||
| T (keV) | 0.23 | 0.50 | 0.49 | |
| vmcflow4 | ||||
| Tmax (keV) | 43.4 | 43.46 | 47.67 | |
| ()5 | 5.8 | 16.9 | 69 | |
| ()5 | 0.5 | 1.3 | 4.6 | |
| ()5 | 0.37 | 0.19 | 0.6 | |
| bbody | ||||
| T (eV) | … | … | 39 | |
| gaussian | ||||
| Line energy (keV) | … | … | 0.58 | |
| Line energy (keV) | … | … | 0.94 | |
| /d.o.f. | 1.08/962 | 1.19/2571 | 1.12/2565 |
Notes: 1 Using only the 20-75 keV NuSTAR spectra (FPMA and FPMB); 2 NH,min = 1015 cm-2; 3 threshold energy equal to 0.74 keV; 4 Tlow = 80.8 eV; 5 tied to the vapec and vmcflow components, and fixed to 0.3 Z⊙ for all other elemental abundance; 6 fixed to the value of the joining XMM + NuSTAR analysis from M8; 7 fixed to the value of the joining XMM + NuSTAR analysis from M6 (in Table 5).
4.2.2 Alternative spectral description
The Suzaku/XIS1 spectrum indicates a more pronounced excess around 0.5 keV than in other spectra, suggesting the presence of an intense NVII L line (see red line from M6, in Fig. 3). In order to check for an overabundance of N, we replace apec by vapec and mkcflow by vmcflow and apply the model without reflection to the Suzaku XIS0, XIS1, and XIS3 spectra, simultaneously – as the variants of the first models that allow the user to set the abundance of the main elements individually. The abundance for the vapec and vmcflow were tied together, allowing ZN to vary freely during the fit but keeping all other elemental abundances equal to 0.30 Z☉. The fit improves significantly with a better description of the soft tail ( from 1.50 to 1.25; yet unnaceptable and not presented). It indicates ZN = 3.2(0.3) Z⊙ while the normalization of the bbody component tends to zero and therefore that such a component would not be necessary anymore. The phabs NH value of 7.41020 cm-2 is consistent with the ISM value while the complex absorption via pwab indicates a NH,max of at least 1024 cm-2 with equal to -0.900.01. Another difference with respect to the values inferred from the other spectra is the substantially lower absorption depth associated with the Oxygen edge, of 0.210.05. We then assumed the O abundance as a free parameter during the fit, and also the Fe which was tied to the Ni abundance. The fit resulted in ZN = 16.9 Z⊙, ZO = 1.3 Z⊙, and ZFe (= ZNi) = 0.190.02 Z⊙, with = 1.19. In this scenario, the absorption from the phabs is less than 1020 cm-2, with the pwab component indicating a NH,max of at least 1024 cm-2 and equal to -0.790.01. The temperature from the vbapec component is T = 0.50 keV (Tmax in vmcflow was kept fixed to 43.4 keV as it was derived from the XMM+NuSTAR for the same model). The improvement with this model comes from a better description of the continuum around 2-5 keV but it degrades the description of the ionized iron lines around 6.7 keV and also fails to explain the X-rays in the 0.55-0.7 keV and 1-1.5 keV energy ranges. The addition of another thermal plasma component did not improve the fit. Again, as in the analysis presented in Section 4.2.1, the phabs results in a unrealistically low column density. The results are summarized in Table 6.
The model has the OVII edge at 0.74 keV, and some of the oxygen ions that absorbed such photons would emit the OVII He-like triplet. We then added a Gaussian line to the variable abundance model and its energy centroid converged to 0.58 keV, the expected value of the OVII triplet. It results in =1.15 but this time not only with low column density from the phabs component but understimating the spectra below 0.6 keV. We them added the bbody component, resulting in a better description. The continuum below 0.6 keV is well described, the column density from phabs converges to 3.81021 cm-2, and the temperature of the bbody, contrary to the model presented in Section 4.2.1, has a low temperature of 28 eV but an unrealistic normalization of 2.5. The is 1.16.
Because of the excess observed around 0.90-0.94 keV, which is consistent with the position of the NeIX triplet, we add a new Gaussian component. The centroid energies of the Gaussian lines converge to 0.580.01 keV and 0.940.01 keV in good agreement with what is expected for the OVII and NeIX He-like triplets, respectively. For the blackbody component, we derive T = 39 eV and normalization of (4.3)10-2. The column from the phabs component is 2.91021 cm-2, consistent with the value expected from the ISM in the light of sight of V2731 Oph. The fit also results in NH,max = 681022 cm-2 and = -0.77 for pwab, and T = 0.490.02 keV for vapec. For the vmcflow component, we kept Tmax = 47.6 keV. Also the fit, with = 1.12, resulted in ZN = 69 Z⊙, ZO = 4.6 Z⊙, and ZFe (= ZNi) = 0.6 Z⊙. The best fit spectral parameters are presented in Table 6. In Fig. 3 we present the fits from M6 and M9 for Suzaku/XIS1 (lines red and black, respectively) where are also presented the XIS0 and XIS3 spectra, and the corresponding results from M9.
We applied the above models to the XMM-Newton EPIC spectra. The fit with variable ZN was found to be statistically worse than the previous description using model M6 (Table 5), with of 1.14. When both ZN and ZO are allowed to be free, without the O absorption edge, results in difficulties to explain the emission from 0.7 to 0.8 keV. Finally, we applied M8 (see Table 2) to the combined XMM-Newton and 20–75 keV NuSTAR data, and obtained a of 1.08 (compared to 1.01 for M6) with similar parameter values when exploring only the XMM-Newton spectra, particularly Tmax, which shows no statistically significant changes. The results are shown in Table 6. The addition of a bbody and the two gaussian line as in M9 do not improve the fit. With a low temperature (T 15 eV), the bbody component converges to a normalization of only 10-19 meaning that such an addition is not supported from the data. A gaussian component at 0.94 keV, as applied to the Suzaku data, is not constrained by the fit and fixing its parameters to the values derived from the Suzaku spectra does not improve the fit. Also, although still in agreement with the XMM-Newton data, the gaussian line around 0.58 keV results in no significant improvement in the fit, still with of 1.08. The values derived from M8 (Table 6) are mutually consistent with those when applying M9 to the 0.3–10 keV XMM-Newton plus the 20-75 keV NuSTAR spectra althought these fits are not shown.
Thus, even though we have not found a completely satisfactory fit to the soft X-ray spectrum, our idea to combine XMM-Newton and 20–75 keV NuSTAR data appears to be valid. First, the spectral energy distribution for hard X-rays in both set of data are mutually consistent – and confirmed from the whole spectral range covered by NuSTAR (Section 4.2.3). The difficulties with either model in describing the Suzaku data with all applied models, and the XMM-Newton spectra with the alternative M8 and M9 models, are limited to the soft end of the spectrum (1 keV). We notice that the elemental abundances derived independently from the Suzaku and XMM-Newton spectra do not converge, both indicate that anomalies are present at least for the N, O, and Fe. Second, the absorbed and unabsorbed 20-75 keV flux differ by less than 5%, showing that the absorption such as detected in the system, even though it is very high, has no significant rule in this spectral region. In addition, the investigation revealed that the luminosity of the source at 20–75 keV during the XMM-Newton observation is 35% less than that observed during the NuSTAR observation, with the unabsorbed flux varying from 2.510-11 erg cm-2 s-1 to 3.910-11 erg cm-2 s-1 (over 9 years). The estimated unabsorbed 20–75 keV flux from both Swift and Suzaku datasets is 2.110-11 erg cm-2 s-1 (over 2 years). Since the soft X-ray complexity is limited to energies below 0.8 keV, we will proceed by returning to the spectral model of de Martino et al. (2008) in the analysis of hard X-ray data, and comment on the soft X-ray complexity in Section 6.1.
4.2.3 Spectroscopy using the full NuSTAR data
The variability of V2731 Oph in X-rays prevents the use of non-contemporaneous campaigns to carry out a simultaneous spectral fit. Therefore, we instead explored the full spectral range covered by NuSTAR (3–75 keV) initially using models M6. As expected, the phabs (that goes virtually to zero; NH = 1013 cm-2), bbody, apec, and edge components do not contribute to the fit and they were removed from the model. A fit that keeps the NH,max of the pwab component fixed to 1561022 cm-2 and the Thot of the mkcflow to 47.6 keV, as derived from the analysis of the XMM-Newton and 20–50 keV NuSTAR spectra, yields = 1.48. Freezing the thermal component to 47.6 keV and allowing the NH,max to vary during the fit results in a good description of the spectra with NH,max = 7531022 cm-2 and = -0.68, for = 1.00 (Table 5). The abundance was kept fixed to 0.30 . Similar values were obtained when allowing the high temperature of the mkcflow varying during the fit. kTmax of 47.6 keV derived from the joint NuSTAR-XMM-Newton fit suggests a WD mass of 0.920.04 M⊙, if the shock temperature reflects the gravitational potential just above the white dwarf surface (following Aizu, 1973).
4.2.4 Investigating the hypothesis of reflection
We move back to the spectral investigation of V2731 Oph to verify how the occurrence of X-ray reflection in the system would affect the results. Contrary to the case of TV Col, it was not possible to constrain the reflection - if it is present - for V2731 Oph. Adding the reflect component and allowing the reflection scaling factor to vary during the fits resulted, systematically, in values greater than 3, which are unrealistic. We froze this value to 1 while keeping cos = 0.45 and see how this conservative assumption would impact the spectral results when reflection is present. In doing this, we followed the same procedure as in the case without reflect: we investigate the EPIC XMM-Newton and the 20–75 keV NuSTAR (FPMA + FPMB) simultaneously, then individually the Swift/XRT, the Suzaku (XIS0+XIS3 and XIS0+XIS1+XIS3), and the 3–75 keV NuSTAR spectra. The results are summarized in Table 5. Tmax of 55.1 keV derived from the joint NuSTAR-XMM-Newton fit (with the abundance fixed to 0.3 Z⊙) suggests a WD mass of 0.99 M⊙, if the shock temperature reflects the gravitational potential just above the white dwarf surface.
The inclusion of reflection does not change at the 1 level the high temperature in the mkcflow model. But this result can be masked by effects of the photoelectric absorption, that is not well constrained from the NuSTAR data alone. A conclusive investigation of reflection in V2731 Oph demands high signal-to-noise spectroscopy covering at least the 0.3–75 keV energy range. High-resolution spectroscopy would play a crucial role in the description of the lines in the soft X-rays and therefore of the continuum and, finally, of the intervening absorber. As for now, our results suggest that 35% of the total flux at 10-50 keV derived for V2731 Oph from the XMM-Newton fit can be due to reflection – similar to the fraction inferred for TV Col, in which the presence of reflection is clear.
We estimate from the XMM-Newton (pn; on 2005/08/29) observation an EW of 14540 eV for the fluorescent iron line at 6.4 keV. The NuSTAR data have a poorer spectral resolution but suggest a lower value on 2014/05/14 of about 69 eV even in a situation in which X-rays seems to be more absorbed than they were during the XMM-Newton observation (Figure 2, inset). Perhaps the low equivalent width suggests that the 6.4 keV line can be accounted only by the absorbers with only a small contribution, if any, from reflection.
4.2.5 X-ray luminosity and mass accretion rate
V2731 Oph is a luminous IP in the X-rays, with a high mass accretion rate. Here we concentrate on results from the XMM-Newton and NuSTAR analyses. From the cooling flow model, we infer directly from its normalization parameter value that the mass accretion rate during the XMM-Newton observation (2005-08-29) was 5.110-9 M⊙ yr-1, with a bolometric luminosity of 4.21035(/2300 pc)2 erg s-1, while the rate during the NuSTAR observation (2014-05-14) was (8.40.2)10-9 M⊙ yr-1. Because NuSTAR does not cover energies below 3 keV, where the system has a significant contribution from additional components which are therefore not constrained from those data, we cannot infer the X-ray bolometric luminosity securely from the NuSTAR data. To carry out a more realistic comparison, we adopt the luminosity in the 3–75 keV band. The values are 4.41034(/2300 pc)2 erg s-1 and 7.81034(/2300 pc)2 erg s-1 for the XMM-Newton and NuSTAR observations, respectively. We estimate that the 3-75 keV luminosity is about 10% less than the bolometric X-ray luminosity.
5 Timing properties from the NuSTAR observations
The NuSTAR observations allowed us to investigate the spin variability of both TV Col and V2731 Oph in hard X-rays. We proceeded from background subtracted light curves in three energy bands: 3–6 keV, 6–10 keV, and 10–30 keV. We chose 60 s bins for TV Col, given its long spin period (resulting in 32 bins per cycle), and 10 s bins for V2731 Oph, given its short period (13 bins per cycle). Since the NuSTAR count rates of these IPs are modest, we neglected deadtime correction, which should be small. We also neglected barycentric correction to simplify the analysis procedure, since we intended to limit our analysis to the times of the NuSTAR observations. We combined the FPMA and FPMB light curves in the three bands and searched for periodic modulations using Fourier power spectrum and the normalization according to Scargle (1982). There is no Swift data at the time of the NuSTAR observation of V2731 Oph, while that contemporaneous with the NuSTAR observation of TV Col is too short to provide conclusive results. As timing analysis of all archival X-ray data is beyond the scope of our work, given that extensive body of work already exists in print, we focus on the NuSTAR observations.

5.1 TV Col
The known spin modulation in TV Col, refined by Rana et al. (2004) as 1,909.72.5 s, was not detected in the NuSTAR data. Figure 4 shows the power spectra up to 8 mHz from the three energy ranges cited above, where the blue vertical dashed lines mark the position of the expected spin frequency. The red lines in the figure mark the highest peak below 10 keV, at 2,976 s, while it is the second in power in the 10–30 keV energy range after the one at very low frequency ( 96,000 s). The peak at 2,976 s is statistically significant if white (i.e., frequency independent) noise is assumed. However, no previous reports of a 3,000 s period exist, so we consider this to be a noise peak.

We show folded light curves with the periods of 1,909 s and 2,976 s in the left and right panels of Fig. 5, respectively. As anticipated from the power spectrum, no modulation is associated with the spin period. Using amplitude/average convention, the relative modulation amplitudes for the 2,976 s peak are 7.5% (3-6 keV), 6.6% (6–10 keV), and 8.4% (10–30 keV), and they can be taken as conservative upper limits of the spin (1,909.7 s) signal. In comparison, Rana et al. (2004) found spin amplitudes of 14% (2-5 keV), 8.5% (5-10 keV), and 6% (10-20 keV). Such modulations would have been detectable in the NuSTAR data below 10 keV, if not above. Thus, we conclude that the X-ray spin amplitude of TV Col is variable and that we caught it in a low spin modulation state. We note that optical observations of TV Col have long indicated variable spin modulation amplitude (see, e.g., Bonnet-Bidaud et al., 1985; Barrett et al., 1988).
5.2 V2731 Oph
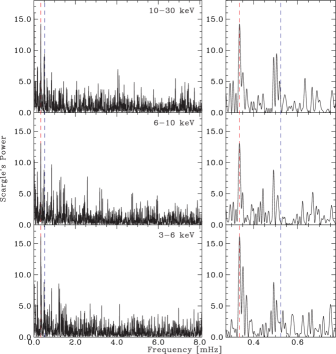
The 128 s spin period of V2731 Oph (de Martino et al., 2008) and the first harmonic are clearly dominant in the periodogram presented in Fig. 6. The left panels show the periodogram over the entire frequency range (0-50 mHz, from the light curves with time bin of 10 s) in the three X-ray energy bands under investigation. All the three left panels have the same Y scale. The right panels show the expanded view around the fundamental frequency (with variable Y scales), where the peak corresponding to the 128 s period is seen and its two 1-cycle-per-spacecaft-orbit aliases. The spin period for V2731 Oph is estimated to be 127.9810.022 s during the NuSTAR observation, consistent with the previous determination in the optical (e.g., 127.999909(49) s; Gänsicke et al., 2005) and X-rays (e.g., 128.020.02 s; de Martino et al., 2008).
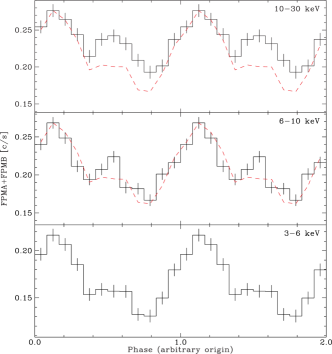
The folded light curves are not quite sinusoidal, although mostly so in the 3–6 keV range (Fig. 7). The red dashed lines in the upper and middle panels are copies of the 3–6 keV spin profile, showing that the main peak remained the same, but a secondary peak is very pronounced in the 10–30 keV range.
6 Discussion
6.1 Soft X-ray complexity of V2731 Oph
The fact that V2731 Oph has a complex X-ray emission was already reported by de Martino et al. (2008). Our analysis show that their model cannot fit the Suzaku XIS1 spectrum. Moreover, a blackbody temperature of 0.21 keV and 0.18 keV, as derived from Suzaku XIS0+XIS3 and XIS0+XIS1+XIS3 spectra, respectively, is clearly unphysical for WD accretion. Considering the local Eddington limit, the highest effective temperature for a black body contribution would be 140 eV for a 1.4 M⊙ WD (Williams et al., 1987), which would imply a shock temperature of 230 keV. Even the 94 eV temperature, as derived from XMM-Newton data and consistent with Swift observations, demand a WD mass of at least 1.2 M⊙, with a high specific accretion rate of about 200 g cm2 s-1 and Tmax 100 keV, and therefore inconsistent with our spectral analysis.
Based on the Suzaku XIS1 spectrum, we have proposed an alternative spectral model that does not include a hot blackbody. For other instruments, but still acceptable for the Suzaku XIS0 and XIS3 spectra, this model results in a poorer fit than was obtained with the model with a blackbody. One plausible explanation is the limitation of the pwab model. While this model is the most sophisticated in terms of reproducing the likely distribution of the number of lines of sight as a function of NH (Done & Magdziarz, 1998), it assumes that the absorber has the solar abundance and is not ionized. If the emitting plasma is overabundant in nitrogen, so, too, should the absorbing plasma, which is not currently taken into account. Moreover, the presence of the OVII edge means the latter assumption is invalid. We currently model this using an edge model in addition to pwab, but we believe this is not the correct model for this situation. In reality, the absorption below 0.78 keV should be less than what pwab predicts, because the complex absorber is ionized and is mostly transparent at these energies. We therefore believe that the current inadequecies of the model is the likely explanation for the imperfect fit. It is likely that high-resolution, high signal-to-noise X-ray spectroscopy combined with an improved grid of models would be needed to see if the alternative spectral description is correct. In the mean time, the abundance of N should be investigated using optical and UV spectroscopy. Nitrogen overabundance has been seen in a number of CVs, both magnetic and non-magnetic (see, e.g., Gänsicke et al., 2003; Froning et al., 2012), and indicates the presence of CNO-processed matter in the system. This, in turn, can be either due to prior nuclear evolution of the donor (Schenker et al., 2002) or pollution by previous nova eruptions (Marks & Sarna, 1998).
For the main purposes of this work, the exercise we carried out by using three sets of X-ray observations for V2731 Oph shows that: (i) while there is no significant evidence of change in the spectral distribution of the hottest thermal component, its luminosity is variable and its X-ray photons suffer the effect of a variable absorbing column, (ii) the hottest thermal component is in agreement with a cooling flow, stratified multi-thermal model which is expected for IP systems, (iii) soft X-ray spectrum is variable in flux and in spectral distribution. Given these findings, we believe our results are robust regarding the complex absorber, reflection amplitude, and the maximum temperature of the post-shock region, despite our imperfect understanding of the soft (1 keV) spectrum of V2731 Oph.
6.2 Clues from the plasma temperature and reflection amplitude
While the maximum temperature (Tmax) derived from the mkcflow model traces the gravitational potential well at the accretion column shock, the reflection amplitude () depends on the shock height () with respect to the stellar surface. Thus, these two spectral signatures allow us to put constraints on the white dwarf mass and on the accretion geometry of the system.
For a point-like emission region placed at height above the white dwarf, with expressed as a fraction of the stellar radius, the stellar surface covers the solid angle (see Figure 2 of Tsujimoto et al., 2018):
| (1) |
The reflection amplitude is defined as the solid angle covered by the reflector as seen from the emitter in such a way that it is 1.0 when the solid angle subtended is 2 (half the sky). This condition corresponds to = 0 in Eq. 1, and therefore /2. Thus, a reflection amplitude of 0.880.13 as derived from the spectral fit of TV Col (see Table 3) requires of order 0.7% of the white dwarf radius. Such a small shock height implies that Tmax traces the gravitational potential well virtually at the WD surface and therefore the white dwarf mass determined from our spectral fit (0.7350.015 M⊙) does not require additional corrections.
On the other hand, as first derived by Aizu (1973), the geometrical parameter is physically determined by the post-shock cooling time (), that defines the remaining time for the accreted material to settle onto the white dwarf. Higher density () in the accretion column accelerates the cooling ( 1/), resulting in smaller . Thus, is a function of white dwarf mass and specific (or per unit area) accretion rate (g s-1 cm-2).
Following Aizu (1973), the low derived from the reflection in TV Col ( 0.7%) is due to a high specific accretion rate, of order 15 g s-1 cm-2. Comparing the specific accretion rate with the mass accretion rate derived from the mkcflow model, of (3.80.2)10-10 M⊙ yr-1, we estimate that the fractional area over which accretion happens () is of about 0.02% for TV Col: a relatively high specific accretion rate, and a small accretion spot. The best estimate for the spot size in IPs is that for XY Ari, for which Hellier (1997) used the X-ray eclipses to arrive at an estimate of 0.002. If reliable determination of reflection amplitude becomes routine, there is a potential to repeat the kind of analysis we have performed for TV Col to estimate the spot sizes of IPs. This might allow future researchers to perform a statistical study against other system parameters.
On the other hand, we did not detect an unambiguous sign of reflection in the NuSTAR observation of V2731 Oph. Thus we are unable to derive the specific accretion rate or the shock height in V2731 Oph from its X-ray spectrum.
6.3 Additional constraints from the photometry
X-ray spin modulation of IPs is usually due to complex absorption (Norton & Watson, 1989), which is not expected to produce significant spin modulation above 10 keV. Therefore, when spin modulation is seen above 10 keV, a geometrical explanation is required. A likely scenario is that non-negligible shock height ( 0.1) results in both poles being visible over a range of viewing geometry (de Martino et al., 2001).
The lack of detectable spin modulation in the NuSTAR data on TV Col can be explained as follows. First, we do not expect geometrical spin modulation because the shock in TV Col is very close to the stellar surface (0.7%). Secondly, the maximum energy at which we can detect X-ray spin modulation due to complex absorption) depends on NH,max. Our spectral fit shows NH,max of only 1023 cm-2 during the NuSTAR observation, so the effects of complex absorption are mostly confined to photon energy below 3 keV. The complex absorption appears to be variable from epoch to epoch according to our analysis of the Swift data, which also extends to lower energies: however, these Swift data do not have sufficient spin phase coverage and our timing analysis was inconclusive. We expect that X-ray observations which showed spin modulations above 3 keV were obtained when TV Col was in a higher NH,max state.
In V2731 Oph, NH,max is high, so the low energy ( 10 keV) spin modulation may well have a contribution due to complex absorption. Nevertheless, the clear detection of the spin period above 10 keV (Fig. 6) implies a strong geometrical component to the X-ray spin modulation in this IP. This indicates a non-negligible shock height for V2731 Oph. We thus expect a low reflection amplitude, which can explain the absence of evidence of reflection in the X-ray spectrum of the system. In that sense, V2731 Oph appears similar to V709 Cas (Mukai et al., 2015).
At first sight, it might seem surprising that a system as luminous V2731 Oph should have a non-negligible shock height . We suggest two factors which may explain the large . First, recall that is determined, not by the total accretion rate, but by the specific accretion rate. We can explain the non-negligible by invoking a large . A major factor controlling is the pinching by the dipole magnetic field (B ), the degree of which is determined by the magnetospheric radius. If we assume approximate spin equilibrium, V2731 Oph (Pspin = 128 s) must have a much smaller magnetosphere than TV Col (Pspin = 1,911 s), so dipole pinching is much less effective. Secondly, V2731 Oph may well have a massive WD. The free-fall velocity is higher, which reduces the post-shock density, which reduces the X-ray cooling efficiency. Since the post-shock temperature is also high, this increases , and hence .
6.4 Our targets and the standard evolutionary scenario
The mass transfer in CVs with orbital period less than 10 hrs are driven by angular momentum loss, and is expected to be of order 3-510-9 M⊙ year-1 for a 5.5 hr period CV, as appropriate for TV Col (Knigge et al., 2011). Both the normalization of the mkcflow model and the bolometric X-ray luminosity of TV Col suggests a lower accretion rate, unless a large amount of transferred material is not accreted and is lost, perhaps propellered out of the system, therefore reducing the expected accretion rate and consequent X-ray emission. The observed X-ray luminosity is typical of IPs (Schwope, 2018).
This standard evolutionary scenario does not apply to V2731 Oph, and so we have no quantitative prediction for the mass transfer rate in this system. The BAT band luminosity of V2731 Oph is already log LX(erg s-1) = 34.6 (Schwope, 2018), the highest of all IPs, and the uncertain evolutionary driver must be capable of sustaining a high mass transfer rate. The overabundance of N, if confirmed, would place V2731 Oph among the subset of CVs known to be overabundant in N (see, e.g., Gänsicke et al., 2003). This would imply that the donor matter has been CNO-processed: the secondary of V2731 Oph may be evolved in the normal (single star evolution) sense, or it may indicate that this is a post thermal-timescale mass-transfer (TTMT) system (Schenker et al., 2002).
6.5 White dwarf masses
We have shown that both a complex absorber and reflection are necessary to fit the wide-band X-ray spectrum of TV Col. The combined NuSTAR+Swift data allowed us to constrain both, as well as the maximum temperature of the X-ray emitting plasma. The high reflection amplitude supporting a small shock height and the long spin period indicate that the inner radius of the truncated disk is large. Taking the maximum plasma temperature as a measure of the gravitational potential just above the WD surface, we determine the WD mass to be 0.7350.015 M⊙. Our value is somewhat smaller than, but consistent with, the previous NuSTAR measurement by Hailey et al. (2016).
On the other hand, we were unable to constrain the reflection amplitude in V2731 Oph. This has several effects on the mass measurement. First, our derived values for depends on whether we include reflection (with amplitude fixed to 1.0) or not. Also, our values, particularly the case without reflection (0.920.04 M⊙) is significantly lower than what Hailey et al. (2016) derived; the reason for this is unclear. Moreover, we were unable to constrain the shock height, but the high energy (10 keV) spin modulation suggests it is not small. Because of this, and because V2731 Oph is a fast rotator that probably requires correction for small inner radius of the disk, we consider our numbers to be lower limits for the true WD mass in this system.
7 Summary
We have combined analyses of broad-band X-ray spectroscopy and photometry, as in (Mukai et al., 2015), to study two IPs, TV Col and V2731 Oph, already analyzed by Hailey et al. (2016). We have gained valuable insights into the geometry and physics of accretion in these systems.
-
1.
TV Col:
-
•
Complex absorption, such as described by the pwab model is required to obtain a good spectral fit.
-
•
Reflection is also clearly detected, with an amplitude of 0.880.13, indicating a small shock height caused by high specific accretion rate.
-
•
We do not detect the spin modulation in the NuSTAR data, showing that the amplitude of the spin modulation can vary over different epochs, as is also seen in at optical wavelengths.
-
•
The white dwarf mass is determined to be 0.7350.015 M⊙.
-
•
-
2.
V2731 Oph:
-
•
The X-ray spectrum is affected by a complex and variable local absorption, with a much higher NH than for TV Col.
-
•
The spectral model, which includes a hot blackbody, used to fit the XMM-Newton data does not work for Suzaku XIS1 data. We have tentatively proposed an alternative model without such a blackbody, but with an overabundance of nitrogen.
-
•
The NuSTAR data did not allow us to constrain the reflection amplitude. The detection of high energy (10 keV) spin modulation suggests a tall shock.
-
•
A combination of clues points to a high mass white dwarf in V2731 Oph.
-
•
References
- Aizu (1973) Aizu, K. 1973, Progress of Theoretical Physics, 49, 1184
- Asplund et al. (2009) Asplund, M., Grevesse, N., Sauval, A. J., & Scott, P. 2009, ARA&A, 47, 481
- Barrett et al. (1988) Barrett, P., O’Donoghue, D., & Warner, B. 1988, MNRAS, 233, 759
- Bonnet-Bidaud et al. (1985) Bonnet-Bidaud, J. M., Motch, C., & Mouchet, M. 1985, A&A, 143, 313
- Brunschweiger et al. (2009) Brunschweiger, J., Greiner, J., Ajello, M., & Osborne, J. 2009, A&A, 496, 121
- Cooke et al. (1978) Cooke, B. A., Ricketts, M. J., Maccacaro, T., et al. 1978, MNRAS, 182, 489
- de Martino et al. (2001) de Martino, D., Matt, G., Mukai, K., et al. 2001, A&A, 377, 499
- de Martino et al. (2008) —. 2008, A&A, 481, 149
- Done & Magdziarz (1998) Done, C., & Magdziarz, P. 1998, MNRAS, 298, 737
- Froning et al. (2012) Froning, C. S., Long, K. S., Gänsicke, B., & Szkody, P. 2012, ApJS, 199, 7
- Gaia Collaboration et al. (2018) Gaia Collaboration, Brown, A. G. A., Vallenari, A., et al. 2018, ArXiv e-prints, arXiv:1804.09365
- Gaia Collaboration et al. (2016) Gaia Collaboration, Prusti, T., de Bruijne, J. H. J., et al. 2016, A&A, 595, A1
- Gänsicke et al. (2003) Gänsicke, B. T., Szkody, P., de Martino, D., et al. 2003, ApJ, 594, 443
- Gänsicke et al. (2005) Gänsicke, B. T., Marsh, T. R., Edge, A., et al. 2005, MNRAS, 361, 141
- Green et al. (2018) Green, G. M., Schlafly, E. F., Finkbeiner, D., et al. 2018, MNRAS, 478, 651
- Hailey et al. (2016) Hailey, C. J., Mori, K., Perez, K., et al. 2016, ApJ, 826, 160
- Hellier (1997) Hellier, C. 1997, MNRAS, 291, 71
- Kalberla et al. (2005) Kalberla, P. M. W., Burton, W. B., Hartmann, D., et al. 2005, A&A, 440, 775
- Knigge et al. (2011) Knigge, C., Baraffe, I., & Patterson, J. 2011, ApJS, 194, 28
- Marks & Sarna (1998) Marks, P. B., & Sarna, M. J. 1998, MNRAS, 301, 699
- Mukai et al. (2015) Mukai, K., Rana, V., Bernardini, F., & de Martino, D. 2015, ApJ, 807, L30
- Norton & Watson (1989) Norton, A. J., & Watson, M. G. 1989, MNRAS, 237, 853
- Pretorius & Mukai (2014) Pretorius, M. L., & Mukai, K. 2014, MNRAS, 442, 2580
- Rana et al. (2004) Rana, V. R., Singh, K. P., Schlegel, E. M., & Barrett, P. 2004, AJ, 127, 489
- Scargle (1982) Scargle, J. D. 1982, ApJ, 263, 835
- Schenker et al. (2002) Schenker, K., King, A. R., Kolb, U., Wynn, G. A., & Zhang, Z. 2002, MNRAS, 337, 1105
- Schrijver et al. (1987) Schrijver, J., Brinkman, A. C., & van der Woerd, H. 1987, Ap&SS, 130, 261
- Schwope (2018) Schwope, A. D. 2018, A&A, 619, A62
- Shaw et al. (2018) Shaw, A. W., Heinke, C. O., Mukai, K., et al. 2018, MNRAS, 476, 554
- Suleimanov et al. (2005) Suleimanov, V., Revnivtsev, M., & Ritter, H. 2005, A&A, 435, 191
- Suleimanov et al. (2019) Suleimanov, V. F., Doroshenko, V., & Werner, K. 2019, MNRAS, 482, 3622
- Tsujimoto et al. (2018) Tsujimoto, M., Morihana, K., Hayashi, T., & Kitaguchi, T. 2018, PASJ, 70, 109
- Williams et al. (1987) Williams, G. A., King, A. R., & Brooker, J. R. E. 1987, MNRAS, 226, 725
- Yuasa et al. (2010) Yuasa, T., Nakazawa, K., Makishima, K., et al. 2010, A&A, 520, A25