Connection between optical and radio/millimeter flares in blazar OJ287
Abstract
Context. Blazar OJ287 is a unique source in which optical outbursts with double-peak structure have been observed quasi-periodically with a cycle of 12 yr. It may be one of the best candidates for searching supermassive black hole binaries.
Aims. We investigate the connection between its optical and radio/millimeter variations and interpret the emissions in terms of relativistic jet models.
Methods. Specifically, we make a detailed analysis and model simulation of the optical and radio/mm light curves for the outburst during the period of 1995.8–1996.1.
Results. It is shown that the multi-wavelength light-curves at optical V-band and radio/mm wavelengths (37, 22, 14.5 and 8 GHz) can be decomposed into 36 individual elementary flares, each of which have symmetric profiles.
Conclusions. The elementary flares can be understood to be produced through lighthouse effect due to the helical motion of corresponding superluminal optical/radio knots. Helical motion of superluminal knots should be prevailing in the inner regions of its relativistic jet formed in the magnetosphere of the putative supermassive black hole/accretion disk system. A comprehensive and compatible framework for understanding the entire phenomena in OJ287 is described.
Key Words.:
galaxies: active – galaxies: jets – galaxies: nuclei – galaxies : individual OJ2871 Introduction
OJ287 (z=0.306) is one of the best studied and most prominent blazars.
It has shown large amplitude and rapid variability at all wavelengths
from radio, optical through to -rays with various time-scales
from hours to years. A large amount of observations in radio, infrared,
optical, ultraviolet, X-rays and -rays have been carried out
to investigate the
nature of the phenomena in this source (e.g., Usher Us79 (1979),
Holmes et al. Holm84 (1984), Brown et al. Bro89 (1989), Hartman et al.
Har99 (1999), Sillanpää et al. Si88 (1988), 1996a ,
1996b , Takalo 1996a , Takalo et al. 1996b ,
Allen et al. Allen82 (1982), Aller et al. Al94 (1994), Al14 (2014),
Tateyama et al. Ta99 (1999), Valtaoja et al. Val20 (2000),
Qian QiXiv18 (2018), Britzen et al. Br18 (2018), Hodgson et al.
Hod17 (2017), Valtonen et al. Va17 (2017), Cohen Co17 (2017), Kushwaha
et al. 2018a , 2018b , Gupta et al. Gu16 (2016),
Agudo et al. Ag12 (2012), Ackermann et al. Ac11 (2011), Neronov & Vovk
Ne11 (2011)).
With the distinct properties common for generic blazars,
the most remarkable characteristic of OJ287 is the quasi-periodic
variability in
optical wavebands. The optical light curve
recorded since 1890s reveals quasi-periodic outbursts
with a cycle of 12 yr (Sillanpää et al. Si88 (1988)).
Up to now four quasi-periodic outbursts with double-peak structure
have been observed in 1971–73, 1983–84, 1994–95 and 2005–2007.
The first flare of the fifth quasi-periodic outburst was observed
in December 2015 and the second one has been predicted to appear soon
(Valtonen et al. Va18 (2018), Dey et al. De18 (2018)).
The quasi-periodicity in the optical outbursts and their double structure
are widely believed to be related to the orbital motion of
the putative black hole binary in its nucleus. The very complex
variations in flux density and polarization at all
wavelengths from radio to -rays are mostly believed to occur in
the relativistic jet of the primary hole (or both jets produced
by the primary and secondary holes; Qian QiXiv18 (2018)).
Various theoretical models (or scenarios) have been proposed to interpret
the whole phenomena observed in OJ287 (for details, referring to the
discussions in Villforth et al. Vil10 (2010) and Qian QiXiv18 (2018),
Qi15 (2015)). On the whole, these models can be divided into two
categories: disk-impact models and relativistic jet models, both involving
a supermassive black hole binary in the nucleus of OJ287.
-
•
The disk-impact model originally proposed by Lehto & Valtonen (Le96 (1996)) has been steadily improved (Valtonen Va07 (2007), Valtonen et al. Va06 (2006), Va18 (2018), Dey et al. De18 (2018)) to interpret the double-peak structure of the quasi-periodic optical outbursts. It suggests that the first major flares of the quasi-periodic outbursts are produced by the secondary hole penetrating into the accretion disk of the primary hole and are thus bremsstrahlung in origin. In the case of highly eccentric orbital motion with large inclination, two impacts would occur per pericenter passage, causing the double-peak structure. The follow-up flares, as well as the non-periodic outbursts occurred during the intervening periods are suggested to be related to the enhanced accretion events induced by the disk-impacts and tidal interaction between the secondary hole and the primary disk. This model requires a high inclination angle ( – ) and a large orbit eccentricity ( 0.66) and a strong constraint on the total mass of the binary, reaching with a mass ratio m/M0.007. This model has been elaborated to make accurate timing of the quasi-periodic outbursts.
The cavity-accretion flare model proposed by Tanaka (Tan13 (2013)) is another type of disk-impact model, which assumes that the primary hole and the secondary hole having comparable masses and are in near-coplanar orbital motion. Hydrodynamic/magnetohydrodynamic (HD/MHD) simulations for such binaries surrounded by circumbinary disks have shown that cavity-accretion processes would create two gas-flow streams impacting onto the disks of the black holes per pericenter passages, possibly causing the double-peak structure of the quasi-periodic outbursts. This model also suggest that the gas-flow impacts produce thermal outbursts, but it is not able to make accurate timing of the quasi-periodic outbursts. The follow-up flares and the non-periodic outbursts during the intervening periods were not investigated in this model. -
•
It is widely suggested that blazars are extragalactic sources with relativistic jets pointing close to our line of sight, and they are the brightest and most violently variable active galactic nuclei in radio, optical through to -rays. Relativistic jet models have been applied to interpret the optical and radio variability behavior in OJ287 by many authors (e.g., Sillanpää et al. 1996a , Valtaoja et al. Val20 (2000), Villata et al. Villa98 (1998), Villforth et al. Vil10 (2010), Britzen et al. Br18 (2018), Qian Qi15 (2015), QiXiv18 (2018)).
Recently, Qian (QiXiv19 (2019)) has tentatively proposed an alternative jet model to understand the entire phenomena in OJ287, which is based on the optical multi-wavelength and -ray observations performed for OJ287 (e.g., Kushwaha et el. 2018a , 2018b ), combining with the distinct features previously found in the optical and radio (flux and polarization) variations (e.g, Sillanpää et al. 1996a , Valtaoja et al. Val20 (2000), Usher Us79 (1979), Holmes et al. Holm84 (1984), Kikuchi et al. Ki88 (1988), D’Arcangelo et al. Da09 (2009), Kushwaha et al. 2018a , Britzen et al. Br18 (2018), Qian QiXiv18 (2018)).
The main emission properties are explained, including the following aspects (for details, referring to Qian QiXiv19 (2019)). (1) The -ray flare observed in December/2015 was observed to be closely associated with the optical outburst. The simultaneity between the optical and -ray flares implies that the optical outburst in December/2015 (peaking at 2015.92) should be produced in the jet and a nonthermal (synchrotron) flare; (2) The optical multi-wavelength observations (Kushwaha et al. 2018a ) have shown that the December/2015 optical outburst has its temporal and spectral variability behavior very similar to that of the synchrotron outburst in March/2016. The two outbursts form a pair of flaring events with a time-interval of 90 days. Thus the December/2015 outburst must be a synchrotron flare and can not be a thermal flare as claimed in the disk-impact model; (3) Previous observations have already shown that the major optical outbursts can be decomposed into a number of elementary flares, each having a symmetric flux density profile. Symmetry in the light-curves has been recognized as a distinct feature of the optical flares in OJ287; (4) The simultaneous variations in radio/mm and optical bands without measurable time-delays (1-2 days) and the similarity between the envelopes of optical and radio/mm outbursts imply that these correlations can only be interpreted in terms of lighthouse effect due to the helical motion of superluminal optical/radio knots; (5) Under the lighthouse scenario the December/2015 and the March/2016 outbursts can be interpreted as produced when the superluminal knot (shock) propagates along the helical magnetic field in a perfect-collimation zone through two revolutions.
As shown in Qian (QiXiv19 (2019))
The light-curves of six quasi-periodic optical outbursts (in 1983.0, 1984.1,
1994.8, 2005.8, 2007.7 and 2015.9)
and a few individual non-periodic outbursts (in 1993.9, 1994.2 and 2016.98)
have been model-simulated and well interpreted in terms of the lighthouse
model. We suggest that all these outbursts are
synchrotron flares produced in the relativistic jet.
While this relativistic jet model can well explain the light-curves of both
the periodic and non-periodic outbursts,111Relativistic jet models
are usually applied to explain the flaring properties in generic blazars
from radio, optical (flux and polarization) through to -rays.
it needs to invoke the dual-stream
flow accretion mechanism to interpret the double-structure of the
quasi-periodic outbursts as in the cavity-accretion flare model by Tanaka
(Tan13 (2013)). In principle, this is possible as some MHD simulations
have demonstrated (e.g., Artymovicz & Lubow Ar96 (1996),
Artymoviz Ar98 (1998), Hayasaki et al. Ha08 (2008), Shi et al.
Sh12 (2012), D’Orazio et al. Do13 (2013)), but detailed modeling is
imperatively required, especially for the timing of the optical outbursts
(the 12 yr quasi-periodicity and the 1-2 yr
time-separation of the double-peak structure). Simulations of the
accretion events causing all the outbursts during the whole 12 yr period
(or even during the 120 yr period) may be also important.
We point out that the relativistic jet models distinguish from the
disk-impact models mainly in two aspects.
(1) In the relativistic jet models all the optical outbursts (both
quasi-periodic and non-periodic) originate from synchrotron process and
thus are related to its primary-hole jet (or to both jets of the primary
and secondary holes, Qian QiXiv18 (2018)).
In the disk-impact models the primary quasi-periodic optical
outbursts are assumed to
originate from bremsstrahlung process due to the secondary hole impacting
onto the primary-hole disk, while the follow-up and non-periodic
outbursts are assumed to originate from synchrotron process,
related to its primary hole jet.
(2) Therefore, in the relativistic jet models, the energetics of the
optical outbursts is physically
unified: the time-scale of all the optical outbursts is
compressed and their flux density boosted by Doppler effects in the same
way. The light-curve of all the optical outbursts can be considered
in a unified
physical frame. In contrast, the disk-impact models require dual-energetics
: the synchrotron outbursts are Doppler boosted while the impact
(thermal) outbursts are not. This implies that one needs different
scales (both time-scale and flux density scale) to describe their
energy content and scaling of light-curve for the two types of outbursts.
For example, a synchrotron optical flare could have been Doppler boosted
by a factor of (see Section 3), corresponding to a brightness
magnification of 12.5 mag, while the impact flares are not
Doppler-boosted.
In this paper we will investigate the simultaneous radio/millimeter and
optical variations occurred in OJ287 and provide more evidence for the
validity of the lighthouse scenario proposed in Qian (QiXiv19 (2019)).
| Parameter | fixed value |
|---|---|
| 0.0 rad | |
| –2.0 rad | |
| 0.0402 | |
| 1.0 | |
| 0.0138 mas | |
| d/d | -7.04 rad/mas |
| Waveband | Flux density |
|---|---|
| 37 GHz | 2.31 Jy |
| 22 GHz | 2.31 Jy |
| 14.5 GHz | 1.30 Jy |
| 8 GHZ | 1.30 Jy |
| V-band | 2.70 mJy |
| Waveband | Flux density |
|---|---|
| 37 GHz | 1.30 Jy |
| 22 GHz | 1.37 Jy |
| 14.5 GHz | 1.52 Jy |
| 8 GHz | 1.44 Jy |
| K-band | 29.3 mJy |
| V-band | 9.59 mJy |
| U-band | 5.62 mJy |
| UV-band | 1.06 mJy |
| Waveband | Flux density |
|---|---|
| 37 GHz | 4.79(-6) Jy |
| 22 GHz | 5.05(-6) Jy |
| 14.5 GHz | 5.61(-6) Jy |
| 8 GHz | 5.31(-6) Jy |
| V-band | 3.53(-5) mJy |
2 Basic considerations
The variability behavior of blazar OJ287 is very complex. In order to
understand the entire phenomena observed in this blazar, a detailed
summary analysis of its flaring characteristics observed at radio,
infrared, optical wavelengths and in -rays have been made in Qian
(QiXiv19 (2019)), including: (1) simultaneous optical and -ray
flares; (2) spectral energy distribution of the outbursts; (3) similarity
in temporal and spectral variations of quasi-periodic outbursts
and non-periodic (synchrotron) outbursts;
(4) simultaneity in radio/millimeter and optical variations;
(5) color stability during the NIR-optical-UV outbursts (for both
quasi-periodic and non-periodic) ; (6) broken power-law spectra in
NIR-optical-UV bands, (7) decomposition of light-curves of optical
outbursts into elementary flares; (8) symmetry in the profiles of optical
outbursts; (9) possible existence of double jets produced by the putative
black hole binary system; (10) connection between the optical
outbursts and the
emergence of superluminal radio knots; (11) distinctive variations in
optical and radio polarization; (12) similarity in light-curve structure of
the quasi-periodic outbursts (e.g. Sillanpää et al. Si85 (1985)); (13)
association of low polarization degree with rapid polarization angle
change in quasi-periodic optical outbursts (e.g., Villforth et al.
Vil10 (2010)); etc.
Based on the summarization of all these characteristics, the
precessing jet nozzle model previously proposed by Qian et al.
(Qi91 (1991), Qi17 (2017), QiXiv18 (2018)) has been used to simulate
the light-curves of the quasi-periodic outbursts in 1983.00, 1984.10,
1994.75, 2005.76, 2007.70, 2015.75 and a few non-periodic flares.
It has shown that both periodic and non-periodic optical outbursts
may be synchrotron flares originated from the relativistic jet. Their
light curves can be interpreted in terms of lighthouse effect due to the
helical motion of the superluminal optical knots.
Here we would like to mention some results of the investigations
obtained in earlier years as supplementary arguments for the synchrotron
origin of the quasi-periodic optical outbursts in OJ287.
-
•
Usher (Us79 (1979)) studied the multi-frequency light-curves of the outburst observed in OJ287 during the period of 1971–1975 222The light-curves were compiled from the data published in literature at wavelengths of 0.44m, 10m, 0.35, 0.9, 2.8, 3.8, 4.5, 6, 11, and 18 cm. and suggested that there is a multi-frequency optical-radio synchrony within observational uncertainty for bursts III, IV and V (as called in that paper), which peaked at 1973.0, 1973.9 and 1975.1 respectively. Burst II (peaking at 1971.7) could be also synchronous at optical and radio wavelengths, if it is the result of superposition of two or more bursts. It is noted that optical bursts II and III (the strongest and secondary strong flares in this outburst event) have been identified as the double “impact (thermal) flares” of the quasi-periodic outburst (Dey et al. De18 (2018)). Thus the radio variations synchronous with the optical variations observed for bursts II and III may imply that the optical outbursts are nonthermal (synchrotron) flares. In this paper we will investigate the correlation between the optical and radio variability observed in the quasi-periodic outburst during 1995.8–1996.1 in OJ287 and further show that the radio variations simultaneous with the optical variations indicate that this optical outburst is nonthermal.
-
•
Holmes et al. (Holm84 (1984)) made simultaneous observations of OJ287 at infrared JHK wavelengths and in optical and near infrared wavelengths at UBVRI in 1983 January (during 4 days from January 7 to January 10). This time-interval just coincided with the peaking stage of the primary quasi-periodic outburst (Valtaoja et al. Val20 (2000)), which was identified as an “impact (thermal) burst” in the precessing binary model (Lehto & Valtonen Le96 (1996), Sundelius et al. Su97 (1997), Valtonen et al Va18 (2018), Dey et al. De18 (2018)).333The starting epoch of the 1983.0 outburst (1982.964) has been taken as a standard reference-epoch for the outburst timing in all versions of the disk-impact model (Lehto & Valtonen Le96 (1996), Sundelius et al. Su97 (1997), Valtonen et al. Va18 (2018)). The very low polarization degrees of p1% at R- and V-bands observed on January 8 (a dip in the polarization curves) were regarded as the rational evidence for the optical outburst being a thermal flare. However, the rapid daily variations in polarization angle at R-band () and V-band () during one-day period (from January 8 to January 9)444Similar polarization behavior was observed at B-band and U-band. does not support this interpretation, because appearance of a thermal outburst (with zero polarization) can greatly reduce the polarization degree of the source, but can not cause its variations in polarization angle. This argument seems important: occurrence of very low polarization degrees (2-4%) alone cannot be simply recognized as a sign of strong thermal outburst appearing, because the associated variations in polarization angle must be due to synchrotron components.
In order to interpret the simultaneous multi-wavelength light-curves of time-variable flux density S(,t), polarization degree p(,t) and polarization angle PA(,t) in K-, H-, J-, I-, R-, V-, B-, and U-bands, Holmes et al. proposed a two-component model (also see Björnsson Bj82 (1982), Björnsson & Blumenthal BjB82 (1982), Königl & Choudhuri Ko85 (1985) for jet polarization models). 555It should be noted that this model seems to be one of the most effective jet models to coherently explain the complete characteristics of the optical multi-wavelength flux density and polarization for OJ287. They strongly suggested that the two components are physically connected with one component having a stable polarization angle while the other one showing a gradual rotation. This behavior may be understood in terms of a physical rotation of the magnetic field. Obviously, their modeling results are consistent with the helical motion model (lighthouse model) proposed in Qian (QiXiv19 (2019)) and the two model-components might be related to the jets produced by the primary and secondary black holes, respectively (Qian QiXiv18 (2018)). In addition, Kikuchi et al. (Ki88 (1988)) observed a synchronous rapid variations of polarization angles during February 3–12 1986 in the optical and radio wavebands on time-scale of days. They explained this correlated variation in terms of a shock of “core-envelope” structure moving along the helical magnetic field in the jet. Moreover, the 1983.0 outburst has spectral curvatures in infrared-optical and optical-ultraviolet regions with concave or convex structures which can be also explained in terms of the two-component model together with the polarization features. It seems that the distinct spectral structures observed for the 2015 quasi-periodic outburst in IR-optical-UV wavebands (Kushwaha et al. 2018a ) could be interpreted in terms of a jet model like that proposed by Holmes et al. (Holm84 (1984)).
We further point out that very low polarization degrees were observed in the quasi-periodic optical outbursts in September 2007 (Villforth et al. Vil10 (2010)) and December 2015 (Valtonen et al. Va17 (2017)). In both cases the associated rapid variations in polarization angle may indicate that the optical outbursts are nonthermal flares produced in the relativistic jet. The time-variable polarization degree curve should be interpreted coherently with the interpretation of the time-variable flux density curve and polarization angle curve. -
•
D’Arcangelo et al. (Da09 (2009)) explored the correlation between polarization characteristics at optical and near-infrared (NIR) wavelengths and that in the 43 GHz compact core in OJ287 between 2005 October 24 and November 3 and between 2006 March 27 and April 4. They found that during this period the polarization degrees in the optical, near-infrared and radio-core are nearly steady. They measured the mean R-band polarization degree to be 30.7% which appears to oscillate with a period of 2 days. Interestingly, the polarization degrees in B-, V-, R- and I-bands have similar values and synchronous variations. D’Arcangelo et al. fit the optical spectra with a power-law and found an steady optical spectral index of 1.280.05. We notice that the first (strongest) flare of the quasi-periodic optical outburst in 2005.74, which was identified as a thermal impact-flare in the precessing binary model (Valtonen & Ciprini Va12 (2011)), peaked between 2005 October 17 and October 28. Thus the high polarization degrees (30%) observed at multi-wavelengths (B-, V-, R- and I-wavebands) by D’Arcangelo et al. between October 25 and 28 should be ascribed to this optical flare, demonstrating its origin of synchrotron radiation. The short rotation (from to ) measured between 2005 October 25 and October 29 also favors relativistic jet models (Qian QiXiv19 (2019)).
Moreover, D’Arcangelo et al. suggested that the variable optical-NIR emission observed during the two campaigns in 2005 and 2006 originates from the 43 GHz core region of the parsec-scale jet. They proposed a spine-sheath model to interpret the synchronous optical and radio polarization variability, including all the characteristics of the observed emission: the time-variable flux density S(,t), polarization degree p(,t) and polarization angle PA(,t).
The results restated above for the quasi-periodic optical outbursts in
1971.7, 1973.0, 1983.0 and 2005.7 show that they are all nonthermal
flares, produced within the relativistic jet, and support the lighthouse
model (or helical motion model) proposed in Qian (QiXiv19 (2019)).
It can be seen from the above description that multi-frequency observations
in optical/IR and radio/millimeter wavebands (measuring time-variable
flux density curve, polarization degree curve and polarization angle curve)
are very important to understand the nature of optical emission in OJ287.
Search for correlation between the optical and radio outbursts can
provide decisive evidence for the mechanism producing the optical
radiation. In this paper we will investigate the optical-radio correlation
for the quasi-periodic optical outburst event in 1995.8.
We would like to point out that a variety of connections between
optical and radio variability has been observed in OJ287, involving
different emitting processes: e.g., (1)
simultaneous radio-optical bursts; (2) radio bursts delayed with respect to
optical bursts (e.g., Valtaoja et al. Val87 (1987), Val20 (2000));
(3) radio bursts without optical counterparts; (4)
optical bursts without radio counterparts, etc. Superluminal optical
knots, which produce simultaneous radio-optical emission through lighthouse
effect near the nucleus, may continue to move outward and evolve
to form superluminal radio knots
on parsec scales, causing delayed connection between radio and optical
outbursts (e.g., Britzen et al.
Br18 (2018), Qian QiXiv18 (2018), Agudo et al. Ag12 (2012), Sillanpää
et al. Si85 (1985), Valtaoja et al. Val20 (2000),
Tateyama et al. Ta99 (1999), Kushwaha et al. 2018a , Aller et al.
Al14 (2014)).
3 Assumptions
In the following, we will continue to explore the optical and radio variability behavior in OJ287 in terms of the lighthouse model under the precessing jet nozzle scenario and concentrate on investigating the connection between the radio/millimeter and optical flares observed during the quasi-periodic outburst event in 1995.84, and further show that the simultaneous variability behavior at radio/millimeter and optical wavelengths support the lighthouse model proposed in Qian (QiXiv19 (2019)).
3.1 Geometric parameters
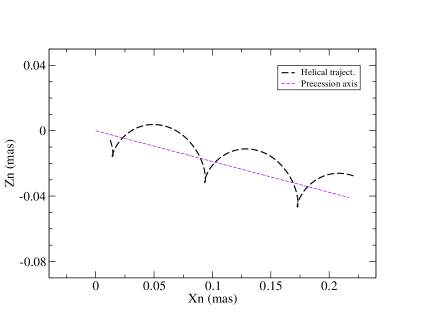
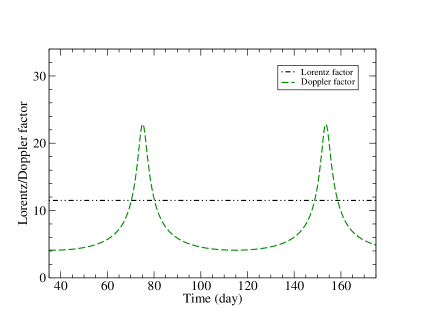
We will use the same formulation and parameters to describe the precessing jet-nozzle scenario and the helical model, referring to Qian (QiXiv19 (2019)) for details. The geometric parameters for the model simulation are listed in Table 1. We assume that superluminal knots move along helical trajectories (probably helical magnetic fields) around the jet axis, which is shown in Figure 1 (left panel). The jet axis precesses around the precession axis (not displayed here) which is defined by parameters and . The selected jet axis is defined by precession phase =–2.0 rad. The jet axis is described by parameters and , which define a straight line. The helical trajectory pattern is defined by the parameters (amplitude) and d/d (rotation rate). In the right panel of Figure 1 the modeled Lorentz factor and Doppler factor are shown for the elementary flare in 1995.98 (peaking at JD2450075).
3.2 Spectra of elementary flares
As suggested in Qian (QiXiv19 (2019)) that the quasi-periodic outbursts
can be decomposed into several elementary flares with symmetric profiles
and each elementary flare can be explained in terms of the lighthouse
model. Thus the light-curves observed in optical and radio/mm wavebands
can be simulated. We assume that the elementary flares have broken
power-law spectra in the
NIR–optical–UV bands with a spectral break at V-band of =
0.5 and the local V-band spectral index =1.0
(). The flux densities of the
underlying jet (or base-levels) are assumed to be constant and
listed in Table 2. The modeled
radio/mm spectra are described in terms of the modeled indexes between
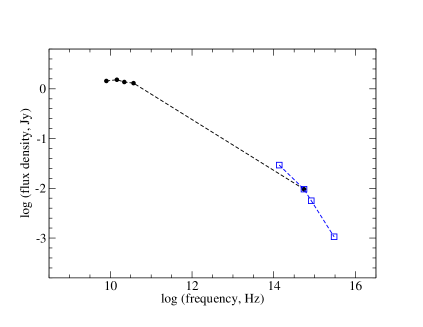
the radio/mm and V-band. As an example, in Figure 2 is shown
the modeled radio-optical spectrum for the elementary flare in 1995.98
(peaking at JD2450075). The modeled flux densities are listed in Table 3.
The corresponding comoving (or intrinsic) flux densities are listed
in Table 4.
It should be noted that the local spectral index in the radio-mm region
(8 GHz to 37 GHz) is much smaller than that at V-band
(=1.0; see Figure 2),
and thus the variability amplitudes of the radio/mm outbursts will be much
smaller than that in the optical V-band (see below).
3.3 Doppler boosting and simulation of optical light-curve
We will model simulate the V-band optical light-curve of the 1995.84 outburst event in terms of the lighthouse model proposed in Qian (QiXiv19 (2019)). In this case the lighthouse effect results in a symmetric light-curve via Doppler boosting per revolution of the helical motion for each of elementary flares. The observed optical flux density can be written as:
| (1) |
Where (t) represents the constant comoving (or de-boosted) optical flux density, (t)–Doppler factor of the superluminal optical knot, –local spectral index at V-band (Blandford & Königl Bl79 (1979)), assumed to be =1.0. – the underlying flux density of the jet at V-band (Table 2). The modeled Lorentz factor , Doppler factor and comoving flux density are selected for each of the elementary flares to reasonably fit the entire optical light-curve (see Table 5).
3.4 Parameters for simulation of radio/mm light-curves
For model simulation of the radio/millimeter light-curves at frequencies of 8, 14.5, 22, and 37 GHz, we will define the modeled two-point spectral indexes (radio,v) between the radio/mm frequencies and V-band frequency: (37GHz,v), (22GHz,v), (15GHz,v) and (8GHz,v). The modeled radio/mm light-curves will be derived from the modeled V-band light-curve using the formula given in equation (2).
| (2) |
represents the modeled flux density at the radio frequencies of 8, 14.5, 22 and 37 GHz. represents the modeled V-band optical flux density. The modeled spectral indexes (radio,v) are selected to reasonably fit the observed radio/mm light-curves (see Tables 5 and 6). This method is equivalent to select appropriate two-point radio spectral indexes (22GHz,37GHz), (14.5GHz,37GHz) and (8GHz,37GHz) to simulate the radio light-curves at 22, 14.5 and 8 GHz, when the 37 GHz light-curve is fitted by using (37GHz,V-band).
3.5 Cosmological model
In this work, we adopt a CDM cosmological model with the parameters as: = 0.27, = 0.73 and =71 km (Spergel et al. Sp03 (2003), Komatsu et al. Ko09 (2009)). 1 mas = 4.5 pc (Hogg, Ho99 (1999)).
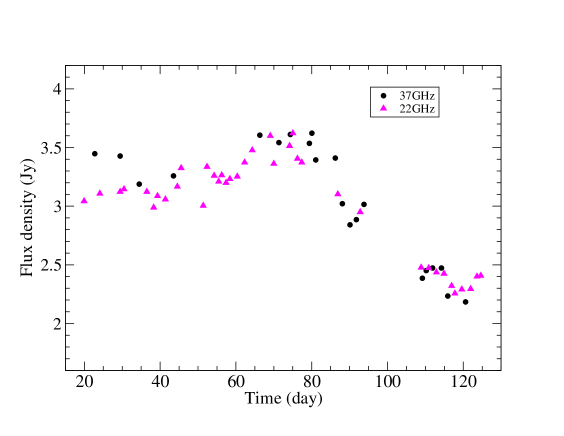
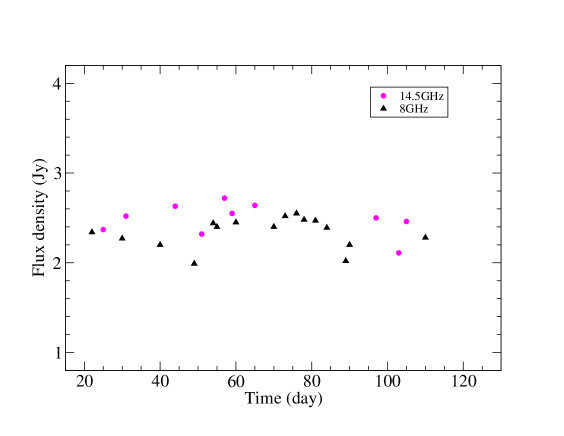
4 Connection between optical and radio/millimeter outbursts
The light curves observed during the period 1995.77 (JD2450000)
– 1996.13 (JD2450130) in the optical V-band and radio/mm bands (37, 22,
14.5 and 8 GHz) are shown in Figure 3. The V-band data were taken from
Basta & Hudec (Ba06 (2006)) and OJ-94 project (Nilsson,
private communication). The 37 and 22 GHz data were taken from Valtaoja
et al. (Val20 (2000)) and the 14.5 and 8 GHz data from UMRO-archive
(Aller, private communication).
It can be seen that the optical light curve consists of a large number
of elementary spike-like flares with time scales of days.
Figure 3 shows that the envelopes of the radio/mm light curves are
much more smoother than that of the optical light-curve. This is due to
the local spectral indexes at radio/mm wavelengths are much smaller than
that at optical V-band (=1.0). However, even by
visual inspection it can be seen that the radio/mm light-curves have their
envelopes very similar to that of the optical envelope during the period
JD2450060–2450090. Very clearly, for the 37 and 22 GHz light curves
this similarity in the envelopes can be extended to JD2450120 when both
the optical flux density and the 37–22 GHz flux densities
simultaneously reached to their
quiet levels. Moreover, a few optical spikes (e.g, at JD2450075 and
JD2450080) can be recognized to have their concurrent flares in
the 37 and 22 GHz light-curves. All these similarities in the
radio/mm and the optical variations clearly demonstrate that the
radio/mm flares are simultaneous with the optical flares without
measurable time delays (less than two days), as suggested previously
by Valtaoja et al. (Val20 (2000)).
The close connection
between the radio/mm outbursts at four frequencies (37, 22, 14.5 and 8 GHz)
and the optical outburst (or simultaneous variability behavior) during
the period of 1995.8–1996.1 provides further evidence for
the nonthermal nature of the quasi-periodic optical outbursts in OJ287,
in addition to the association of the high energy -ray and optical
outbursts.
666Also see the results of the
correlated optical and multi-waveband radio/mm outbursts observed in
1971–1974 (Usher Us79 (1979)). The close connection between the
optical and radio/mm outbursts may be regarded as another decisive
evidence that the optical outbursts and their constitutive (elementary)
flares in OJ287 are synchrotron in origin. The arguments against lighthouse
models (e.g., Valtaoja et al. Val20 (2000)) can now be clarified.
(1) Firstly, in the precessing jet nozzle scenario, both the optical and
radio/mm outbursts are due to enhanced Doppler boosting induced by
lighthouse effect due to the helical motion of the same superluminal knots.
Thus the radio emissions are similarly boosted. Due to the nature of
synchrotron emission the polarization properties in optical and radio/mm
wavebands can be well interpreted.
(2) The interpretation of both the optical and radio/mm outbursts in terms
of the precessing jet nozzle models does not involve precession of the
whole jet. Thus the emissions in optical and radio/mm wavebands
from the underlying jet (or the quiescent base-levels) do not experience
Doppler boosting during the outbursts.
(3) The lighthouse model proposed here requires the emitting source
having some kind of radiation structure (or distribution): the radio/mm
and optical emission do not come from the exactly same region. Most
possibly, it could be a planar shock front with a core-envelope structure.
Its central (core) region dominates the emission in IR-optical bands (and
the associated -rays), while its outer region (envelope)
dominates the
emission in radio/mm wavebands. Thus the optical and radio/mm emissions
can be simultaneously and similarly Doppler boosted, when the source moves
along helical trajectories, if the shock front is perpendicular to the
direction of the motion. This core-envelope structure is consistent with
the concept of the stratification of magnetic surface structure in the
magnetospheres of spinning black hole-accretion disk systems
(e.g., Camenzind,Cam90 (1990)).
(4) The radio/mm emitting regions may have different optical depths or
opacity effects in different cases. This can explain why some
quasi-periodic optical outbursts do not have radio counterparts.
But even in these cases delayed radio outbursts are usually
observed if the optical knots evolve to form pure radio knots in
outer jet regions on parsec scales (Valtaoja et al.
Val20 (2000), Tateyama et al. Ta99 (1999), Britzen et al. Br18 (2018),
Qian QiXiv18 (2018)).
(5) Our studies (Qian QiXiv19 (2019) and this work) have found that
the quasi-periodic optical outbursts can be decomposed into several
elementary flares, each having symmetric profiles with similar rising
and declining timescales. This explains why the individual flares during
quiescent period and flaring period have similar variability
timescales (Valtaoja et al. Val20 (2000)), because the elementary flares
during quiescent and flaring periods have similar properties:
flux density is boosted and timescale is compressed by Doppler effects.
(6) Since the flux enhancements induced by Doppler boosting depend on
the local spectral index at the emission frequency,
the flattening of the radio/mm spectrum with respect to the IR-optical
spectrum results in the amplitude of the radio/mm outbursts being much
smaller than that of the optical outbursts, as usually observed.
(7) This work only investigate the interpretation of the optical and
radio/mm outbursts (related to superluminal knots) on timescales of
10–100 days. Thus the underlying jet flux density
(or the base-level
flux density) is assumed to be constant. However, the physical conditions
of the jet (jet bulk motion and magnetic field structure, etc.) should
vary on longer time-scales and the jet precession (with a period
of 12 yr) will also modulate the
underlying jet emission. In order to understand the whole phenomena in
OJ287 all these ingredients should be taken into consideration.
In the following we will model simulate the optical and radio/mm light
curves in terms of lighthouse effect due to the helical motion of the
superluminal optical/radio knots, respectively.
| (mJy) | r | (mJy) | FWHM | |||
|---|---|---|---|---|---|---|
| 27.86 | 6.54 | 17.0 | 33.58 | 10.95 | 3.03(-6) | 1.0 |
| 31.36 | 6.54 | 17.0 | 33.54 | 10.94 | 3.03(-6) | 1.0 |
| 34.46 | 6.54 | 17.0 | 33.54 | 10.94 | 3.03(-6) | 1.0 |
| 37.66 | 6.54 | 17.0 | 33.54 | 10.94 | 3.03(-6) | 1.0 |
| 39.26 | 6.54 | 17.0 | 33.54 | 10.94 | 3.03(-6) | 1.0 |
| 41.06 | 6.54 | 17.0 | 33.54 | 10.94 | 3.03(-6) | 1.0 |
| 42.86 | 6.54 | 17.0 | 33.54 | 10.94 | 3.03(-6) | 1.0 |
| 44.56 | 6.54 | 17.0 | 33.54 | 10.94 | 3.03(-6) | 1.0 |
| 46.41 | 6.54 | 17.0 | 33.54 | 10.94 | 3.03(-6) | 1.0 |
| 47.76 | 6.54 | 17.0 | 33.54 | 10.94 | 3.03(-6) | 1.0 |
| 50.81 | 6.54 | 17.0 | 33.54 | 10.94 | 3.03(-6) | 1.0 |
| 52.21 | 6.54 | 17.0 | 33.54 | 10.94 | 3.03(-6) | 1.0 |
| 54.76 | 6.54 | 17.0 | 33.54 | 10.94 | 3.03(-6) | 1.0 |
| 56.35 | 6.43 | 14.0 | 27.73 | 7.76 | 6.32(-6) | 1.8 |
| 59.29 | 7.47 | 12.5 | 24.79 | 6.39 | 1.26(-5) | 2.5 |
| 63.07 | 7.83 | 13.0 | 25.77 | 6.83 | 1.16(-5) | 2.3 |
| 65.95 | 9.04 | 14.0 | 27.73 | 7.76 | 1.07(-5) | 1.8 |
| 68.12 | 12.0 | 14.5 | 28.70 | 8.25 | 1.37(-5) | 1.5 |
| 70.30 | 10.9 | 17.5 | 34.51 | 11.5 | 5.81(-6) | 0.9 |
| 71.95 | 10.4 | 16.5 | 32.58 | 10.4 | 6.82(-6) | 1.0 |
| 75.05 | 12.3 | 11.5 | 22.82 | 5.56 | 3.53(-5) | 3.3 |
| 77.06 | 6.61 | 15.0 | 29.67 | 8.75 | 5.05(-6) | 1.3 |
| 80.32 | 11.7 | 14.5 | 28.70 | 8.25 | 1.32(-5) | 1.6 |
| 85.16 | 8.79 | 12.0 | 23.81 | 5.97 | 1.89(-5) | 3.0 |
| 88.96 | 10.1 | 12.0 | 23.81 | 5.97 | 2.32(-5) | 3.0 |
| 92.12 | 9.22 | 14.5 | 28.70 | 8.25 | 6.66(-6) | 1.6 |
| 94.98 | 10.4 | 13.5 | 26.75 | 7.29 | 1.50(-5) | 2.2 |
| 99.06 | 6.54 | 17.0 | 33.54 | 10.94 | 3.03(-6) | 1.0 |
| 101.02 | 6.54 | 17.0 | 33.54 | 10.94 | 3.03(-6) | 1.0 |
| 103.17 | 6.54 | 17.0 | 33.54 | 10.94 | 3.03(-6) | 1.0 |
| 105.62 | 6.54 | 17.0 | 33.54 | 10.94 | 3.03(-6) | 1.0 |
| 107.11 | 6.54 | 17.0 | 33.54 | 10.94 | 3.03(-6) | 1.0 |
| 108.90 | 6.54 | 17.0 | 33.54 | 10.94 | 3.03(-6) | 1.0 |
| 111.15 | 6.54 | 17.0 | 33.54 | 10.94 | 3.03(-6) | 1.0 |
| 113.83 | 6.54 | 17.0 | 33.54 | 10.94 | 3.03(-6) | 1.0 |
| 116.17 | 6.54 | 17.0 | 33.54 | 10.94 | 3.03(-6) | 1.0 |
| 122.10 | 10.4 | 13.5 | 26.75 | 7.29 | 1.50(-5) | 2.2 |
4.1 Model simulation of the optical light-curve
Since the quasi-periodic optical outbursts can be decomposed into several
elementary outbursts and each of the elementary flares can be interpreted
in terms of the helical motion model, we can use the processing jet nozzle
model and the kinematic properties observed on parsec scales to investigate
the light-curves of optical outbursts in OJ287.
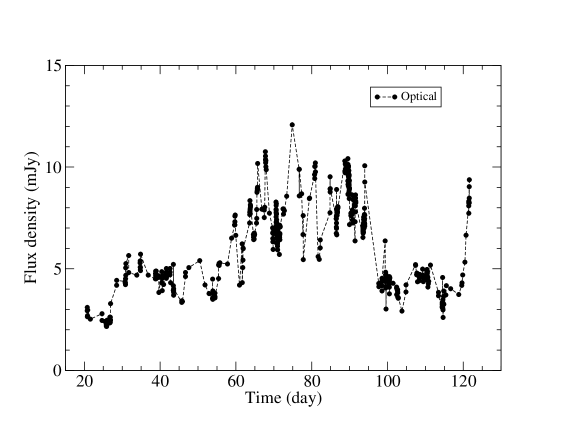
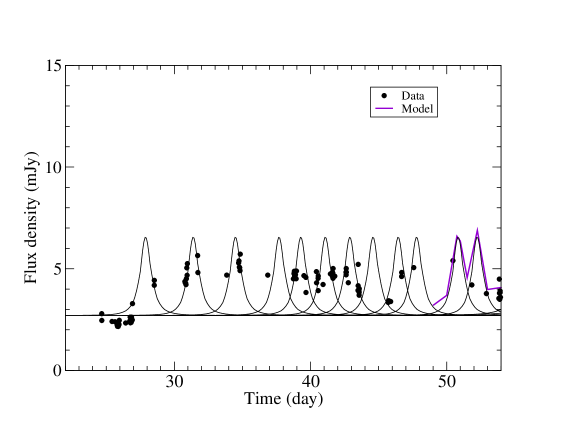
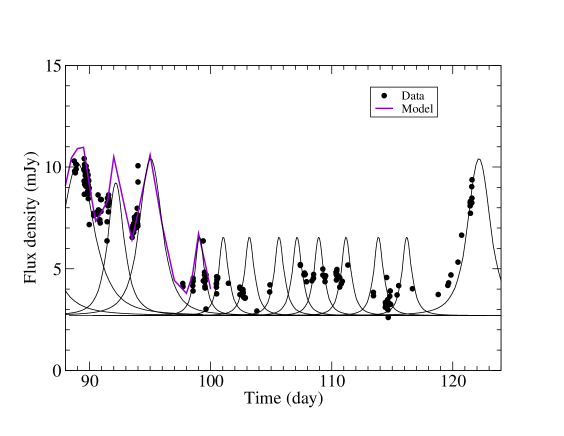
The model simulation of the optical light-curve for the 1995.84 outburst
event is shown in Figure 4. The model parameters and results for all
the optical elementary flares are summarized in Table 5:
(JD–2450000) – peaking epoch of elementary flare;
(mJy) – optical flux density at peak;
(mJy) – base-level (underlying jet) flux density;
– bulk Lorentz factor of superluminal optical knots;
– maximum Doppler factor;
– ratio of the maximum and minimum Doppler factor;
(mJy) – comoving (or de-boosted) flux density and the
numbers in the parentheses represent the powers of 10;
FWHM (day) – full width at half-maximum of flare profile.
Due to the insufficient sampling of the optical observations it is very
difficult to recognize the discrete elementary flares. The
simulation is certainly not unique, depending on personal assessments on
the decomposition. We have tried to recognize the symmetric
distributions of the data-points. The simulation results described here
may provide us
useful information about the elementary flares: timescale, bulk motion
Lorentz factor, Doppler beaming factor,
comoving optical flux density etc., which may be useful to understand
the nature of the optical outbursts, jet physics,
superlumianl knot kinematics and the characteristics of
the putative central black hole binary system.
For describing the simulation results we divide the light-curve
into three segments: segment I for time-interval JD2450024–2450049
(1995.8392–1995.9077; 25 days),
segment II for time-interval JD2450050–2450097
(1995.9104–1996.0391; 47 days) and segment III for
time-interval JD2450098–2450118 (1996.0418–1996.0966; 20 days).
4.1.1 Segment I
This part of the light-curve may be regarded as the starting
stage of the 1995.84 outburst event. Epoch JD2450024 (1995.841)
has been predicted as the starting epoch of the primary thermal
outburst in the disk-impact model, but this impact-outburst
did not happen and the source
retained at a low activity level within the first 25 days: neither
a strong burst nor a standard impact-burst light curve was observed, while
the follow-up synchrotron flares happened as usual.
The disappearance of the primary impact-outburst seems difficult to be
understood under the disk-impact scenario, and the claimed timing of this
impact-outburst seems losing its physical meaning.
Applying the lighthouse model we use ten elementary flares with
similar symmetric profiles to fit the light-curve, which is
displayed in upper panel of Figure 4.
Although the data sampling is very sparse, the elementary flares
(at =27.86, 31.36, 34.46, 39.26, 41.06, 42.86 and 46.41)
can reasonably well fit the data-points, implying
steady ejections of superluminal optical knots with similar properties
during this time-interval. All the optical knots are modeled with the same
bulk Lorentz factor of =17, having time-scales of 1 day.
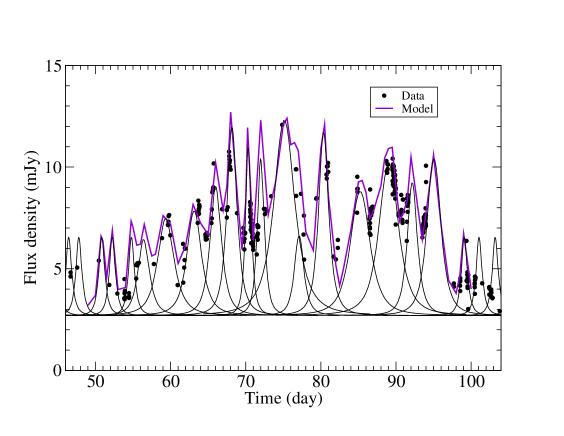
4.1.2 Segment II
This segment of the light-curve may be regarded as the main part of the optical event starting in 1995.84, revealing a group of large amplitude spike-like flares and an envelope of typical pattern of rising-plateau-declining stages. Although the data sampling is still insufficient to accurately decide the peak epoch and amplitude of these spikes, the decomposition of the outburst into its elementary flares can be made appropriately. Seventeen elementary flares with different Lorentz factors (in the range of 11.5 to 17.5) have been used (see Table 5). The simulation results are displayed in the middle panel of Figure 4. The bold violet curve denotes the modeled total flux density, which reasonably well fit most of the observational data-points. The elementary flares have their time-scales in the range of 0.9 to 3.3 days.
4.1.3 Segment III
This segment may be regarded as the ending stage of the outburst
event, when the flaring activity sharply declined. Nine elementary
flares with similar symmetric profiles
and Lorentz factors (=17) has been used to simulate
the light-curve. Although the data sampling is insufficient to
accurately decide their peak amplitudes,
the elementary flares (at =99.06,
101.02, 108.90, 111.15, 113.83 and 116.17) can reasonably well fit the
observational data-points. After JD2450120
another activity period started.
As a brief summary, it can be seen that the entire light-curve of the
optical outburst event staring in 1995.84 (JD2450024) during a period of
3 months can be model-simulated in terms of our
lighthouse model (helical motion model). All these elementary flares
have symmetric profiles with similar Lorentz factors and time-scales.
Their comoving (or de-boosted) flux densities
are on order of mJy, implying that the Doppler boosting
effects are very strong. The characteristics of the superluminal
optical/radio knots and their helical motion explored in this work
may be significant for understanding the nature of the whole phenomena
in OJ287.
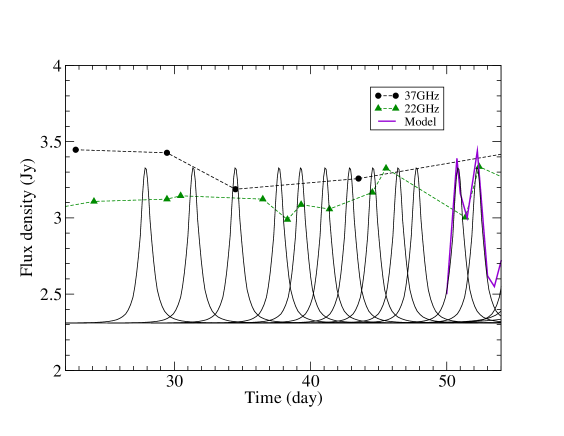
4.2 Model simulation of 37 GHz light curve
Corresponding to the simulation of the optical light-curve, the 37 GHz light-curve has been simulated and shown in Figure 5. The modeled 37 GHz light curve is derived from the modeled optical light-curve by selecting the spectral index (37GHz,V-band) between 37 GHz and optical V-band for each of the elementary flares which are listed in Table 6. The 22 GHz light-curve can be fitted using a similar method by selecting spectral index (22GHz,V-band) for the elementary flares, but the fitting results are not given here. However, the 22 GHz data-points are also shown in Figure 5 to help visual-inspecting the quality of the simulation of the 37 GHz light-curve. The simulation results are described separately for three segments as follows.
4.2.1 Segment I
Corresponding to the same segment of the optical light-curve (JD2450024–2450049), ten elementary flares at 37 GHz are simulated (upper panel of Figure 5). Unfortunately, only three data-points are available, but the data-point at =34.46 is well fitted, coincided with the optical flare. There are four 22 GHz data-points very close to the profile of the flares at =37.66, 39.26, 41.06 and 44.56, indicating that the optical flares should have their counterparts at 37 GHz. The 37 and 22 GHz data-points between 2450028 and 2450030 have no optical counterpart, possibly implying the existence of a pure radio/mm burst.
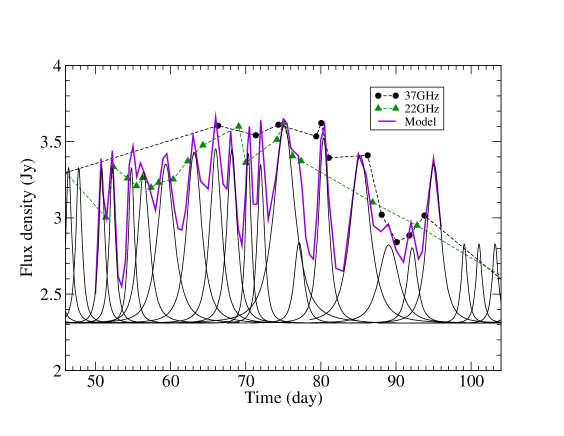
4.2.2 Segment II
Corresponding to the main part of the optical light-curve seventeen 37 GHz elementary flares are simulated and the results are shown in the middle panel of Figure 5. The bold violet curve denotes the modeled total flux density curve. It can be seen that almost all the 37 GHz data-points are reasonably well fitted (within uncertainty of 1-2 days), indicating their simultaneous flaring at optical and 37 GHz wavelengths. In particular, the optical peak at =80.32 has a well fitted 37 GHz peak. During the time-interval between 2450050 and 2450078, the 22 GHz data-points are close to the profiles of the 37 GHz elementary flares, demonstrating the simultaneous variations at 37/22 GHz and optical wavelengths.
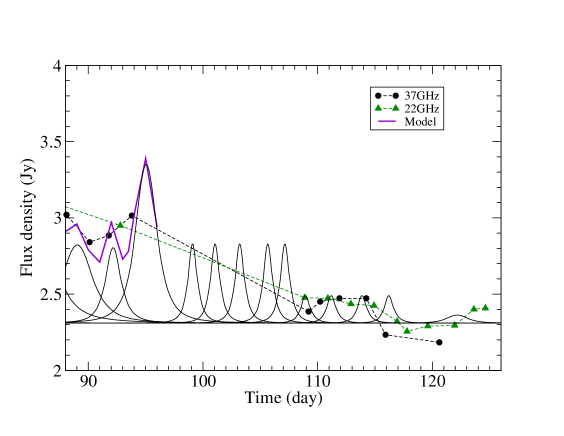
4.2.3 Segment III
Corresponding to the same part of the optical light-curve, nine 37 GHz
elementary flares have been used in the simulation. The results
are displayed in
the bottom panel of Figure 5. Only five data-points are available
and four elementary flares are invoked, having very low
flux densities and a spectral index (37GHz,V-band) of
0.40, much smaller than those (0.50–0.58) during the outburst peaking
stage (between 2450050 to 2450085; see Table 6).
It can be seen from Figure 5 (middle panel) that the observed 22 GHz
light-curve is slightly below the 37 GHz light-curve, thus introduction
of spectral index (22GHz,V-band) slightly smaller than
the (37GHz,V-band), will well fit
the 22 GHz light curve.
As shown above, we can reasonably well explain the optical
and 37–22 GHz
light curves in terms of the lighthouse model under the precessing
jet nozzle scenario.
Each of the optical elementary flares have their 37/22 GHz counterparts.
Same Doppler boosting factors are effective for both optical and radio/mm
flares. These results can not be obtained in the whole-jet
precessing models (e.g., Valtaoja et al. Val20 (2000)).
The significant point is that the 37–22 GHz elementary flares are
shown to be synchronous with the optical ones. If the 37–22 GHz flares
were delayed with respect to the
optical flares, the spikes on time-scales of 1-2 days
in the 37–22 GHz
light-curves might have been smoothed out and have not been observed.
| 27.86 | 3.33 | 0.58 | 8.00(-7) |
| 31.36 | 3.33 | 0.58 | 8.00(-7) |
| 34.46 | 3.33 | 0.58 | 8.00(-7) |
| 37.66 | 3.33 | 0.58 | 8.00(-7) |
| 39.26 | 3.33 | 0.58 | 8.00(-7) |
| 41.06 | 3.33 | 0.58 | 8.00(-7) |
| 42.86 | 3.33 | 0.58 | 8.00(-7) |
| 44.56 | 3.33 | 0.58 | 8.00(-7) |
| 46.41 | 3.33 | 0.58 | 8.00(-7) |
| 47.76 | 3.33 | 0.58 | 8.00(-7) |
| 50.81 | 3.33 | 0.58 | 8.00(-7) |
| 52.21 | 3.33 | 0.58 | 8.00(-7) |
| 54.76 | 3.33 | 0.58 | 8.00(-7) |
| 56.35 | 3.30 | 0.58 | 1.67(-6) |
| 59.29 | 3.35 | 0.56 | 2.76(-6) |
| 63.07 | 3.43 | 0.56 | 2.54(-6) |
| 65.95 | 3.45 | 0.54 | 1.93(-6) |
| 68.12 | 3.45 | 0.50 | 1.69(-6) |
| 70.30 | 3.42 | 0.51 | 7.85(-7) |
| 71.95 | 3.35 | 0.51 | 9.22(-7) |
| 75.05 | 3.61 | 0.51 | 4.77(-6) |
| 77.06 | 2.84 | 0.51 | 6.81(-7) |
| 80.32 | 3.52 | 0.51 | 1.79(-6) |
| 85.16 | 3.41 | 0.54 | 3.42(-6) |
| 88.96 | 2.82 | 0.44 | 1.59(-6) |
| 92.12 | 2.80 | 0.45 | 7.22(-7) |
| 94.98 | 3.35 | 0.51 | 2.03(-6) |
| 99.06 | 2.83 | 0.51 | 4.11(-7) |
| 101.02 | 2.83 | 0.51 | 4.11(-7) |
| 103.17 | 2.83 | 0.51 | 4.11(-7) |
| 105.62 | 2.83 | 0.51 | 4.11(-7) |
| 107.11 | 2.83 | 0.51 | 4.11(-7) |
| 108.90 | 2.49 | 0.40 | 1.42(-7) |
| 111.15 | 2.49 | 0.40 | 1.42(-7) |
| 113.83 | 2.49 | 0.40 | 1.42(-7) |
| 116.17 | 2.49 | 0.40 | 1.42(-7) |
| 122.10 | 2.36 | 0.20 | 0.98(-7) |
| 27.86 | 2.45 | 0.54 | 9.03(-7) |
| 31.36 | 2.45 | 0.54 | 9.03(-7) |
| 34.46 | 2.45 | 0.54 | 9.03(-7) |
| 37.66 | 2.45 | 0.54 | 9.03(-7) |
| 39.26 | 2.45 | 0.54 | 9.03(-7) |
| 41.06 | 2.45 | 0.54 | 9.03(-7) |
| 42.86 | 2.45 | 0.54 | 9.03(-7) |
| 44.56 | 2.45 | 0.54 | 9.03(-7) |
| 46.41 | 2.45 | 0.54 | 9.03(-7) |
| 47.76 | 2.45 | 0.54 | 9.03(-7) |
| 50.81 | 2.45 | 0.54 | 9.03(-7) |
| 52.21 | 2.45 | 0.54 | 9.03(-7) |
| 54.76 | 2.45 | 0.54 | 9.03(-7) |
| 56.35 | 2.42 | 0.54 | 1.89(-6) |
| 59.29 | 2.58 | 0.53 | 3.40(-6) |
| 63.07 | 2.42 | 0.51 | 2.54(-6) |
| 65.95 | 2.54 | 0.50 | 2.10(-6) |
| 68.12 | 2.49 | 0.46 | 1.75(-6) |
| 70.30 | 2.61 | 0.48 | 9.92(-7) |
| 71.95 | 2.52 | 0.48 | 1.08(-6) |
| 75.05 | 2.82 | 0.48 | 5.60(-6) |
| 77.06 | 1.92 | 0.48 | 8.01(-7) |
| 80.32 | 2.73 | 0.48 | 2.10(-6) |
| 85.15 | 2.37 | 0.49 | 3.33(-6) |
| 88.96 | 1.86 | 0.41 | 1.74(-6) |
| 92.12 | 2.33 | 0.48 | 1.52(-6) |
| 94.98 | 2.52 | 0.48 | 2.39(-6) |
| 99.06 | 2.33 | 0.53 | 8.14(-7) |
| 101.02 | 2.23 | 0.52 | 7.35(-7) |
| 103.17 | 2.14 | 0.51 | 6.64(-7) |
| 105.62 | 2.45 | 0.54 | 9.09(-7) |
| 107.11 | 2.23 | 0.52 | 7.35(-7) |
| 108.90 | 2.33 | 0.53 | 8.14(-7) |
| 111.15 | 2.33 | 0.53 | 8.14(-7) |
| 113.83 | 1.56 | 0.40 | 2.06(-7) |
| 116.17 | 1.56 | 0.40 | 2.06(-7) |
| 122.10 | 1.36 | 0.20 | 1.17(-7) |
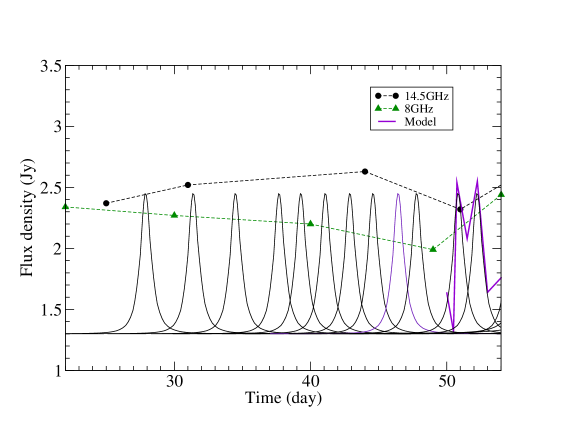
4.3 Model simulation of 14.5 GHz light curve
The model-simulation results for the 14.5 GHz light-curve are displayed in Figure 6. As for the 37 GHz light-curve, the modeled 14.5 GHz light-curve is derived from the optical light-curve by selecting the spectral index (15GHz,V-band) for each of the thirty-six 14.5 GHz elementary flares, which are listed in Table 7. The simulation results are separately described for three segements.
4.3.1 Segment I
Only three 14.5 GHz data-points are available in this time-interval (JD2450024–2450049), we cannot make any meaningful conclusion about the model-fitting. However, two data-points are close to the peaks of the elementary flares at =31.36 and 44.56 within uncertainty of 1 day, showing the modeled light-curve close to the observed level of 14.5 GHz flux density. In this time-interval the spectral index was assumed to be 0.54.
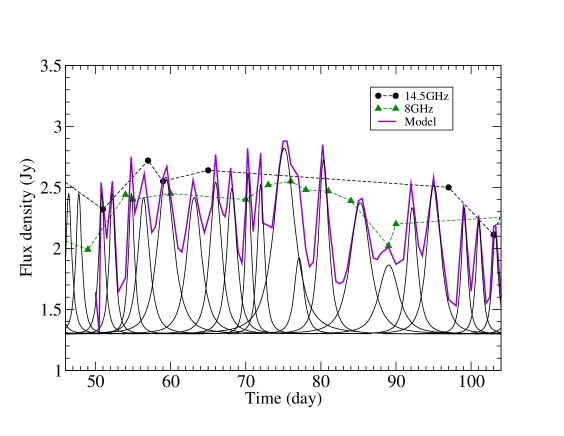
4.3.2 Segment II
For the main part of the optical outburst, the 14.5 GHz light-curve has been simulated in terms of the lighthouse model. The four 14.5 GHz data-points are reasonably well fitted (within uncertainty of 1-2 days) by the modeled total flux density curve at =50.8, 56.35, 59.29 and 65.95. In addition, ten 8 GHz data-points in the time-interval between 2450050 and 2450089 are close to the modeled 14.5 GHz total flux density curve, indicating the simultaneous variations at 14.5–8 GHz and optical wavelengths.
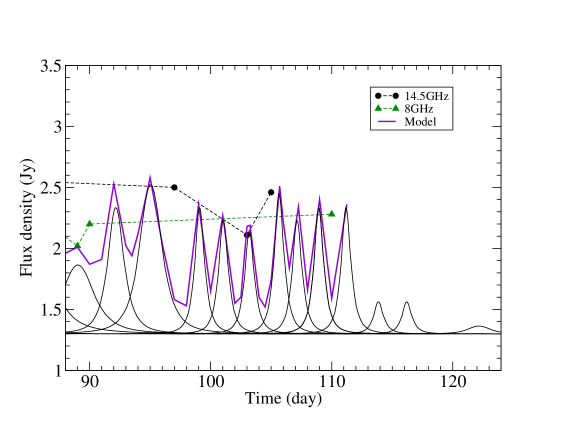
4.3.3 Segment III
Although only three data-points are available in this time-interval
(JD2450090–2450118), two data-points are
reasonably well fitted by the modeled total flux curve at
=103.17 and 105.62 within uncertainty of 1 day.
The 14.5 GHz data-point near JD2450097 might indicate the existence of
a radio burst not associated with any optical flare.
4.4 A brief summary
We have investigated the correlation between the optical flares and
radio/mm bursts on timescales of days in OJ287 for the 1995.84
optical outburst event. The aim is to search the clues for the lighthouse
effect which produces the simultaneous optical and radio/mm elementary
flares with symmetric profiles. Obviously, the observation data
currently available at 37, 22, 14.5 and 8 GHz are too sparse
to fulfill this task. However, we find that
at least for the main part of the optical outburst between JD2450050
and 2450090, the modeled total
flux curves at 37 GHz and 14.5 GHz wavelengths reveal variations on
short time-scales which can reasonably well fit the observed radio
peaks associated with the optical peaks. Thus the lighthouse effect in
producing the optical and radio/mm flares during the 1995.8 outburst
event has been confirmed. In order to further explore the correlation
between the optical and radio/mm variations on short time-scales
in OJ287, more contemporary observations at optical and radio/mm
wavelengths on daily sampling rates are required.
We further point out that the superluminal optical knots producing the
simultaneous optical and radio/mm flares near the nucleus
should continue to move outward along their trajectories and
evolve to form superluminal radio knots on parsec scales, which
emit at radio wavelengths, appearing as delayed radio flares.
5 Discussion
We have applied the precessing jet nozzle scenario previously proposed by
Qian et al. (e.g., Qi91 (1991), Qi13 (2013), QiXiv19 (2019))
to investigate and simulate the correlation between the variations
at optical and
radio wavelengths for the quasi-periodic optical outburst event during
1995.84–1996.10. Since the radio/mm data are very sparsely sampled, this
work can only be regarded as a preliminary examination. However, we have
found convincing evidence that the optical outburst can be decomposed
into a group of elementary flares and each of the optical elementary
flares emits simultaneous radio/mm emission. The simultaneous optical
and radio/mm variations can be reasonably well
interpreted in terms of lighthouse effect due to the helical motion
of the discrete superluminal optical/radio knots.
Combining with the results obtained in Usher (Us79 (1979)),
Holmes et al. (Holm84 (1984)), D’Arcangelo et al. (Da09 (2009)) and
Qian (QiXiv19 (2019)), we may tentatively
suggest that the quasi-periodic double-peaked outbursts in 1971–1973,
1983–1984, 1994–1995, 2005–2006 and the outburst in 2015.76 are
synchrotron flares produced within its relativistic jets
in OJ287. The superluminal optical/radio knots may have some
kind of stratified core-envelope structure
777Or shocks of spine-sheath structure as suggested in
D’Arcangelo et al. (Da09 (2009)). with its core region
dominating the optical
emission and the outer regions dominating the mm/radio emission. Thus
the optical and radio emission from the superluminal knots can be
Doppler boosted simultaneously due to lighthouse effect during their
helical motion.
Helical motion of superluminal knots may be expected on the basis of
magnetodynamic (MHD) theories for jet formation in spinning black-hole and
accretion-disk systems, in which relativistic jets are produced in the
rotating magnetospheres with strong toroidal magnetic fields. Thus helical
fields should permeate in the inner jet regions near the black holes (e.g.,
Blandford & Znajek Bl77 (1977), Blandford & Payne Bl82 (1982), Camenzind
Cam90 (1990), Li et al. Lizy92 (1992), Beskin Be10 (2010), Vlahakis &
Königl Vl04 (2004), Meier Mei13 (2013), Mei01 (2001)). It would be a
natural phenomenon that superluminal optical knots move along helical
trajectories, producing optical outbursts through lighthouse effect.
Unfortunately, only a few optical events have been observed revealing
this phenomenon (e.g., Schramm et al. Sc93 (1993),
Dreissigacker 1996a , Dreissigacker & Camenzind 1996b ,
Camenzind & Kronkberger Cam92 (1992), Wagner et al. Wa95 (1995)).
This work further strengthens the arguments proposed
in Qian (QiXiv19 (2019) that helical motion of superluminal optical knots
may prevail in blazar OJ287 and produce both quasi-periodic and
non-periodic optical outbursts, providing certain observational evidence
for the existence of helical magnetic fields in its inner jet regions.
Relativistic jet models (e.g., proposed in Qian QiXiv19 (2019) and
this work) can fully explain the emission properties from
radio, infrared, optical through to -rays observed in OJ287 and
a comprehensive and compatible framework has been tentatively constructed
for interpreting the whole phenomena in blazar OJ287, which involve
the following physical processes:
(1) OJ287 may host a supermassive black hole binary with comparable
masses for the primary and secondary holes in nearly co-planar eccentric
orbital motion with an orbital period of 9 yr (in the source frame);
(2) Both black holes may be spining (Kerr holes) and create their
respective jets, directing toward the observer with small viewing angles;
(3) Cavity-accretion processes may occur in this black
hole/disk system due to the interaction between the spinning black-holes,
the circumbinary disk and the circumdisks, causing complex mass
accretion events;
(4) The eccentric orbital motion of the binary modulates the
accretion flows onto the holes, resulting
in the quasi-periodicity of the accretion events and consequential optical
outbursts. The double-stream accretion flows during pericenter passages may
result in the double structure of the quasi-periodic optical outbursts;
(5) The accretion events created during the orbital motion would lead to
the ejection of superluminal optical knots through jet-formation mechanisms,
which emit at optical and radio wavelengths, including
quasi-periodic outbursts and non-periodic intervening outbursts.
In brief, it may be possible to describe the chain of the
physical processes as follows. The interaction between the binary holes
and the circumbinary disk results in double-stream accretion flows (e.g.,
Tanaka Tan13 (2013), Artymovicz Ar98 (1998), Shi et al. Sh12 (2012),
D’Orazio et al. Do13 (2013)) toward
the binary holes during pericenter passages, creating superluminal optical
knots ejected from the jets which produce the observed quasi-periodic
outbursts with double-peak structure. During the remaining parts of the
orbit the interaction between the holes and circumbinary disk also creates
enhanced accretion events, causing the non-periodic outbursts. The optical
outbursts consist of elementary flares, which are produced by a
succession of individual superluminal optical knots due to
lighthouse effect and blend together to form the complex outbursts.
If the relativistic jet scenario suggested in this work and
Qian (QiXiv19 (2019))
is correct, the optical phenomena in OJ287 coul be explained without
needing to invoke the disk-impact mechanism and thermal impact-outbursts.
However, the disk-impact mechanism looks
very attractive for testing the effects of general relativity
(Einstein Ei16 (1916), Ei18 (1918)), if the claimed accurate timing of the
primary quasi-periodic optical outbursts with uncertainty of 1 day is
really confirmed in future.
In order to test the relativistic models, more observational and
theoretical studies are needed. For finally clarifying the nature of optical
radiation from the primary quasi-periodic outbursts (thermal or
non-thermal), observations of -rays associated with the primary
quasi-periodic optical outbursts are
important. Complete information about the time-variable polarization
(both polarization degree and polarization angle) of the primary
quasi-periodic outbursts at multi-frequencies
are needed. Model fittings are also needed to
interpret the time-variable flux density curve I(), polarization
degree curve p() and polarization angle curve PA(,t).
Generally, if the low polarization dip observed in polarization
degree curves from the primary quasi-periodic flares is associated with
the rapid change in its polarization angle, this quasi-periodic flare
may be recognized as a synchrotron flare, originated from the relativistic
jet (see Holmes et al. Holm84 (1984)). Observational studies of the
correlation between variations in optical and radio
frequencies on time-scales of 1 day will be very helpful, because
radio variations simultaneous with the quasi-periodic optical outbursts
will certainly imply the optical outbursts being non-thermal.
For the relativistic models currently available, an unresolved problem
may be related to the timing of the primary quasi-periodic optical
outbursts. In principle, cavity-accretion
processes in comparable-mass and eccentric binary systems may provide
some solutions to the quasi-periodicity and double-peak structure of the
primary optical outbursts (Artymovicz Ar98 (1998), Tanaka Tan13 (2013),
Shi et al. Sh12 (2012), D’Orazio et al. Do13 (2013) and
references therein). But theoretical model-simulations of the cavity
accretion processes for specifically
fitting the primary quasi-periodic optical outbursts and their
double-structure pattern are required. Non-periodic optical outbursts
should also be included. It seems that in relativistic jet models
the quasi-periodic optical outbursts can not be accurately timed
as required in the disk-impact model. In fact,
for the optical outburst during 1995.8–1996.1 we can only recognize
the large synchrotron outburst during JD2450050–2450105 (see Figure 3).
The problem of outburst timing for OJ287 needs to be further investigated.
Acknowledgements.
I wish to thank Dr. M. Aller (University of Michigan, USA) for affording the 14.5 and 8 GHz data on the optical outburst in 1995.84. I am most grateful to Dr. K. Nillson (Turku University Observatory, Finland) for providing the optical data during the OJ-94 project.References
- (1) Ackermann M., Ajello M., Allafort A., et al., 2011, ApJ 743, 171
- (2) Agudo, I., Marscher, A.P., Jorstad, S.G., et al. 2012, ApJ, 747, 63
- (3) Allen, D.A., Ward, M.J., Hyland, A.R. 1982, MNRAS, 199, 969
- (4) Aller, M.D., Aller, H.D., Hughes, P.A. 1994, in: Workshop on Intensive Monitoring of OJ287, Tuorla Obs. Rep. Informo 174, ed. M.R. Kidger & L.O. Takalo (Turku: Univ. Turku), 60
- (5) Aller, M.F., Hughes, P.A., Aller, H.D. 2010, in “Fermi Meets Jansky - AGN in Radio and Gamma-rays”, Eds.: Savolainen, T., Ros, E., Porcas, R.W. and Zensus, J.A., p65
- (6) Aller, M.F., Hughes, P.A., Aller, H.D., et al. 2014, ApJ, 791, 53
- (7) Artymowicz, P., Lubow, S.H. 1996, ApJ, 467, L77
- (8) Artymowicz, P. 1998, in: Theory of Black Hole Accretion Disks, ed. M.A. Abramowicz, G. Björnsson, J.E. Pringle, p202
- (9) Basta, M., Hudec, L. http://altamira.asu.cas.cz/iblwg/data/oj287, 2006
- (10) Beskin, V.C. 2010, Physics-Uspekhi, 53, 1199
- (11) Björnsson, C.I. 1982, ApJ, 260, 855
- (12) Björnsson, C.I. & Blumenthal, G.R. 1982, ApJ, 259, 802
- (13) Blandford, R.D., & Znajek, R.L. 1977, MNRAS, 179, 433
- (14) Blandford, R.D., Königl A., 1979, ApJ 232, 34
- (15) Blandford, R.D., & Payne, D.G. 1982, MNRAS, 199, 883
- (16) Britzen, S., Fendt, C., Witzel, G., Qian, S.J., et al. 2018, 478, 3199
- (17) Brown, L.M.J., Robson, E.I., Gear, W.K., Smith, M.G. 1989, ApJ, 340, 150
- (18) Camenzind, M. 1990, Reviews in Modern Astronomy, Vol.3, 234
- (19) Camenzind, M. & Krockenberger, M. 1992, A&A, 255, 59
- (20) Cohen, M.H. 2017, Galaxies, 5, 12
- (21) D’Arcangelo, F.D., Marscher, A.P., Jorstad, S.D., et al. 2009, ApJ, 697, 985
- (22) Dey, L., Valtonen, M.J., Gopakumar, A., et al. 2018, ApJ, 866, article id. 11D
- (23) Doeleman, S.S., Fish, V.L., Schenck, D.E., et al. 2012, Science, 338, 355
- (24) D’Orazio, D.L., Haiman, Z., & Macfadyen A. 2013, MNRAS, 436, 2997
- (25) Dreissigacker, O. 1996a, in: Extragalactic Radio Sources, eds., R. Ekers et al., p421
- (26) Dreissigacker, O & Camenzind, M. 1996b, in: Blazar Continuum Variability (ASP Conference Series, eds. H.R. Miller, J.R. Webb, and J.C. Noble), Vol.110, p.377
- (27) Einstein, A. 1916, Sitzungberichte der Königlich Presssichen Akademie der Wissenshafte (SPAW, Berlin), 688
- (28) Einstein, A. 1918, Sitzungberichte der Königlich Presssichen Akademi der Wissenshafte (SPAW, Berlin), 154
- (29) Gupta, A.C., Agarwal, A., Mishra, A., et al. 2016, MNRAS, 458, 1127
- (30) Hartman, R.C., Bertsch, D.L., Bloom, S.D., et al.1999, ApJS, 123, 79
- (31) Hayasaki, K., Mineshige, S. & Ho, L.C. 2008, ApJ, 682, 1134
- (32) Hodgson, J.A., Krichbaum, T.P., Marscher, A.P., et al. 2017, A&A, 597, 80
- (33) Hogg, D.W. 1999, astro-ph/9905116
- (34) Holmes, P.A., Brand, P.W.J.L., Impey, C.D.,et al. 1984, MNRAS, 211, 497
- (35) Kikuchi, S., Inoue, M., Mikami, Y., et al. 1988, A&A, 190, L8
- (36) Königl, A. & Choudhuri, A.R. 1985, ApJ, 289, 173
- (37) Komatsu, E., Dunkley, J., Nolta, M.R., et al. 2009, ApJS, 180, 330
- (38) Kushwaha, P., Gupta, A.C., Wiita, P.J., et al. 2018a, MNRAS, 473, 1145
- (39) Kushwaha, P., Gupta, A.C., Wiita, P.J., et al. 2018b, MNRAS, 479, 1672
- (40) Lehto, H.J., & Valtonen, M.J. 1996, ApJ, 460, 207
- (41) Li, Z.Y., Chiueh, T.H., Begelman, M.C. 1992, ApJ, 394, 459
- (42) Meier, D.L., Koide, S., Uchida, Y. 2001, Science, Vol.291, 84
- (43) Meier, D.L. 2013, EPJ Web of Conference 61, 01001
- (44) Neronov, A. & Vovk, Ie. 2011, MNRAS, 412, 1389
- (45) Qian, S.J., Witzel, A., Krichbaum, T.P., et al. 1991, Acta Astron. Sin., 32, 369 (english translation: in Chin. Astro. Astrophys., 16, 137 (1992))
- (46) Qian, S.J. 2013, Res. Astron. Astrophys., 13, 783
- (47) Qian, S.J. 2015, Res. Astron. Astrophy., 15, 687
- (48) Qian, S.J., Britzen, S., Witzel, A., et al. 2017, A&A, 604, A90
- (49) Qian, S.J. 2018, arXiv-1811.11514
- (50) Qian, S.J. 2019, arXiv-1904.03357
- (51) Schramm K.-J., Borgeest U., Camenzind M.,et al., 1993, A&A 278,391
- (52) Shi, J.M., Krolik, J.H., Loubow, S.H., Hawley J.F. 2012, ApJ, 749, 118
- (53) Sillanpää, A., Teerikorpi, P., Haarala, S., et al. 1985, A&A, 147, 67
- (54) Sillanpää, A., Haarala, S., Valtonen, M.J., et al. 1988, ApJ, 325, 628
- (55) Sillanpää, A., Takalo, L.O., Pursimo, T., et al. 1996a, A&A, 315, L13
- (56) Sillanpää, A., Takalo, L.O., Pursimo, T., et al. 1996b, ASP conference series, Vol. 110 (Blazar Continuum Variability), eds. H.R. Miller, J.R. Webb and J.C. Noble, p74
- (57) Spergel, D.N., Verde, L., Peiris, H.V., et al. 2003, ApJS, 148, 175
- (58) Sundelius, B., Wade, M., Lehto, H.J., et al. 1997, ApJ, 484, 180
- (59) Takalo, L.O. 1996a, ASP Conference Series, Vol.110 (Blazar Continuum Variability), eds., H.R. Miller, J.R. Webb and J.C. Noble, p70
- (60) Takalo, L.O., Sillanpää, A., Lehto, H.J. 1996b, Mem.S.A.It., 67, 545
- (61) Tanaka, T.L. 2013, MNRAS, 434, 2275
- (62) Tateyama, C.E., Kingham, K.A., Kayfmann, P., et al. 1999, ApJ, 520, 627
- (63) Usher, P.D. 1979, Astron. J., 84, 1253
- (64) Valtaoja, L., Sillanpää, A., & Valtaoja, E. 1987, A&A, 184, 57
- (65) Valtaoja, E., Terasranta, H., Tornikoski, M., et al. 2000, ApJ, 531, 744
- (66) Valtonen, M.J., Lehto, H.J., Sillanpää, A., et al. 2006, ApJ, 646, 36
- (67) Valtonen, M.J. 2007, ApJ, 659, 1074
- (68) Valtonen, M.J. & Ciprini, S. 2012, Mem.S.A.It., 83, 219
- (69) Valtonen, M.J., Dey, L., Hudec, R., et al. 2018, in: Gravitational Waves Astrophysics: Early Results from Gravitational Wave Searches and Electromagnetic Counterparts, Proceedings of IAU Symposium, Vol. 338, p29
- (70) Valtonen, M.L., Zola, S., Jermak, H., et al. 2017, Galaxies, 5, 83
- (71) Villata, M., Raiteri, C.M., Sillanpää, A., et al. 1998, MNRAS 293, L13
- (72) Villforth, C., Nilsson, K., Heidt, J., et al. 2010, MNRAS 402, 2087
- (73) Vlahakis, N., & Königl, A. 2004, ApJ, 605, 656
- (74) Wagner S.J., Camenzind M., Dreissigacker O., et al., 1995, A&A 298, 688