Cross-user Similarities in Viewing Behavior for 360 Video and Caching Implications
Abstract.
The demand and usage of 360 video services are expected to increase. However, despite these services being highly bandwidth intensive, not much is known about the potential value that basic bandwidth saving techniques such as server or edge-network on-demand caching (e.g., in a CDN) could have when used for delivery of such services. This problem is both important and complicated as client-side solutions have been developed that split the full 360 view into multiple tiles, and adapt the quality of the downloaded tiles based on the user’s expected viewing direction and bandwidth conditions. This paper presents new trace-based analysis methods that incorporate users’ viewports (the area of the full 360 view the user actually sees), a first characterization of the cross-user similarities of the users’ viewports, and a trace-based analysis of the potential bandwidth savings that caching-based techniques may offer under different conditions. Our analysis takes into account differences in the time granularity over which viewport overlaps can be beneficial for resource saving techniques, compares and contrasts differences between video categories, and accounts for uncertainties in the network conditions and the prediction of the future viewing direction when prefetching. The results provide substantial insight into the conditions under which overlap can be considerable and caching effective, and inform the design of new caching system policies tailored for 360 video.
1. Introduction
Interactive streaming (Hosseini and Swaminathan, 2016; Son et al., 2018a; Ma et al., 2018; Toni and Frossard, 2017; Gaddam et al., 2016; Carlsson et al., 2017; Almquist et al., 2018) such as 360 video put the users in control of their viewing direction and have the opportunity to revolutionize what users expect from their viewing experiences. Already today, popular services such as Facebook and YouTube offer large catalogues of 360 content. With rapidly increasing 360 content catalogues and the introduction of inexpensive, easy-to-use interfaces, the demand for 360 streaming services can only be expected to increase.
With 360 streaming services being highly bandwidth intensive, identifying and understanding bandwidth saving opportunities in the wide-area delivery of 360 video is therefore becoming an increasingly important problem. Perhaps the most popular bandwidth saving opportunity studied in the research literature is based on the observation that, with 360 video, only a limited fraction of the full view (called the viewport) is displayed at each point in time. Motivated by this observation, to reduce the bandwidth usage and to improve the expected playback quality given a fixed bandwidth, different streaming delivery techniques have been studied that allow alternative playback qualities to be delivered for each candidate viewing direction (Hosseini and Swaminathan, 2016; Bao et al., 2016; Son et al., 2018a, b; Corbillon et al., 2017a; Lo et al., 2017).
With video delivery systems using HTTP-based Adaptive Streaming (HAS), a video is split into chunks (e.g., 2-5 seconds in duration) that are each encoded at multiple quality levels, allowing clients to adapt their playback quality based on current network conditions, for example, and to build up a buffer to protect against stalls that may be caused by future bandwidth variations. With 360 video, each chunk can further be split into multiple tiles, each corresponding to a portion of the 360 view. This division into tiles complicates prefetching, since now, when prefetching data from a future chunk, the client player needs to determine which tiles from the chunk to prefetch and a quality level for each. The prefetching policy must address a prefetch-aggressiveness tradeoff (Almquist et al., 2018) and balance the use of a larger buffer (to protect against stalls) against making prefetching decisions closer to the time of playback (improving predictions of future viewing directions). To address this problem various head-movement prediction techniques have been proposed and evaluated (Xie et al., 2018; Qian et al., 2016; Bao et al., 2016). However, prior work has not considered the implications of tiling and associated quality-adaptive prefetching techniques for 360 video on the performance of content caches.
This paper presents new trace-based analysis methods that incorporate users’ viewports (the area of the full 360 view the user actually sees), a first characterization of the cross-user similarities of the users’ viewports, and a trace-based analysis of the potential bandwidth savings that caching-based techniques may offer under different conditions. The paper has three main parts, with the second and third parts building on the prior parts. Furthermore, each part includes both novel methodological contributions and a trace-based characterization or analysis providing insights that can help guide the design of more effective caching policies and other related system solutions.
First, we focus on similarities in the viewports among different users when at identical playback points within the same 360 video. Here, we define basic similarity metrics such as the overlap in viewports for two or more users and study how the overlap between a viewport and the aggregate view cover from prior user views increases with the number of such users and how this differs between different video categories. This analysis provides insight into inherent similarities in viewing behavior, and the metrics are not affected by the details of how video data is delivered.
Second, we extend the metrics and analysis to evaluate the impact of chunk granularity on the insights from the first part of the paper. This analysis is important to understand how similarities in viewing direction would impact caching performance. For example, consider the case where two users have significantly different viewing directions at a particular time instant, and yet, over the time duration of a chunk, they have essentially the same viewport cover.
Finally, we present simulation results using a novel simulation model. The model captures steady-state performance of many independent sessions, while using only a limited number of traces. We simulate a proxy cache and evaluate the cache hit rates observed when using prefetching algorithms that attempt to adaptively select which tiles to download and the quality of each to optimize the user’s quality of experience. The observed cache hit rates (analyzed in Section 5) reflect not only viewing direction similarities, both at identical time instants (analyzed in Section 3) and over the time duration of a chunk (analyzed in Section 4), but also differences in chunk quality selections caused by bandwidth variations and uncertainties in viewing direction. The simulation results provide quantitative example comparisons and deliver insights into how viewing direction similarities and potential caching performance depend on the nature of the 360 video content.
Throughout our analysis we place particular focus on insights regarding differences seen when comparing categories of 360 videos. For this analysis, we use head-movement traces collected for different 360 categories (Almquist et al., 2018). For evaluation of cache performance, we combine the use of these traces with previously collected network measurements capturing a wide range of network conditions (Riiser et al., 2013; Linder et al., 2016). Of particular interest are insights into how the different categories are affected by bandwidth variations and other uncertainties that may impact the client’s quality of experience.
The results provide substantial insight into the conditions under which overlap can be considerable and caching effective. Particularly noteworthy perhaps are the substantial differences observed between different video categories and, in some cases, playback positions within the video, and the impact of prefetching accuracy on caching effectiveness. For example, the category of videos for which “the main focus of attention is deemed to always be at the same location in the video” (Almquist et al., 2018) appears to provide the greatest opportunities, among the categories we consider. However, this is not the case until 20-30 seconds into these videos, as viewers of these videos often have an initial exploratory phase during which viewing similarities are smaller compared to the category of videos in which the “object of attention is moving across the 360 sphere” or the category in which “the users take a virtual ride in which the camera is moving forward at a high speed”. Caching effectiveness is greatest when the viewing direction predictions used in prefetching are accurate and bandwidth conditions are relatively stable.
Our characterization and analysis results can inform the design of new caching system policies tailored for 360 video. For example, our results suggest that selective edge-cache insertion policies (Maggs and Sitaraman, 2015; Gast and Houdt, 2016; Carlsson and Eager, 2017, 2021) should consider the video category and when in a video a chunk occurs. Our results also have implications for other policies. For example, cache hit rate may benefit from cap-based network solutions that stabilize the bandwidth seen by individual clients (e.g., (Krishnamoorthi et al., 2018)). With respect to prefetching policies, our results show how the value of using the viewing directions of previous users for viewport prediction varies among different 360 video categories and, in some cases, also depends on the playback position.
The remainder of the paper is organized as follows. Section 2 presents background and introduces the head-movement dataset used here. Section 3 presents our metrics and analysis of viewing direction similarities between pairs of users at identical playback points, pairwise viewport overlaps, and viewport overlaps with aggregate view covers from different numbers of prior users. Section 4 extends these metrics and analysis to take into account the chunk granularities used, before Section 5 presents our trace-based simulations of cache performance under different network bandwidth conditions and uncertainties in viewing direction prediction accuracies. Finally, Section 6 presents related work, Section 7 summarizes design insights, and Section 8 concludes the paper.
2. Background and Dataset
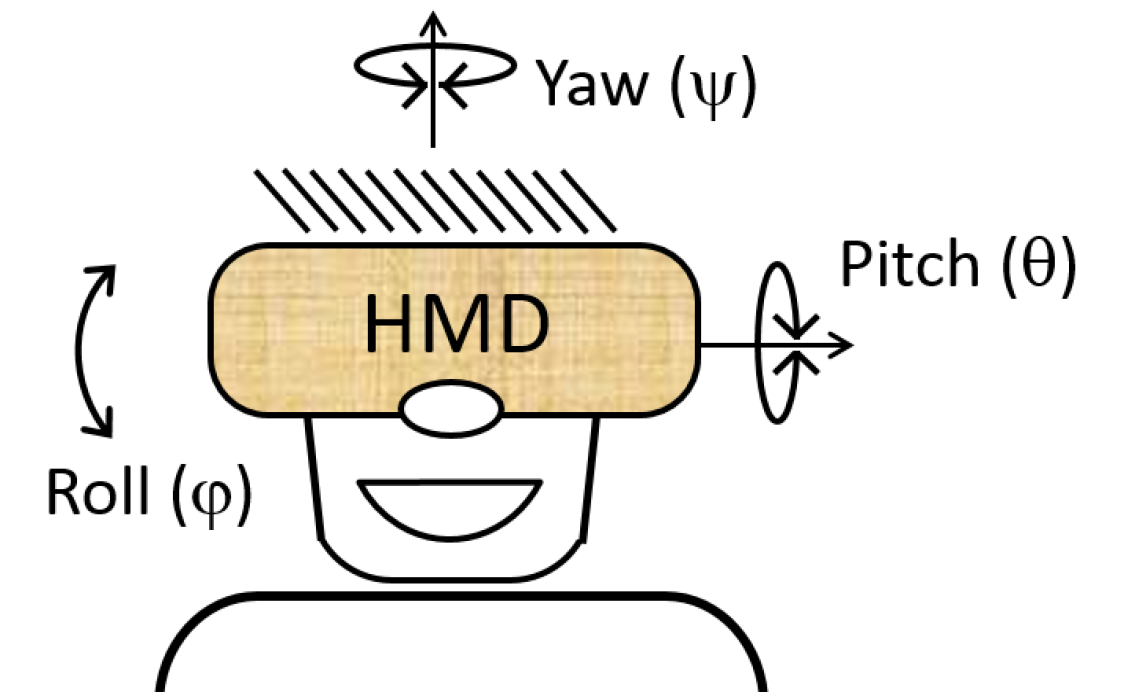
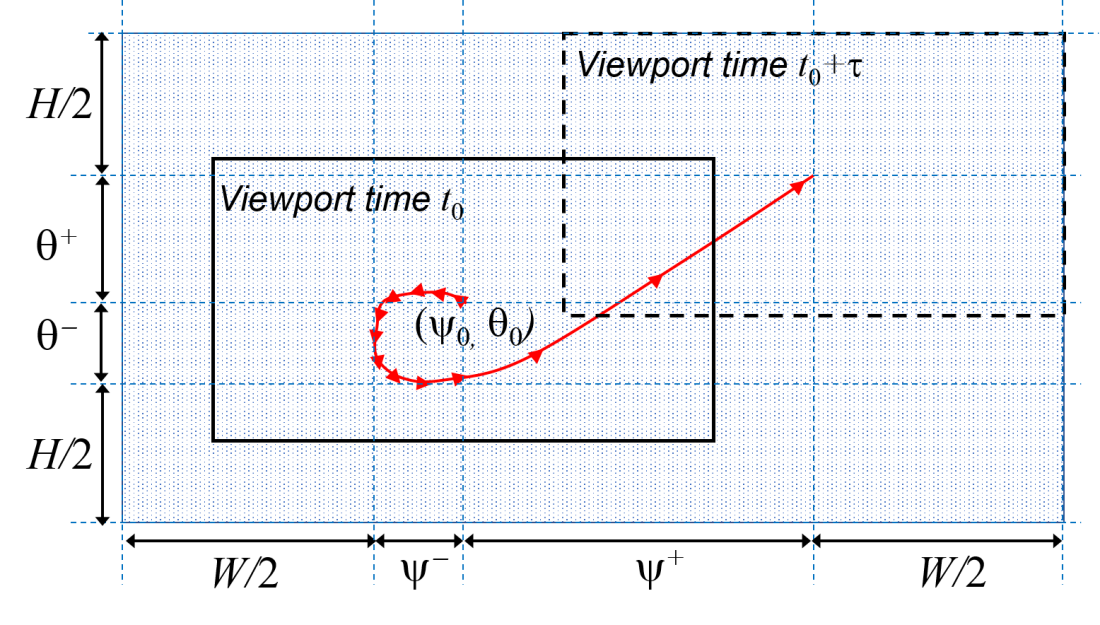
360 videos capture the view in all directions and allow users to look in any direction at each point during playback; e.g., by moving their head while wearing a head mounted display (HMD). While 360 videos also can be viewed in the browser on PCs, on smartphones, or on tablets, for the work presented here we assume use of an HMD. As illustrated in Figure 2, we characterize viewing directions using yaw, pitch, and roll. Yaw () measures sideways rotations (relative to a 0 line corresponding to the initial viewing direction as set in the video), the pitch () vertical head rotations (relative to a horizontal plane), and the roll () rotations of the head (relative to holding the head straight). All angles are measured in degrees and normalized so that two users will have the same recorded viewing direction at a given point during their viewing of the same video whenever their viewports completely overlap, regardless of original head positioning.
For our analysis we use a dataset collected by Almquist et al. (Almquist et al., 2018). The dataset consists of fine grained head-movement data collected when 32 people watched 360 videos from a set of 30 such videos. The videos were downloaded and played in 4K resolution, were 1-5 minutes long (3 min. on average), and were (by the authors) split across five categories (Almquist et al., 2018, p. 260): exploration (“no particular object or direction of special interest and the users are expected to explore the entire sphere throughout the video duration”), static focus (“the main focus of attention is deemed to always be at the same location in the video”), moving focus (“story-driven videos where there is an object of special interest that is moving across the 360 sphere”), rides (“the users take a virtual ride in which the camera is moving forward at a high speed, making users feel that they too are moving forward quickly”), and miscellaneous (“includes videos that were deemed to have a mix of the characteristics of the other categories or had a hard-to-classify, unique feel, to them”). While alternative classifications would be possible using machine learning, we decided to use these predefined categories, since they come with easy-to-understand human labels that simplify the interpretation of the results. For our purposes, this is desirable over classification clustering that may have higher coherent scores but may be more difficult to interpret. Of course, for studies that would try to optimize prefetching and caching policies, other choices may be desirable.
In total, the dataset includes head movements from 439 unique viewings (totaling 21 hrs and 40 min). The “semi-random” design of the user study ensured that all 32 users watched one “representative” video from each category (these videos were named “Zayed Road”, “Christmas scene”, “Christmas story”, “F1”, and “Hockey” in the Almquist et al. paper), while the other videos got between 8-13 views each. In this paper, we primarily focus on the representative videos for the first four (more well-defined) categories, but also report some summary results for the other videos. Since Almquist et al. found that yaw movements dominate, followed by pitch, with only small roll movements, we focus only on yaw and pitch.
There is very limited work on the topic of caching of tile-based 360 video implemented using HAS. However, like for regular HAS videos, we foresee clients to be directed through a proxy cache (e.g., within a CDN) where copies of tiles in different qualities can be stored after having been requested by prior clients. A client requesting a previously requested tile would hence be possible to serve from the cache, rather than the origin server. Such cache hits result in bandwidth savings, reduce the load on the origin servers, and help improve client performance (e.g., due to shorter round-trip-times and faster download times). Since each client still needs to perform their own bit-rate adaptation, make their own chunk requests, and their own tile selection independently, it is important to understand cross-user similarities in viewing behavior and their caching implications.
3. Similarity Characterization
In this section we present an initial characterization of the viewing similarities and differences between users watching the same video. For each video, we calculate and report summary statistics based on the viewing directions observed every 50ms. To account for the timestamps not always aligning perfectly between the traces, we use interpolation and note that good accuracy is ensured by the use of a measurement granularity of 10ms in the data collection.
3.1. Pairwise viewing differences
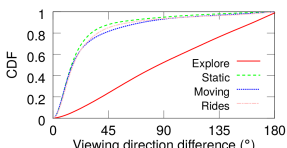
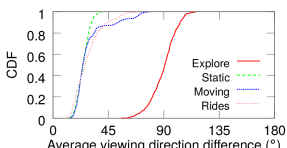
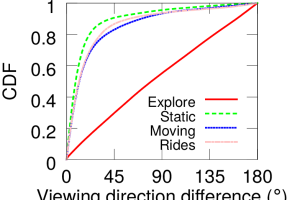
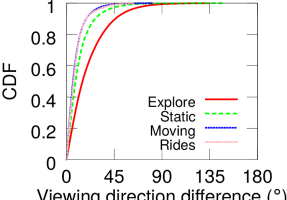
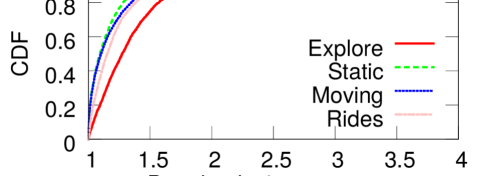
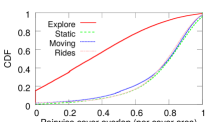
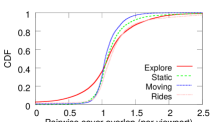
First, we consider the difference in viewing direction of two users at identical playback points within the same video. Figure 2 shows cumulative distribution functions (CDFs) of the pairwise differences, as measured by the angle between the viewing directions of two users at identical playback points. Here, we combine the differences in both yaw and pitch, for all pairs of viewing sessions of each of the representative videos. (For each of these videos we have 32 user traces and therefore 496 pairs.) In particular, Figure 2(a) shows CDFs for the differences, as measured every 50 ms throughout every pair of viewing sessions, and Figure 2(b) shows CDFs for the average of these differences for each session pair. For the average metric, we first calculate the average pairwise viewing difference for each possible session pair, and then report the set of average values (over all such pairs) as a CDF.
As expected, the pairwise differences are substantially larger for the explore category than for the other categories. For example, the close-to-straight explore line in Figure 2(a) suggests that the viewing directions of users watching explore videos are close to independent. In contrast, for the other categories the view angle differences are less than 45 for 80% of the time instances, showing that viewers of these other videos often are looking at the same parts of the video.
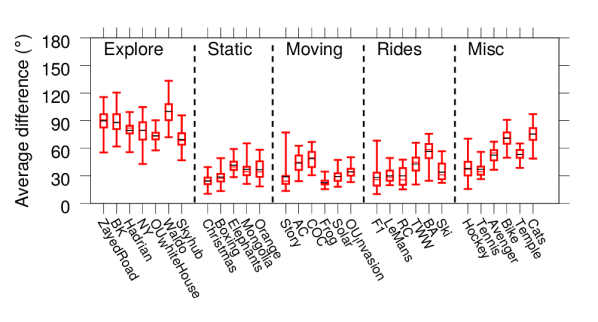
These significant differences among the categories are also clearly visible when considering the viewing direction difference averaged over the entire playback duration (Figure 2(b)) and when considering the average differences for the full set of videos in the dataset. Figure 4 shows the minimum over all pairs of sessions of the average viewing direction difference (bottom marker), 25-percentile (bottom of box), median (middle red marker), 75-percentile (top of box), maximum (top marker), and average (black marker) for each of the videos in the Almquist et al. dataset.
While the above results are based on the total directional differences across both yaw and pitch, the observations (and values) are very similar when focusing on yaw only. One reason for this is that the head movements are much smaller along pitch, with angular differences (again) most noticeable for the explore category. This is illustrated in Figure 4, which breaks down the angular differences observed in Figure 2(a) into yaw () and pitch (). The total directional differences (yaw + pitch) are also highly correlated with the differences seen for yaw only. For example, for the four representative videos the Pearson correlation coefficients of the two per-session metrics are 0.981, 0.923, 0.994, and 0.989 for the pairwise comparisons. (The corresponding correlations when using every per-instance measurement of the two differences are 0.977, 0.951, 0.987, and 0.984.)
3.2. Viewport-based metrics
Similarities in what content clients download and watch depend not only on the users’ viewing directions but more importantly on their viewports. Here, it is important to note that the overlap between two user’s viewports is determined by a combination of the viewing direction differences and the size of their viewports. We consider two types of viewports. First, we consider the 2D area of the viewing field being displayed (i.e., the area of immediate interest to the user). Let define this area, where and are the width and height of the viewport of consideration (as measured in degrees), respectively. Second, motivated by most head movements being along the yaw angle, we consider a sliced version, in which we ignore the pitch and only consider the yaw angle. While each user typically would only watch part of such a slice at each time instance, this abstraction better matches systems that opt to use vertical tiles (e.g., with higher quality in the range of typical pitch angles and somewhat lower quality downwards and upwards in the viewfield).
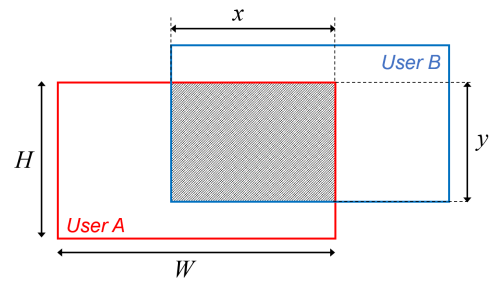
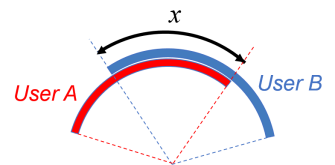
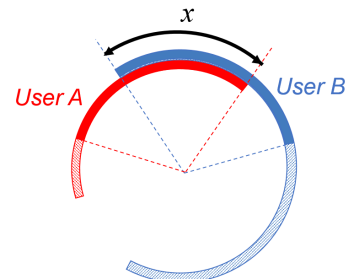
Pairwise viewport overlap: Consider the viewports of two arbitrary users A and B at the same playback point of the video. Figure 5(a) shows the viewport overlap when taking into account both the yaw and the pitch angle, whereas in Figure 5(b) we consider the yaw angle alone (this time observing the viewports “from above”). In both figures the viewports of users A and B are shown in red and blue, respectively, and denotes the overlap along the yaw angle. Furthermore, in Figure 5(a), denotes the overlap in pitch and the shaded area () shows the overlap when accounting for both angles. In the following, we report the normalized overlap, equal to and , respectively. In our calculations we account for wraparound effects along the yaw angle (using , where and are the yaw angles for the two users) but do not consider overlaps due to users catching a glimpse of what is behind them due to pitch angles outside the range (using , where and are the pitch angles for the two users).
Multi-user viewport cover and overlap: To gain insight into how the potential cache performance may be impacted by the number of users having watched a video, we also look beyond pairwise viewport overlaps and consider overlaps among larger sets of users. Specifically, we evaluate how the overlap between a viewport and the aggregate view cover from prior user views increases with the number of such users.
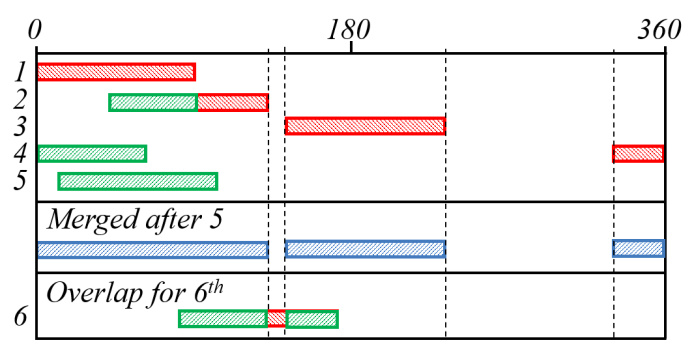
For this analysis, we use vertically sliced viewports. For each time instance and session sequence, we first merge the viewport coverage of all prior users into non-overlapping (merged) viewport areas (as represented by the blue rectangles in the example shown in Figure 7(a)). Then, we calculate the overlap with the current user’s viewport (overlap represented by the bottom green rectangles in Figure 7(a)), before adding this user’s viewport to the merged intervals and repeating the calculations for the next user in the sequence. In summary, for each user, we simply repeat the overlap calculations (last row) and merge step (second last row) illustrated in Figure 7(a) to calculate the overlap and combined coverage respectively.
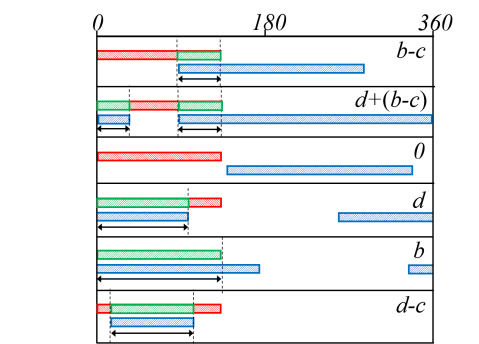
By keeping track of the list of non-overlapping intervals that have been merged thus far (including updating the list for each new client), we can calculate the intersections that the viewport of the latest client has with the intervals associated with all prior clients using an efficient one-pass algorithm in which we simply consider the clients in the order that they arrive to the system. (This is implemented using a structure that keeps track of all intervals merged thus far and considering the viewport of one client at a time.) For each such client, both the calculations needed to merge intervals and to calculate intersections of intervals require a significant number of cases to consider. Figure 7(b) illustrates the six intersection cases that arise assuming that the most recent viewport goes from to , and the (merged) interval from prior user sessions results in a single interval that goes from to (modulus 360, accounting for wraparound).
3.3. Pairwise viewport overlap
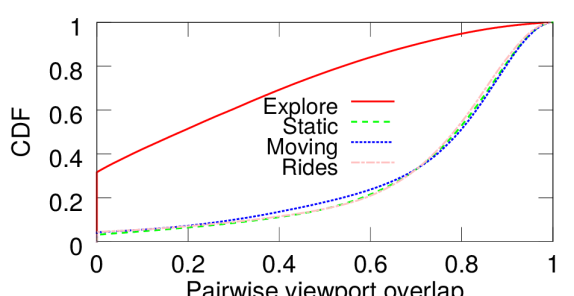
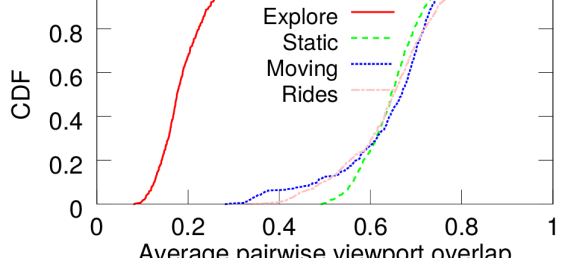
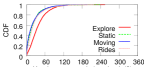
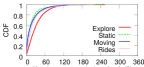
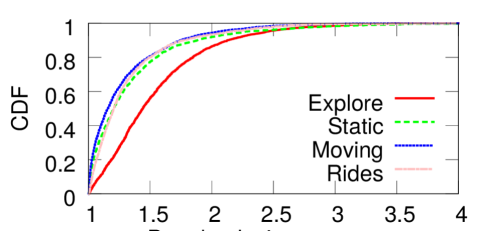
Results for representative videos: Figure 7 shows CDFs of the normalized pairwise overlap for the representative videos when using a 12067.5 viewport. Here, Figure 7(a) shows CDFs for the pairwise overlap at identical playback points (as measured every 50 ms for every possible viewport pair) and Figure 7(b) shows CDFs for the average of these overlaps for each session pair. (For the average metric, we first calculate the average pairwise viewport overlap for each possible session pair, and then report this set of average values as a CDF.) As before we observe significant differences when comparing the explore category with the other categories. For example, with the explore video, more than 35% of the time there is no pairwise overlap, whereas for the other categories there is at least a 50% overlap in more than 80% of the instances. (See Figure 7(a).) Furthermore, considering the average normalized pairwise viewport overlap (Figure 7(b)), no pair of explore sessions had an average overlap of more than 40%, while less than 6.5% of the moving session pairs, less than 1% of the rides session pairs, and none of the static session pairs had an average overlap that did not exceed 40%. In fact, for these three categories, more than 70% of the sessions see an average overlap of at least 60%.
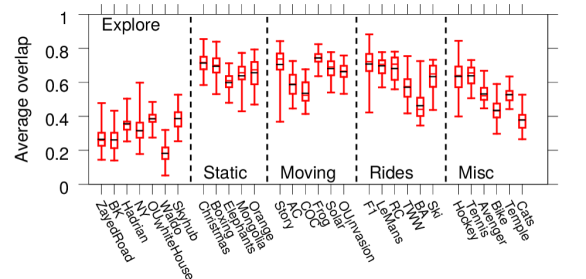
Results for other videos: Similar large differences were observed when calculating the average normalized pairwise overlap for other videos, as seen in Figure 9, which shows per-video box-and-wisker plots for a 12067.5 viewport. Figures 7 and 9 suggest that there may be substantial caching opportunities for videos in the static, moving, and rides categories.
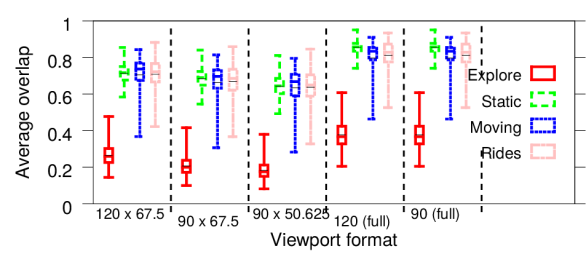
Impact of viewport: Figure 9 shows similar summary statistics for the representative videos for five alternative viewports (the last two ignoring differences in pitch). We note that as the viewports become larger, the overlaps increase.
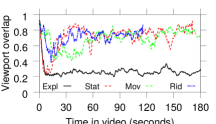
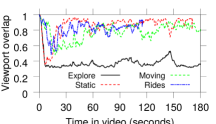
Longitudinal playpoint dependencies: Note that pairwise overlaps vary over the playback duration. For example, all clients start with the same viewing direction and prior work (Almquist et al., 2018) has shown that with static videos there is often an initial exploration phase. Figures 10(a) and 10(b) show the overlap averaged over all session pairs as a function of the time from the start of the video, for two example viewports. In addition to smaller initial average overlaps for the static video, resulting from initial exploration, we also observe a somewhat smaller average overlap at the beginning of the videos in the rides and moving categories than towards the end of those videos. This suggests that cache hit rates may improve over the duration of many video sessions.
3.4. Viewing sequence analysis
Consider next each client’s viewport overlap with the aggregate view cover from prior user views as a function of the number of such users. For each representative video, we created 1,000 random orderings of the 32 viewing sessions recorded in the dataset for that video, and for each sequence and viewing session, evaluated the overlap at identical playback points between the respective user’s viewport and the aggregate viewing area covered by all prior users in that viewing sequence.
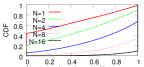
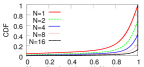
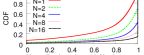
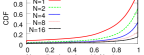
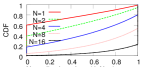
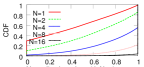
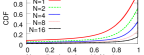
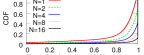
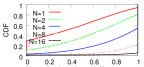
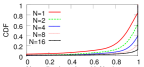
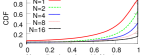
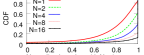
Category and viewport dependencies: Figure 11 shows CDFs of the normalized viewport overlap for the representative videos and different numbers of prior users , where the CDFs are each over all 1,000 random sequences and all playback points at a granularity of 50 ms. Here we used a sliced viewport with width . As expected, looking at the extremes, for small , we note a big point mass in the distribution at a normalized overlap of 0 for the explore video, and for large we observe a big point mass at a normalized overlap of 1 for all videos. These cases result in big steps in the CDFs taken at the x-values of x=0 and x=1, respectively. More generally, we note that there is a substantial increase in the normalized overlap as increases, but with diminishing returns with each doubling of . (For example, the lines are for the most part spaced closer and closer to each other with each doubling of .) We also note that as increases and the CDFs approach the ideal case with all probability mass concentrated at a normalized overlap of 1, the differences between the results for the representative videos diminish. In fact, for and , the distribution of the normalized overlap with the explore video (Figure 12(b)) has greater mass on larger values than that for the other representative videos (as exemplified by the static video in Figure 12(d)). More generally, differences between categories, as seen in Figure 12, are larger for smaller viewport sizes and for smaller .
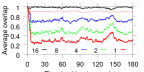
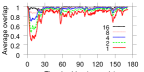

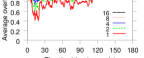
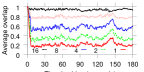
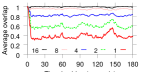
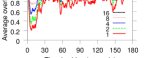
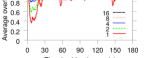
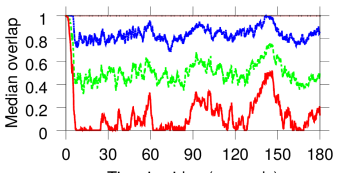
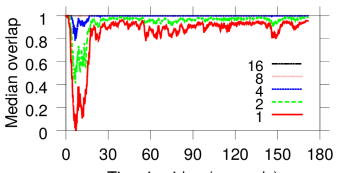
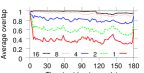
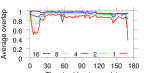
Longitudinal evaluation: The above observations also hold when considering the normalized overlap observed over time. Figures 13 and 14 show the corresponding timeline plots of the average (over the 1,000 random orderings of viewing sessions) normalized viewport overlap. Note that the benefits of more prior video viewings increase when there is more variability in where users are looking (e.g., explore videos or the beginning of the static video). Interestingly, the improvements are even larger for median overlap, as seen in Figure 16. The larger median improvements show that most sessions quickly see significant benefits from each additional prior client. For example, with just four prior clients, in the case of the static video, most clients have 100% overlap from roughly the 15 second mark.
4. Chunk granularity analysis
It is important to remember that caching (and video delivery itself) typically is done on a per-chunk basis. The viewing direction (and hence also the tiles seen within the viewport) may change during the playback duration of a chunk, resulting in a larger per-chunk viewport cover (defined next) than the viewport at an individual playback point. The overlaps between per-chunk viewport covers and those of prior clients are important in caching. We next study and report on per-chunk statistics.
4.1. Changes in viewing direction
Figure 16 illustrates how the total viewing field covered during the playback period of a chunk, and the maximum changes in viewing direction during this time period, are determined from the fine-grained head movement data in our dataset. Here, denotes the time at which the chunk starts playback, and its duration. For this time period, the small head movements that were captured at a 10ms granularity in the trace data are used to calculate the maximum accumulated changes to the left (i.e., ), to the right (i.e., ), upwards (i.e., ), and downwards (i.e., ), relative to the original viewing direction () at time . Using fine-grained measurements allows us to keep track of wraparound effects and ensures accurate calculation of these values.
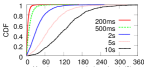
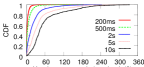
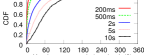
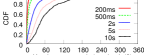
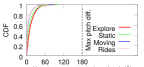
Impact of chunk granularity: Figure 17 shows CDFs of the bound on the maximum viewing direction change over a chunk duration, given by , for the representative videos and a range of chunk durations (200ms-10s). As before, the explore category stands out, with much larger head movements. However, note that for intermediate chunk durations (e.g., 2s), the head movements still only cover a small fraction of the view field. For example, for the representative videos the maximum viewing direction changes for 80% of the chunks are upper bounded (as per the above formula) by 57.7, 34.5, 36.3, and 38.7, As shown in Figure 18 for the case of 2s chunks, the results are similar regardless of whether both yaw and pitch are considered (as in Figure 17) or only the maximum yaw change. Here, we break down the total movement (Figure 18(a)) into yaw only (Figure 18(b)) and pitch only (Figure 18(c)). The pitch movements are again more restricted and contribute significantly less to the total movements. There is a high Pearson correlation between the total head movement over a chunk duration and the yaw movement only (e.g., 0.961, 0.957, 0.978, 0.979 for the four videos when using 2s chunks).
4.2. Viewport-based metrics
Per-chunk viewport cover: To measure the total viewing area that is included within a user’s viewport for at least some portion of a chunk’s playback period, we calculate a bounding box of the head movements during this time period using fine-grained measurements from our dataset. We define the bounding box as the per-chunk viewport cover, with size given by: , where are the maximum changes in each direction over the full playback duration of the chunk. In the following, we report per-chunk viewport covers normalized by the total size of the viewport (i.e., we divide by ). For the sliced viewport (ignoring pitch), the calculation reduces to simply .
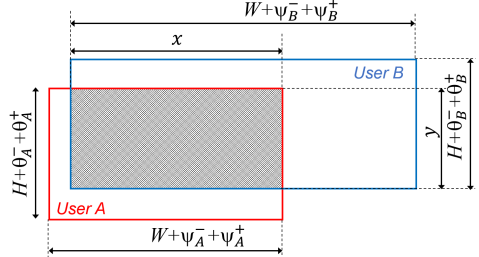
Pairwise cover overlap: We next combine our techniques for analysis of pairwise viewport overlap and for determining per-chunk viewport covers, to measure the pairwise overlap in per-chunk viewport cover. Figure 19 illustrates how this metric is calculated for two users A and B for a particular chunk. Here, user A has the per-chunk viewport cover illustrated by the red box, and user B’s corresponding viewport cover is given by the blue box; both bounding boxes calculated as described above. To calculate the overlap when considering both dimensions (Figure 19(a)) or when considering only the yaw angle (Figure 19(b)), we extend the methodology used for calculating overlapping viewports to account for the two bounding boxes being of different size. A case-based analysis is used for this extension (similar to for the yaw-only case shown in Figure 7).
4.3. Per-chunk viewport cover
Results for representative videos: Figure 21 presents CDFs of the normalized per-chunk viewport cover size for each of the four representative videos, for 2 second chunks, and two viewport sizes (12067.5 and 90 full) with maximum theoretic normalized cover sizes of 8 and 4, respectively. Note that the coverage is typically much smaller than the theoretic maximum. For example, with the sliced 90 full viewport, 80% of the chunks have a normalized cover size of at most 1.57, 1.28, 1.35, and 1.38, respectively, for the four representative videos. These small cover sizes suggest that tiles could indeed fruitfully be prioritized (by a client) on a per-chunk basis since a significant portion of the potential viewing area is not viewed during the playback of a chunk.
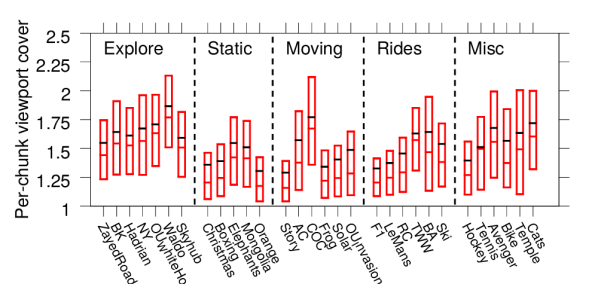
Results for other videos: The above observations are relatively consistent across the videos in each category, as shown in Figure 21 for a 12067.5 viewport (for which the maximum theoretic normalized cover size is 8). To improve readability, we omit whiskers for minimum (always 1) and maximum. While the relative differences between the video categories in these results (e.g., looking at averages or medians) are less apparent than for the pairwise differences in viewing directions (e.g., Figures 4 and 9), we typically see the largest head movements associated with videos in the explore and miscellaneous categories and the smallest in the static category (even when taking into account that these videos often have an initial exploration phase). Furthermore, we note that the normalized per-chunk viewport cover size is less than two (i.e., less than double the viewport size) for more than 75% of the chunks for all but two videos: Waldo (explore) and COC (moving).
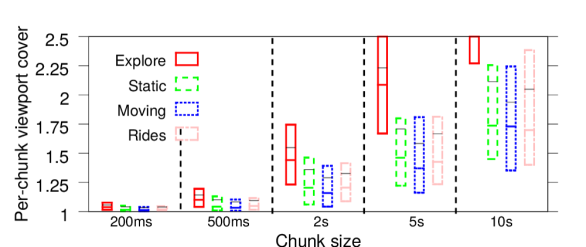
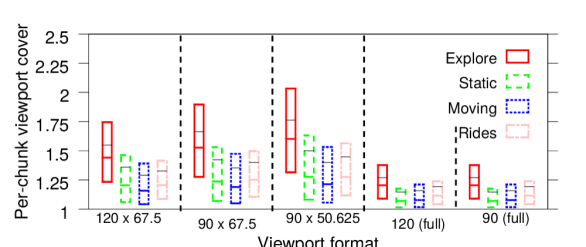
Impact of chunk duration: Figure 23 shows the impact of the chunk duration on the normalized per-chunk viewport cover size for the representative videos. Focusing on the 75-percentile values, except for the cases of (i) explore using a chunk duration of 5 or more seconds, and (ii) extremely long duration chunks of 10 seconds, the normalized per-chunk viewport cover size is again consistently below 2. In general, for static, moving, and rides this cover size is substantially smaller. Again, the small normalized per-chunk viewport cover values suggest that prioritizing of tiles may be most suitable for these categories. These observations are relatively consistent across different viewport formats, as illustrated in Figure 23. Note that the 75-percentile values again remain below 2 except for the representative explore video using the smallest of the considered viewports (i.e., 9050.625).
4.4. Pairwise cover overlap
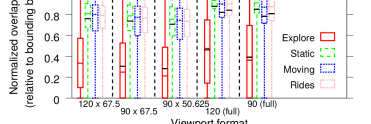
Results for representative videos and example viewports: The first two sub-figures in Figure 24 show the pairwise overlap in per-chunk viewport cover normalized relative to the size of the user’s bounding box (i.e., ) and relative to the viewport size (i.e., ), respectively, when using a 12067.5 viewport, and the third sub-figure shows summary statistics (of the first kind) also for other viewports. The two metrics capture the pairwise similarities after accounting for the head movement variability seen over the playback duration of a chunk. The first metric uses the bounding box to normalize the overlaps against the head-movement variations themselves, while the second metric uses the viewport size itself (which always is the same size, regardless of head movements). Per their definition, the first metric can have values no greater than 1, whereas the second metric can. We note that the explore category stands out even more than we have seen before, when considering the overlap normalized relative to the bounding box size (Figures 24(a) and 24(c)). For example, referring to Figure 24(a), while there is at least a 60% overlap in cover for 79-83% of the chunks for the static, moving, and rides videos (83%, 79%, and 83%, respectively), the corresponding fraction of chunks is only 23% for the explore video. (Note that these overlap coverage values are the complementary values to those shown in the figure.) This reflects the fact that the videos in the explore category typically have both larger head movements during a chunk duration, and larger pairwise viewing direction differences (including during the chunk playback period). Furthermore, the variations in the absolute overlap (e.g., as normalized relative to the viewport size, as in Figure 24(b)) are much greater for the explore video, and conversely, the variations are smallest for the static video.
4.5. Request sequence analysis
We next extend our analysis of the overlap with the aggregate view cover from prior user viewings of the same video to account for chunk boundaries. Throughout this section we use 2 second chunks, a sliced 90 viewport, and normalize the reported cover overlap relative to the size of the cover of the user of consideration. In general, the distribution statistics of the overlap between the current user’s per-chunk cover and prior users’ cover for the same chunk (Figure 26(a)) are similar to the corresponding statistics for individual playback points (Figure 11). However, the larger head movements and bigger differences in viewing directions associated with the explore video result in even greater gains in overlap as the number of prior users increases. In fact, with 16 prior user viewings the overlap is greater than 99% (of the user’s cover) for 94.7% of the chunks for the explore video, compared to 88.8%, 86.0%, and 88.5% for the other videos. These results suggest that significant cache hit rates may be achievable already after a limited number of users, at least if they experience similar bandwidth conditions. These observations are also apparent when considering the overlaps seen across the playback durations of the example videos (Figure 26). Note the larger overlaps compared to those in Figure 13, although the qualitative differences among the results for the representative videos are quite similar. In fact, during the first 120 seconds of the explore video and the initial explore phase of the static video the average overlaps when there are =8 and =16 prior users are close to one. In general, however, the overlaps when there are fewer prior users (e.g., =1, =2, and =4 curves) are greater when users are less exploratory (e.g., with moving, rides, and after the initial exploratory phase of the static video). These chunk-level results again highlight important differences in the caching opportunities that different video categories present, and that videos of some categories (e.g., static) may require different optimizations for the initial (exploratory) phase than the later parts of the videos.


5. Cache Performance Simulations
Our trace-driven cache simulations are designed to take into account and study multiple sources of uncertainty that impact prefetching and caching performance. First, network bandwidth varies over time and clients do not know their future bandwidth. Second, with different scenes requiring different encodings, for example, chunk sizes typically vary from chunk-to-chunk and across different parts of the same video. These first two uncertainties result in variable download times and buffer sizes, as clients adapt the requested encodings so as to try to maintain a relatively stable buffer and to avoid stalls. Third, as seen here, with 360 video there is a lot of variability and uncertainty in how users move their heads. The client player can try to predict head movements and prefetch high quality tiles only for some directions, but prediction accuracy will vary across videos, prediction algorithm used, as well as over time during video playback.
5.1. Simulation model
To better understand the impact that download time variability and the view direction prediction accuracy have on the cache efficiency under different quality selection algorithms, we use a simple simulation model where we use probability distributions to capture each of the uncertainties.
In our model, we assume that client player makes its tile selection for each chunk based on a quality of experience (QoE) optimization problem taking into account (i) the capacity drawn from a distribution , and (ii) the probability that a specific tile will be viewed (where the probability depends on the class of videos considered and how far in advance of playback the client must make its tile selection for the chunk). We next present the optimized tile-selection algorithm used for our (default) simulations in which we assume a horizontally sliced viewport.
Optimized tile selection for sliced viewport: Each client greedily maximizes the objective function proposed by Almquist et al. (Almquist et al., 2018):
where is a weight factor giving more (or less) weight to the importance of small quality differences between neighboring tiles in the 360 space versus high expected viewing quality, and is a concave utility achieved when viewing at quality . At each step of the simulation, each client maximizes this objective function given the capacity constraint that , where is the size of tile . To find the optimal solution for a given and we solve the above optimization problem using dynamic programming (Almquist et al., 2018).
Greedy tile selection for general viewport: For the case when we have a 2D grid of tiles, we implemented a greedy approach based on the slightly modified objective function:
where if tiles and are direct neighbors (share a side, accounting for wrap-around effects) in the grid, and 0 otherwise. For the greedy allocation we simply started with a zero-bandwidth allocation for each tile, and then greedily allocated more and more bandwidth as long as there was free bandwidth to allocate from the total bandwidth budget (for client , chunk ) and there existed at least one more feasible allocation that can be made. Here, in each step, we selected to increase bandwidth (one quality level) for the tile that maximized the relative increase in utility per consumed bandwidth unit and that still fits within the capacity constraint. In particular, in each step we select to increase the quality level (and bandwidth allocation) to the tile that maximizes the ratio , where is the objective function if applying the change (“new” allocation) minus the objective function with the “old” allocation.
Impact of view prediction accuracy: Finally, to account for the third uncertainty, the predicted viewing direction used when solving the optimization (or finding a good greedy allocation) is offset from the actual viewing direction at playback time by an angle (or +) chosen by sampling from a probability distribution (or ).
Independent simulation steps for each chunk: To remove dependencies on the specific HAS algorithm in use (as these are still evolving), head movement prediction algorithm used (as the quality of these differ and some quickly are improving), and the long-term effects of a cache miss and other factors that may impact HAS performance (depending on algorithms used) over a longer period, we simulate each chunk of each video individually. We next describe how our simulations are done for the sliced viewport simulations. The general case naturally extends from this as per the above uncertainties and alternative chunk-selection algorithm.
To obtain a hit rate estimate for a particular video and number of previous clients, we average results from 1,000 simulations, each with 32 randomly ordered users sequentially viewing the video. Each client uses the user head movements recorded in our trace dataset for that user when viewing the respective video. For each chunk prefetch request within each viewing, we (i) draw a random capacity from the distribution , (ii) draw a random offset from the distribution , (iii) use the actual viewing direction that the user has at the start of the playback of the chunk and to determine the center tile used for the optimization, (iv) solve the above optimization problem using the and the distribution (rotated by ), and (v) download the qualities of tiles for the chunk that are determined by the optimization. To emulate the behavior of a cache, we keep track of prior client requests for tiles of the same chunk. For our simulation we assume that the system always starts with an empty cache and measure how the hit rate (both in terms of tile objects and bytes delivered) changes as more and more users view the same video.
Limitations discussion: We do not model the buffer states of individual clients, correlations in the chunk qualities that individual clients may request for back-to-back chunks, or the correlations between the bandwidths that clients may observe during download of consecutive chunks. While these aspects may help model the quality of experience and performance of individual clients, they are not needed to capture the performance of a network or server-side cache. In fact, by treating each chunk individually and drawing independent bandwidth samples each time, we avoid having to make additional simplifying system assumptions about the clients and, most importantly, avoid introducing persistent biases (e.g., client A may have higher bandwidth than client B) that persists throughout each sample session of our longitudinal analysis. Instead, in our simulations, each sequence of requests for a chunk can be seen as an independent experiment, effectively increasing the statistical significance of our results (across all chunks), given the same number of simulations.
5.2. Parameters and example distributions
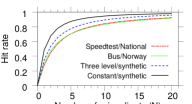
Bandwidth variations: For the distribution we use distributions obtained by drawing random samples from two real-world datasets, and two synthetic distributions. The real-world datasets are: (i) 10,000 download bandwidth measurements collected by mobile 3G and 4G users of a dominant national speed testing service (Linder et al., 2016) over a 19-hour window on Feb. 15-16, 2015, and (ii) 10,000 sample points from “bus” commuter traces collected in Norway by Riiser et al. (Riiser et al., 2013) between Aug. 28, 2010, and Jan. 31, 2011. The synthetic distributions we use are: (i) a distribution in which the bandwidth capacity varies across three different levels such that is equal to the average bandwidth 40% of the time, twice the average 20% of the time, and half the average 40% of the time, and (ii) a constant bandwidth capacity. To account for the fact that bandwidths have increased substantially since the traces in the real-world datasets were collected (2015 and 2010-2011, respectively) and to ensure a fairer comparison across the different distributions, we scale the bandwidths in the real-world datasets and choose parameters for the synthetic distributions so that the average bandwidth in each case is the same. We use normalized units so that a normalized bandwidth of 1 corresponds to that needed to deliver all tiles at the maximum quality.
Head movements, their prediction uncertainties, and optimized quality selection: For simplicity, consider the sliced viewport model. (The general viewport model extends naturally as per the differences described in the previous section.) To determine choices for the and distributions, we used the yaw angle changes in the traces from the head-movement dataset over different time intervals and for different video categories. With the averages close to zero and the CDFs following s-shaped distributions (Almquist et al., 2018), we decided to approximate yaw angle change distributions using normal distributions and used these (or variations) for the uncertainty in yaw prediction and the uncertainty in head movements used for the optimizations. Table 28 reports the standard deviations observed for each video category and four different time intervals. Clearly, the best distribution to use here would depend on the prediction techniques being used and there can be both better and worse predictors of future head movements than simply using the current viewing direction (as implicitly assumed here). For this reason, we apply a scaling factor on these measured standard deviations, with a factor smaller (greater) than one capturing a more (less) accurate prediction of the future viewing direction. Similarly, we use a factor to scale the standard deviation used for the quality selection optimization distribution , with a factor smaller (greater) than one capturing a more (less) concentrated distribution. As our default values we use the 10 second values of each category with .
Finally, for the default simulation results presented here, we consider a sliced 360 video with each 2-second chunk split into 6 tiles, each covering 60 degrees, and for which the tile encoding rates are each proportional to one of seven quality levels: 0 (tile is not fetched), and, in normalized units, 144, 268, 625, 1124, 2217, and 4198 (corresponding to the quality levels in an example YouTube video). For the dynamic programming optimization, we use these integers as the corresponding tile sizes together with a default average bandwidth of 12,000, resulting in a normalized average bandwidth of 12000 / (4198 6) = 0.476 (allowing benefits from quality-adaptive tile delivery similar to those in prior works (Bao et al., 2016; Hosseini and Swaminathan, 2016; Qian et al., 2018)). For the utility function we extend the large-screen model by Vleeschauwer et al. (Vleeschauwer et al., 2013) to include a “black-out penalty” associated with a missing tile:
where , , and are parameters with values chosen as 2, 10, and 200, respectively, to match their large-screen model, and the negative utility when captures the black-out penalty.
5.3. Example results
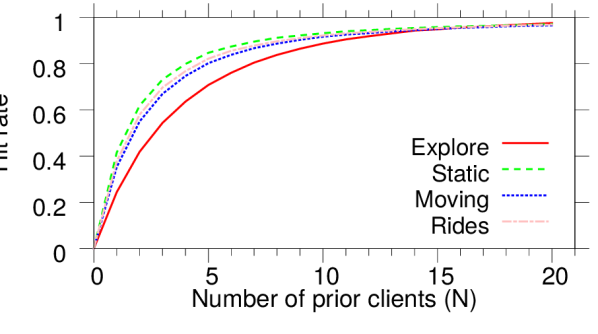
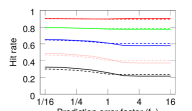
In this section we focus on the hit rate as a function of the number of prior users that have watched the same video. Each result for a particular video and scenario is an average from 1,000 simulations, each using a random ordering of the 32 user sessions for that video from our trace dataset.
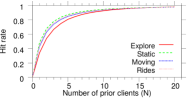
Results for representative videos: Figure 28 shows a baseline comparison of the tile object hit rates for the representative videos, using the 10 second values from Table 28 and . This figure clearly illustrates that better cache performance is achieved with the static, rides and moving videos compared to with the explore video. This observation is not surprising given the results reported in previous sections, and is also consistently seen with other distribution and parameter settings. For example, with four prior clients (i.e., ), the object hit rate for the static, rides, and moving videos ranges between 0.75-0.80, while for the explore video it is only 0.64. Higher hit rates can be directly translated into reduced loads on origin servers and the shorter round-trip-times to caches (than origin servers) can be translated into improved streaming performance for clients. However, these differences can also have a large impact on bandwidth requirements and cache write costs; both proportional to the miss rate. For example, for = 4, the object miss rate for explore is 80% higher (a factor of 0.36/0.20) than for the static video. In the reminder of this section we present results only for the two extreme cases of static and explore videos, but note that the results for rides and moving are relatively similar to those of static.
| Standard deviation | ||||
|---|---|---|---|---|
| Category | 500 ms | 2 sec | 5 sec | 10 sec |
| Explore | 17.24 | 50.77 | 79.85 | 94.09 |
| Static | 14.23 | 35.94 | 46.32 | 46.93 |
| Moving | 14.69 | 35.77 | 48.10 | 57.42 |
| Rides | 15.05 | 38.94 | 50.02 | 52.44 |
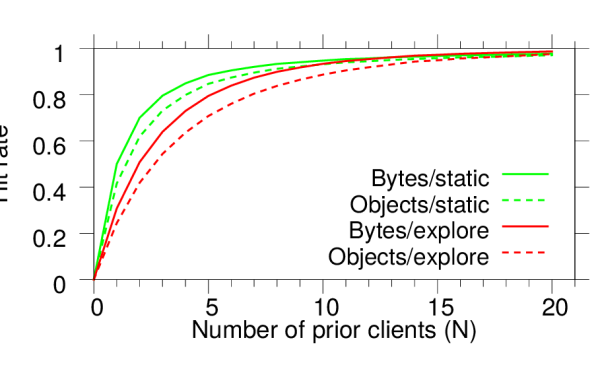
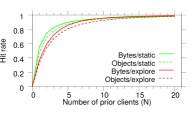
Object vs byte hit rates: Figure 28 compares the byte and object hit rates for the static and explore videos with our default parameter settings. The higher byte hit rates suggest even better cache benefits than suggested by the object hit rate results. The observed differences in byte hit rate (between classes) can have a large impact on bandwidth requirements. For example, with four prior clients, the byte hit rate for the explore video is 0.73 while that for the static video is 0.85, implying an 80% higher byte miss rate for the explore video.
Impact of client’s bandwidth variability: As seen in Figure 30, hit rates typically reduce the greater the bandwidth variability. Note however that the relative impact of bandwidth variability is smaller for the explore video than the static video, showing that higher uncertainty in viewing direction and bandwidth do not contribute independently to reduced hit rates.
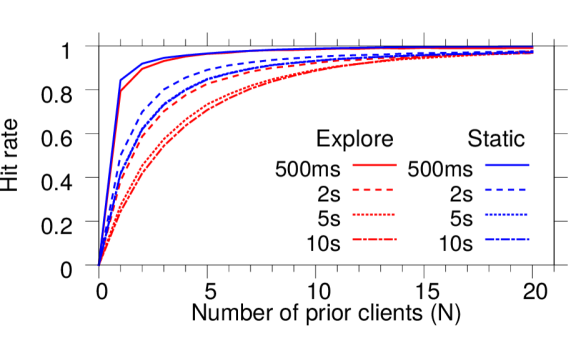
Impact of time threshold T: Better head movement prediction is possible on shorter time scales, whereas better stall protection is achieved using larger buffers that account for chunk size variations, long round-trip-times (RTTs), or variations in the RTTs and the available bandwidths. To glean insights into the tradeoffs associated with how soon head-movement predictions are made, Figure 30 shows results for the exploration video (red) and static video (blue) for the head-movement uncertainties observed over four different time intervals: 500ms, 2s, 5s, and 10s. As expected, the cache performance improves substantially as smaller buffer margins are used. However, it is important to note that most practical systems are likely to use a larger buffer to protect against unforeseen bandwidth variations and use larger chunks to allow more efficient encodings.
Viewport and tiling scheme comparison: We have also run experiments with 43 tiling. These results suggest similar tradeoffs between the different categories (Figure 31(a)), relationships between byte vs object hit rates (Figure 31(b)), and relative performance under different bandwidth variations (Figure 31(c)).
Constant bandwidth
Constant bandwidth
Constant bandwidth
National speedtest samples
National speedtest samples
National speedtest samples
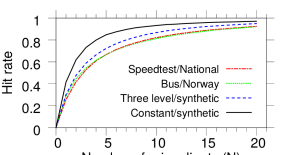
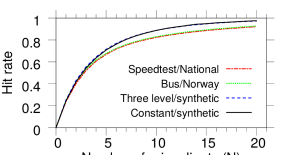
Bandwidth variation baselines: Figure 32 shows additional object hit rate results for the two extreme cases of constant bandwidth (identical for all clients), and the bandwidth distribution obtained by drawing random samples from measurements collected by mobile 3G and 4G users of a dominant national speed testing service (Linder et al., 2016). When interpreting these results, it is important to note that clients sharing an edge-cache (e.g., operated by a CDN or in cooperation with a CDN) might be expected to experience more similar bandwidth conditions than in the speed testing data. Also, with the introduction of cap-based solutions (Krishnamoorthi et al., 2018), and other streaming-aware network solutions, used by different operators to stabilize HAS performance, improve QoE, and to reduce unnecessary bandwidth usage, it seems likely that many networks in the future will provide fairly stable conditions for their streaming clients. Therefore, we believe that likely bandwidth variations fall between these two extremes.
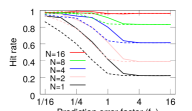
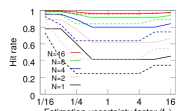
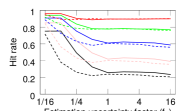
Impact of head movement uncertainties and prediction accuracy: Figures 32(a), 32(b), 32(d), and 32(e) show results capturing the impact of prediction accuracy (varying ) and the concentration of the distribution used for utility optimization (varying ). Note that the differences between the two video categories are largest for the constant bandwidth case (or, more generally, larger when bandwidth variations are smaller). Although the differences appear larger for smaller , it is also necessary to consider miss rates, as these determine bandwidth costs. For example, for and the default constant bandwidth (Figures 32(a) and 32(b)) there are substantial regions where miss rates (and hence bandwidth usage) are almost twice as large for the explore video as for the static video.
Figures 32(a) and (d), and 32(b) and (e), clearly show that the hit rates for small are much lower when the prediction accuracy is poor and the estimated uncertainty is large, respectively, but that the hit rates go up substantially as increases also for these cases. These gains are especially visible when all clients have the same bandwidth, illustrating that caching is most efficient when clients have similar bandwidth and request chunks (or tiles) of similar quality.
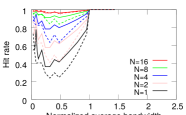
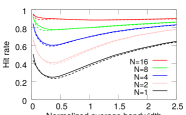
Impact of average bandwidth: The results in Figures 32(c) and 32(f) show that our default case of a normalized bandwidth of 0.476 results in close to the worst-case hit rates, suggesting that the hit rates with tiled 360 video could be greater than suggested by prior figures in this section. Also, when comparing Figures 32(c) and 32(f) it should be noted that owing to our choice of normalized units for bandwidth, the hit rate is always one when all clients have the same (constant) bandwidth above one (Figure 32(c)) whereas bandwidth variations in the national speedtest dataset (Figure 32(f)) result in significant periods of bandwidth below one even for average values substantially larger than one. Again, in practice, we expect clients sharing the same cache to see bandwidth variation between these two extremes, with operators likely to strive towards increasingly stable network conditions for streaming clients (Krishnamoorthi et al., 2018).
6. Related Work
Broadly, the related work can be split into works that consider the head movements during viewing of 360 videos, client-side techniques to provide the best possible QoE (e.g., through adaptive prefetching based on expected viewing directions), and caching of HAS videos. While some recent works have considered optimized cache management policies for 360 videos (Liu et al., 2019; Mahzari et al., 2018; Papaioannou and Koutsopoulos, 2019), none of these works provide a data-driven characterization of the caching opportunities that would be observed with traditional caching policies that simply cache the requested tiles when the clients apply adaptive prefetching techniques.
Head-movement characterization: Some recent works have collected datasets and characterized the 360 viewer behavior (Corbillon et al., 2017b; Fremerey et al., 2018; David et al., 2018; Lo et al., 2017; Bao et al., 2016; Almquist et al., 2018; Qian et al., 2018). However, most of these datasets use relatively short video segments and do not capture changes in behavior over time or across classes of videos. The primary exception, and the work most closely related to ours, is the work by Almquist et al. (Almquist et al., 2018), as we use their dataset. In their work, they present a category-based characterization of the head movements over time, and analyze how changes in viewing behavior depend on the time window considered, but do not consider overlapping viewports of users watching the same video or other similarity metrics of users’ viewing directions. Coverage and overlap metrics, such as those introduced here, are valuable in identifying potential caching and bandwidth saving opportunities.
Client-side techniques: Motivated by HMDs allowing different projection and quality adaptive download techniques (Zhou et al., 2017), various techniques have been proposed to adaptively download different qualities for different viewing directions (Hosseini and Swaminathan, 2016; Bao et al., 2016; Son et al., 2018a, b; Zhou et al., 2018; Qian et al., 2018). These typically combine user head movement tracking/prediction (Qian et al., 2016; Bao et al., 2016; Xie et al., 2018; Qian et al., 2018) and bandwidth management (Hosseini and Swaminathan, 2016; Ochi et al., 2014). For example, Bao et al. (Bao et al., 2016) show that view-dependent 360 transmission schemes with motion prediction can reduce bandwidth consumption by 45% at the cost of only a small performance degradation. Similarly, Hosseini and Swaminathan (Hosseini and Swaminathan, 2016) present an adaptive tile-based streaming solution and show that large bandwidth savings (72%) can be achieved with only small quality degradation. Graf et al. (Graf et al., 2017) studied the impact of projection techniques, quantization parameters, and tile patterns on the playback experience and resource requirements. Others have considered tradeoffs that try to address variations and uncertainties in the user’s bandwidth and viewing direction simultaneously (Almquist et al., 2018; Sun et al., 2018; Qian et al., 2018; Yuan et al., 2019b). For example, Sun et al. (Sun et al., 2018) use simulations and experiments that capture the bandwidth variations, Qian et al. (Qian et al., 2018) have implemented and tested a tile-based solution on a real network, whereas Almquist et al. (Almquist et al., 2018) note that HAS clients typically try to maintain a steady buffer (to protect against stalls) and consider the optimized prefetch-aggressiveness tradeoff of such clients. Similarly, Yuan et al. (Yuan et al., 2019b) present a buffer-based approach that tries to balance between the buffer length and video quality. In this paper, we leverage the optimization framework by Almquist et al. (Almquist et al., 2018) to evaluate the impact prefetching optimizations have on the caching performance of tiled 360 video. Others have shown (in the context of regular HAS video) how different rate adaptive solutions can be combined to provide improved client-side performance (Yuan et al., 2019a).
Tile-based segmentation has been used in other applications, including to support pan/tilt/zoom interactions during live streaming of high-resolution videos (van Brandenburg et al., 2011), for interactive panoramic video (Gaddam et al., 2016), interactive 4k video (Redi et al., 2015), and to allow users free navigation in high resolution video feeds while minimizing bandwidth usage (D’Acunto et al., 2015).
An alternative to tile-based streaming is to create different versions for each potential viewing direction and let the viewer adapt the version downloaded for each chunk. For example, Kuzyakov and Pio (Pio and Kuzyakov, 2016) create different smaller-sized versions in which each version has a specific area in high quality and with gradually decreasing quality away from this area. Some of the observations in this paper may be applicable to this other context also.
Bandwidth-interactivity tradeoffs: The tradeoffs between bandwidth constraints, playback quality, and interactivity have also been considered in other contexts. For example, Ma et al. (Ma et al., 2018) consider these tradeoffs in the context of interactive multiview streaming. HAS also has been leveraged for bandwidth-aware support of other interactive services, including interactive multiview streaming (Toni and Frossard, 2017), optimized stream bundles (Carlsson et al., 2017), and to enhance parts of regular (linear) videos that the users show more interest in (Gao et al., 2018).
Caching for HAS: Prior works have characterized the caching opportunities for HAS content in mobile networks (Gouta et al., 2013), evaluated the impact that cross traffic has on cache performance (Benno et al., 2011), identified HAS specific instabilities and other tradeoffs associated with the use of caches combined with HAS (Krishnamoorthi et al., 2013; Lee et al., 2014), and proposed HAS-aware solutions to improve the client performance in such scenarios (Krishnamoorthi et al., 2013; Lee et al., 2014; Thomas et al., 2017, 2016; Mehr et al., 2018; Liang et al., 2015). Other works have considered various cache management problems in the context of HAS (Zhang et al., 2013; Li et al., 2018) and optimized replication for interactive multiview streaming (Ren et al., 2014; Toni et al., 2016).
Most closely related to our work are perhaps recent works that present optimized cache management solutions for 360 video (Liu et al., 2019; Mahzari et al., 2018; Papaioannou and Koutsopoulos, 2019). These works formulate optimization problems related to the caching of tiled 360 videos (Liu et al., 2019; Papaioannou and Koutsopoulos, 2019) or try to learn probabilistic models of users FoV for each video so to improve cache performance (Mahzari et al., 2018). However, none of the papers presents a data-driven characterization of the users’ viewport overlaps and the bandwidth saving opportunities this provides basic caching policies. Here, we present the first such data-driven analysis of similarities in head movements between users watching the same video, the users’ viewport overlaps, and their implications on caching of tiled 360 videos belonging to different categories.
7. Summary of Design Insights
Design recommendations: Our trace-based characterization and simulations provide insights that can be used in the design of more effective caching and preloading policies. We next summarize some of these insights.
-
•
Selective insertion policies: Our results highlight that video category has a major impact on probability of data reuse. This observation suggests that selective edge-cache insertion policies (Maggs and Sitaraman, 2015; Gast and Houdt, 2016; Carlsson and Eager, 2017, 2021) should take into account the category of video. We have also found that the cache hit rate often improves over the duration of a video session, suggesting that such policies also may benefit from taking into account the timestamp of each chunk.
-
•
Chunk durations and buffer sizes: Other factors that improve cache performance are smaller chunk size and reduced uncertainties in head movements (e.g., due to improved client-side prediction). While CDNs may not control these parameters (we expect most practical systems to use larger buffers to protect against unforeseen bandwidth variations and use larger chunks to allow more efficient encodings), we note that also these choices may impact the aggressiveness with which insertion policies may select to cache tiles.
-
•
Time-based prefetching of static videos: The initial exploration phase of static videos may need special consideration both with regards to insertion policies (due to hit probabilities mentioned above) and preloading of the start of a video. Moving and rides videos provide the best opportunities to save bandwidth during preloading of the initial parts of a 360 video.
Other system insights: In addition to informing the design of new caching system policies, our findings may also have implications for other contexts than caching.
-
•
Category-dependent predictors: Our novel category-based characterization highlights substantial differences among the video categories in the value of using the viewing directions of previous users for viewport prediction. This suggests that substantially different head-movement predictors may be needed for different video categories.
-
•
Tiling may have benefit also on a chunk level: Our observation that many chunks have a relatively small cover size shows that a significant portion of the potential viewing area is not viewed during the playback of a chunk and suggests that tiles could indeed fruitfully be prioritized (by a client) on a per-chunk basis.
-
•
Caps-based network-side solutions and less aggressive client-side solutions may have additional advantages for 360 video: Our results show that cache performance, and hence also likely user QoE, benefit from stable network conditions. This is something that can be provided through the use of cap-based network/server-side solutions or less greedy client-side solutions.
8. Conclusions
This paper presents novel trace-based analysis methods and uses head-movement traces for different categories of 360 videos, including explore, static, moving, rides, to characterize similarities in the viewports of users watching the same video, to study how the viewport overlaps and other related metrics differ between the different video categories, and to analyze and discuss how such similarities and differences impact the effectiveness of caching tiled 360 videos. To the best of our knowledge, this is the first paper to provide such analysis.
Our results consistently highlight substantial differences between different video categories in the pairwise viewport overlaps observed and their impact on the potential bandwidth savings from caching. For example, except for the initial 20-30 second exploration phase of static videos, the static videos provide the greatest caching opportunities. However, during this initial phase, their pairwise viewport overlaps are almost as small as for the explore videos, which have the smallest overlaps among the categories considered here. In contrast, moving and rides videos have a less pronounced exploration phase, and often provide similar caching opportunities and performance as the static videos. Our results also show that improved viewport prediction techniques (Xie et al., 2018) may not only help improve user QoE, through the use of more accurate prefetching, but may also help increase cache hit rates and reduce bandwidth requirements.
Based on our findings, we present design recommendations concerning caching and preloading policies. We also describe implications of our results for other system design aspects.
Finally, we note that the methodologies and metrics defined in this paper easily can be applied on other datasets, enabling others to compare with our results using alternative head-movement traces (e.g., different user groups, video categories, etc.), prediction algorithms, and network conditions.
Acknowledgements: This work was funded in part by the Swedish Research Council (VR).
References
- (1)
- Almquist et al. (2018) M. Almquist, V. Almquist, V. Krishnamoorthi, N. Carlsson, and D. Eager. 2018. The Prefetch Aggressiveness Tradeoff in 360∘ Video Streaming. In Proc. ACM MMSys.
- Bao et al. (2016) Y. Bao, H. Wu, T. Zhang, A. Ramli, and X. Liu. 2016. Shooting a moving target: Motion-prediction-based transmission for 360-degree videos. In Proc. IEEE Big Data.
- Benno et al. (2011) S. Benno, J. O. Esteban, and I. Rimac. 2011. Adaptive streaming: The network HAS to help. Bell Lab. Tech. J. 16, 2 (Sept. 2011), 101–114.
- Carlsson and Eager (2017) N. Carlsson and D. Eager. 2017. Ephemeral content popularity at the edge and implications for on-demand caching. IEEE Trans. on Parallel and Distributed Systems 28, 6 (2017), 1621–1634.
- Carlsson and Eager (2020) N. Carlsson and D. Eager. 2020. Had You Looked Where I’m Looking? Cross-user Similarities in Viewing Behavior for 360-degree Video and Caching Implications. In Proc. ACM/SPEC ICPE.
- Carlsson and Eager (2021) N. Carlsson and D. Eager. 2021. Optimized Dynamic Cache Instantiation and Accurate LRU Approximations under Time-varying Request Volume. IEEE Trans. on Cloud Computing (2021).
- Carlsson et al. (2017) N. Carlsson, D. Eager, V. Krishnamoorthi, and T. Polishchuk. 2017. Optimized Adaptive Streaming of Multi-video Stream Bundles. IEEE Transactions on Multimedia 19 (July 2017), 1637–1653.
- Corbillon et al. (2017a) X. Corbillon, G. Simon, A. Devlic, and J. Chakareski. 2017a. Viewport-adaptive navigable 360-degree video delivery. In Proc. IEEE ICC.
- Corbillon et al. (2017b) X. Corbillon, F. D. Simone, and G. Simon. 2017b. 360-Degreee Video Head Movement Dataset. In Proc. ACM MMSys.
- D’Acunto et al. (2015) L. D’Acunto, J. Redi, and O. Niamut. 2015. iCaCoT - Interactive Camera-Based Coaching and Training. In Proc. Workshop on Interactive Content Consumption.
- David et al. (2018) E. J. David, J. Gutiérrez, A. Coutrot, M. P. Da Silva, and P. L. Callet. 2018. A Dataset of Head and Eye Movements for 360∘; Videos. In Proc. ACM MMSys.
- Fremerey et al. (2018) S. Fremerey, A. Singla, K. Meseberg, and A. Raake. 2018. AVtrack360: An Open Dataset and Software Recording People’s Head Rotations Watching 360∘ Videos on an HMD. In Proc. ACM MMSys.
- Gaddam et al. (2016) V. R. Gaddam, M. Riegler, R. Eg, C. Griwodz, and P. Halvorsen. 2016. Tiling in Interactive Panoramic Video: Approaches and Evaluation. IEEE Trans. om Multimedia 18, 9 (Sept. 2016).
- Gao et al. (2018) G. Gao, H. Zhang, H. Hu, Y. Wen, J. Cai, C. Luo, and W. Zeng. 2018. Optimizing Quality of Experience for Adaptive Bitrate Streaming via Viewer Interest Inference. IEEE Trans. om Multimedia 20, 12 (Dec. 2018).
- Gast and Houdt (2016) N. Gast and B. V. Houdt. 2016. Asymptotically Exact TTL-Approximations of the Cache Replacement Algorithms LRU(m) and h-LRU. In ITC.
- Gouta et al. (2013) A. Gouta, D. Hong, A.-M. Kermarrec, and Y. Lelouedec. 2013. HTTP adaptive streaming in mobile networks: Characteristics and caching opportunities. In Proc. IEEE MASCOTS.
- Graf et al. (2017) M. Graf, C. Timmerer, and C. Mueller. 2017. Towards Bandwidth Efficient Adaptive Streaming of Omnidirectional Video over HTTP: Design, Implementation, and Evaluation. In Proc. ACM MMSys.
- Hosseini and Swaminathan (2016) M. Hosseini and V. Swaminathan. 2016. Adaptive 360 VR video streaming: Divide and conquer. In Proc. IEEE ISM.
- Krishnamoorthi et al. (2013) V. Krishnamoorthi, N. Carlsson, D. Eager, A. Mahanti, and N. Shahmehri. 2013. Helping Hand or Hidden Hurdle: Proxy-assisted HTTP-based Adaptive Streaming Performance. In Proc. IEEE MASCOTS.
- Krishnamoorthi et al. (2018) V. Krishnamoorthi, N. Carlsson, and E. Halepovic. 2018. Slow but Steady: Cap-based Client-Network Interaction for Improved Streaming Experience. In Proc. IEEE/ACM IWQoS.
- Lee et al. (2014) D. H. Lee, C. Dovrolis, and A. C. Begen. 2014. Caching in HTTP Adaptive Streaming: Friend or Foe?. In Proc. ACM NOSSDAV.
- Li et al. (2018) C. Li, L. Toni, J. Zou, H. Xiong, and P. Frossard. 2018. QoE-Driven Mobile Edge Caching Placement for Adaptive Video Streaming. IEEE Trans. om Multimedia 20, 4 (Apr. 2018).
- Liang et al. (2015) K. Liang, J. Hao, R. Zimmermann, and D. K. Y. Yau. 2015. Integrated Prefetching and Caching for Adaptive Video Streaming over HTTP: An Online Approach. In Proc. ACM MMSys.
- Linder et al. (2016) T. Linder, P. Persson, A. Forsberg, J. Danielsson, and N. Carlsson. 2016. On Using Crowd-sourced Network Measurements for Performance Prediction. In Proc. IEEE/IFIP WONS.
- Liu et al. (2019) K. Liu, Y. Liu, J. Liu, A. Argyriou, and Y. Ding. 2019. Joint EPC and RAN caching of tiled VR videos for mobile networks. In Proc. MMM.
- Lo et al. (2017) W. Lo, C. Fan, J. Lee, C. Huang, K. Chen, and C. Hsu. 2017. 360∘ Video Viewing Dataset in Head-Mounted Virtual Reality. In Proc. ACM MMSys.
- Ma et al. (2018) R. Ma, T. Maugey, and P. Frossard. 2018. Optimized Data Representation for Interactive Multiview Navigation. IEEE Trans. om Multimedia 20, 7 (July 2018).
- Maggs and Sitaraman (2015) B. Maggs and K. Sitaraman. 2015. Algorithmic Nuggets in Content Delivery. ACM CCR 45, 3 (2015), 52–66.
- Mahzari et al. (2018) A. Mahzari, A. Nasrabadi, A. Samiei, and R. Prakash. 2018. FoV-aware edge caching for adaptive 360 video streaming. In Proc. ACM Multimedia.
- Mehr et al. (2018) S. K. Mehr, P. Juluri, M. Maddumala, and D. Medhi. 2018. An adaptation aware hybrid client-cache approach for video delivery with dynamic adaptive streaming over HTTP. In Proc. IEEE/IFIP NOMS.
- Ochi et al. (2014) D. Ochi, Y. Kunita, K. Fujii, A. Kojima, S. Iwaki, and J. Hirose. 2014. HMD viewing spherical video streaming system. In Proc. ACM Multimedia.
- Papaioannou and Koutsopoulos (2019) G. Papaioannou and I. Koutsopoulos. 2019. Tile-based Caching Optimization for 360 Videos. In Proc. ACM MobiHoc.
- Pio and Kuzyakov (2016) D. Pio and E. Kuzyakov. 2016. Next-generation video encoding techniques for 360 video and VR. (Jan. 2016). https://code.facebook.com/posts/1126354007399553/next-generation-video-encoding-techniques-for-360-video-and-vr/
- Qian et al. (2018) F. Qian, B. Han, Q. Xiao, and V. Gopalakrishnan. 2018. Flare: Practical Viewport-Adaptive 360-Degree Video Streaming for Mobile Devices. In Proc. ACM MobiCom.
- Qian et al. (2016) F. Qian, L. Ji, B. Han, and V. Gopalakrishnan. 2016. Optimizing 360 video delivery over cellular networks. In Proc. All Things Cellular Workshop.
- Redi et al. (2015) J. Redi, L. D’Acunto, and O. Niamut. 2015. Interactive UHDTV at the Commonwealth Games: An Explorative Evaluation. In Proc. ACM TVX.
- Ren et al. (2014) D. Ren, S.-H. G. Chan, G. Cheung, and P. Frossard. 2014. Coding Structure and Replication Optimization for Interactive Multiview Video Streaming. IEEE Trans. om Multimedia 16, 7 (Nov. 2014).
- Riiser et al. (2013) H. Riiser, P. Vigmostad, C. Griwodz, and P. Halvorsen. 2013. Commute Path Bandwidth Traces from 3G Networks: Analysis and Applications. In Proc. MMSys.
- Son et al. (2018a) J. Son, D. Jang, and E.-S. Ryu. 2018a. Implementing 360 Video Tiled Streaming System. In Proc. ACM MMSys.
- Son et al. (2018b) J. Son, D. Jang, and E.-S. Ryu. 2018b. Implementing Motion-Constrained Tile and Viewport Extraction for VR Streaming. In Proc. ACM NOSSDAV.
- Sun et al. (2018) L. Sun, F. Duanmu, Y. Liu, Y. Wang, Y. Ye, H. Shi, and D. Dai. 2018. Multi-path Multi-tier 360-degree Video Streaming in 5G Networks. In Proc. ACM MMSys.
- Thomas et al. (2016) E. Thomas, M. van Deventer, T. Stockhammer, A. C. Begen, M.-L. Champel, and O. Oyman. 2016. Applications and deployments of server and network assisted DASH (SAND). In Proc. IBC.
- Thomas et al. (2017) E. Thomas, M. van Deventer, T. Stockhammer, A. C. Begen, and J. Famaey. 2017. Enhancing MPEG DASH performance via server and network assistance. SMPTE Motion Imaging Journal 126 (Jan/Feb. 2017), 22–27. Issue 1.
- Toni et al. (2016) L. Toni, G. Cheung, and P. Frossard. 2016. In-Network View Synthesis for Interactive Multiview Video Systems. IEEE Trans. om Multimedia 18, 5 (May 2016).
- Toni and Frossard (2017) L. Toni and P. Frossard. 2017. Optimal Representations for Adaptive Streaming in Interactive Multiview Video Systems. IEEE Trans. om Multimedia 19, 12 (Dec. 2017).
- van Brandenburg et al. (2011) R. van Brandenburg, O. Niamut, M. Prins, and H. Stokking. 2011. Spatial segmentation for immersive media delivery. In Proc. ICIN.
- Vleeschauwer et al. (2013) D. D. Vleeschauwer, H. Viswanathan, A. Beck, S. Benno, G. Li, and R. Miller. 2013. Optimization of HTTP adaptive streaming over mobile cellular networks. In Proc. IEEE INFOCOM.
- Xie et al. (2018) L. Xie, X. Zhang, and Z. Guo. 2018. CLS: A Cross-user Learning Based System for Improving QoE in 360-degree Video Adaptive Streaming. In ACM Multimedia.
- Yuan et al. (2019a) H. Yuan, X. Hu, J. Hou, X. Wei, and S. Kwong. 2019a. An ensemble rate adaptation framework for dynamic adaptive streaming over HTTP. IEEE Trans. on Broadcasting 66, 2 (2019), 251–263.
- Yuan et al. (2019b) H. Yuan, S. Zhao, J. Hou, X. Wei, and S. Kwong. 2019b. Spatial and temporal consistency-aware dynamic adaptive streaming for 360-degree videos. IEEE Journal of Selected Topics in Signal Processing 14, 1 (2019), 177–193.
- Zhang et al. (2013) W. Zhang, Y. Wen, Z. Chen, and A. Khisti. 2013. QoE-driven cache management for HTTP adaptive bit rate streaming over wireless networks. IEEE Trans. on Multimedia 15, 6 (2013), 1431–1445.
- Zhou et al. (2017) C. Zhou, Z. Li, and Y. Liu. 2017. A Measurement Study of Oculus 360 Degree Video Streaming. In Proc. ACM MMSys.
- Zhou et al. (2018) C. Zhou, M. Xiao, and Y. Liu. 2018. ClusTile: Toward Minimizing Bandwidth in 360-degree Video Streaming. In Proc. IEEE INFOCOM.