A NuSTAR and XMM-Newton Study of the Two Most Actively Star-forming Green Pea Galaxies
(SDSS J0749+3337 and SDSS J0822+2241)
Abstract
We explore X-ray evidence for the presence of active galactic nuclei (AGNs) in the two most actively star-forming Green Pea galaxies (GPs), SDSS J0749+3337 and SDSS J0822+2241, which have star-formation rates (SFRs) of yr-1 and yr-1, respectively. The GPs have red mid-infrared (MIR) spectral energy distributions and higher 22 m luminosities than expected from a proxy of the SFR (H luminosity), consistent with hosting AGNs with 2–10 keV luminosities of erg s-1. We thus obtain and analyze the first hard ( 10 keV) X-ray data observed with NuSTAR and archival XMM-Newton data below 10 keV. From the NuSTAR 20 ksec data, however, we find no significant hard X-ray emission. By contrast, soft X-ray emission with 0.5–8 keV luminosities of erg s-1 is significantly detected in both targets, which can be explained only by star formation (SF). A possible reason for the lack of clear evidence is that a putative AGN torus absorbs most of the X-ray emission. Applying a smooth-density AGN torus model, we determine minimum hydrogen column densities along the equatorial plane () consistent with the non-detection. The results indicate cm-2 for SDSS J0749+3337 and cm-2 for SDSS J0822+2241. Therefore, the GPs may host such heavily obscured AGNs. Otherwise, no AGN exists and the MIR emission is ascribed to SF. Active SF in low-mass galaxies is indeed suggested to reproduce red MIR colors. This would imply that diagnostics based on MIR photometry data alone may misidentify such galaxies as AGNs.
1 INTRODUCTION
There now seems to be a general consensus that supermassive black holes (SMBHs) with masses above a million solar masses (; Kormendy & Richstone, 1995; Kormendy & Ho, 2013) are ubiquitous in the center of massive galaxies. The growth history of SMBHs can be traced based on the luminosity functions of active galactic nuclei (AGNs; e.g., Ueda et al., 2003, 2014; Shankar et al., 2004; Hasinger et al., 2005), and the results suggest that mass accretion is a dominant mechanism. This further infers the existence of massive black holes (mBHs) with masses in the range of (Marconi et al., 2004). Given the correlation between the central SMBH mass and stellar properties of the galaxy bulge (Magorrian et al., 1998; Gebhardt et al., 2000; Marconi & Hunt, 2003; Gültekin et al., 2009), mBHs are predicted to reside in low-mass galaxies and, indeed, have been found observationally (Thornton et al., 2008; Baldassare et al., 2015; Nguyen et al., 2017, 2018).
Some theoretical studies, however, have argued that not all low-mass galaxies host mBHs (Volonteri et al., 2008; Volonteri, 2010) and that it depends on seed formation mechanisms such as a remnant of massive Population III stars (Bromm & Yoshida, 2011), the end-product of very massive stars formed through stellar mergers in dense star clusters (e.g., Gürkan et al., 2004), and the result of the direct collapse of primordial dense gas (Haehnelt & Rees, 1993; Begelman et al., 2006; Lodato & Natarajan, 2006). In other words, the mBH occupation fraction, as well as the mBH mass function in local low-mass galaxies, are expected to provide insights into how the seeds of SMBHs formed. Thus, mBH fractions have been enthusiastically measured under the assumption that the observed fractions of AGNs should be independent of the galaxy mass. (Greene, 2012; Reines & Comastri, 2016; Mezcua et al., 2016, 2018). So far, fractions constrained using soft X-ray observations (e.g., Greene, 2012) support the view that direct collapse is a dominant process, where a lower occupation fraction is expected. Given that heavily obscured AGNs may be missed, however, a higher fraction is possible and may indeed favor the other scenarios. Thus, in order to draw a robust conclusion, it is necessary to construct as unbiased a sample as possible.
X-ray surveys are very important for sample construction (e.g., Chen et al., 2017). As described above, the soft X-ray ( 10 keV) band has often been used for such studies but is easily biased against obscured systems. Moreover, given a theoretical prediction of increased soft X-ray luminosity in young and low-metallicity galaxies (e.g., Linden et al., 2010; Fragos et al., 2013) and subsequent soft X-ray observations that have confirmed this (Basu-Zych et al., 2013; Brorby et al., 2016; Brorby & Kaaret, 2017), it is possible to misidentify star-formation-induced soft X-ray emission as that from an AGN. By contrast, the hard X-ray ( 10 keV) band overcomes the above difficulties due to its high penetrating power and reduced contamination by stellar light. Mid-infrared (MIR) color-color selection is another option that is unbiased against absorption; it relies on characteristic MIR colors produced by AGN-heated hot dust (Jarrett et al., 2011; Stern et al., 2012; Mateos et al., 2012) and has been examined for various samples (e.g., Gandhi et al., 2015; Kawamuro et al., 2016b; Ichikawa et al., 2017). Some studies applied Wide-field Infrared Survey Explorer (WISE) AGN diagnostics to low-mass galaxies and created large AGN candidate samples (Satyapal et al., 2014; Sartori et al., 2015; Secrest et al., 2015). However, Hainline et al. (2016) demonstrated that star-forming low-mass galaxies, particularly those with very young stellar populations and high specific star-formation rates (sSFRs), could produce MIR colors similar to those of WISE-selected AGN. Thus, hard X-ray data are important and need to be investigated.
In this paper, we discuss the presence of AGNs in two low-mass galaxies () SDSS J074936.77+333716.3 and SDSS J082247.66+224144.0 (hereafter, J0749+3337 and J0822+2241), i.e., the two highest star-formation rate (SFR) Green Pea galaxies (GPs). As explained below, they are optically classified as non-AGN hosts, but their MIR properties are consistent with having AGNs. Their basic properties can be found in Table 1.
Through the Galaxy Zoo project (Lintott et al., 2008), GPs were first identified in the local Universe () by their green, unresolved (i.e., arcsec) compact morphology in Sloan Digital Sky Survey (SDSS) images (Cardamone et al., 2009). These features were interpreted as [O III]5007 emission with high EWs (700 Å on average) within 5 kpc. Figure 13 of Cardamone et al. (2009) demonstrated that the EWs are generally higher than those observed in galaxies with similar redshifts and -band magnitudes. Note that the EWs of J0749+3337 and J0822+2241 are 340 Å and 1040 Å, respectively. Cardamone et al. (2009) reported that among 112 GPs with good quality optical spectra, nine GPs show broad Balmer lines, and thus were classified as AGN hosts. They applied the optical BPT diagram (Kewley et al., 2001; Kauffmann et al., 2003) to the remaining 103 sources, and the result was that 23 GPs are classified as AGNs while 80 GPs including our two targets as star-forming galaxies.
The star-forming GPs have low stellar masses (– ) and resemble high-redshift galaxies in terms of size, morphology, large emission lines, reddening, luminous UV emission (i.e., high SFRs), and low metallicity (Cardamone et al., 2009; Izotov et al., 2011). Thus, the GP sample is suggested to offer a valuable opportunity to investigate an early phase of galaxy growth in detail. Many interesting results, such as star-forming conditions and the escape fraction of ionizing radiation, have been reported, to date (e.g., Chakraborti et al., 2012; Jaskot & Oey, 2013; Henry et al., 2015). However, few studies have mentioned the presence of AGNs by utilizing the MIR or soft X-ray observational data (Yang et al., 2016; Svoboda et al., 2018).
With regard to our GPs, no AGN sign was found from optical spectra. As suggested above, the GPs have inactive galaxy-like [O III]5007/H and [N II]6583/H flux ratiosiiiWe note that J0822+2241 may have moderately high [O III]5007/H and [N II]6583/H flux ratios of 0.75 and -1.0 in logarithmic scale as calculated from the spectral line properties provided by the SDSS DR7 site of http://skyserver.sdss.org/dr7/en/tools/search/radial.asp. Thus, it may be classified as a AGN host, but in this paper we follow the results from a spectral analysis by Cardamone et al. (2009). On the other hand, the spectral lines of J0749+3337 from the site are still consistent with an inactive galaxy. Also, their extinction-corrected [O III] luminosity ( erg s-1) to X-ray (2–10 keV) luminosity ratios, where the X-ray luminosities are estimated from the MIR emission (see Section 2), are slightly higher (0.05) than the average of a nearby AGN sample of Ueda et al. (2015) (0.03). The extinction correction is made by following Ueda et al. (2015). Thus, their [O III] emission may be dominated by SF, consistent with the above. However, their MIR properties are consistent with those observed for AGN hosts (see Section 2). This apparent discrepancy could be explained if a mass accretion black hole is deeply buried in the surrounding material and therefore the narrow line region remains absent (e.g., Imanishi et al., 2001, 2006, 2008, 2010; Ueda et al., 2007; Ichikawa et al., 2014). To provide new insights into this discussion, we present the first hard X-ray data obtained with NuSTAR (Harrison et al., 2013), currently the most sensitive hard X-ray (3–80 keV) observatory. Additionally, soft X-ray properties are examined using XMM-Newton (Jansen et al., 2001) archival data. The NuSTAR and XMM-Newton observations were conducted in 2018 (PI: Kawamuro) and in 2013 (PI: Ehle), respectively, and the log of these X-ray observations is given in Table 2.
| SDSS Name | R.A. (J2000) | Decl. (J2000) | SFR | (sSFR/Gyr-1) | 12 + (O/H) | ||||
|---|---|---|---|---|---|---|---|---|---|
| (degrees) | (degrees) | (Gpc) | ( yr-1) | ( erg s-1) | |||||
| (1) | (2) | (3) | (4) | (5) | (6) | (7) | (8) | (9) | (10) |
| J0749+3337 | 117.403215 | 33.621219 | 0.2733 | 1.40 | 12351 | 9.49 | 1.11 | 8.29 | 7.4 |
| J0822+2241 | 125.698590 | 22.695578 | 0.2163 | 1.07 | 7834 | 8.43 | 1.98 | 8.08 | 4.7 |
Note. — (1) SDSS source name. (2) Right ascension. (3) Declination. (4) Redshift. (5) Luminosity distance. (6) SFR that takes account of the dust-obscured and un-obscured SFRs (see Section 5.1 for derivation). (7) Stellar mass from Izotov et al. (2011). (8) sSFR derived by following Hainline et al. (2016), where SFRs were calculated with the H luminosity as . (9) Oxygen abundance ratio from Izotov et al. (2011). (10) Extinction-corrected H luminosity taken from Cardamone et al. (2009).
The remainder of this paper is organized as follows. First, we briefly summarize the MIR properties of J0749+3337 and J0822+2241 based on the WISE data in Section 2. In Section 3, we present an analysis of the NuSTAR data, and report the non-detection of the GPs in the hard X-ray band. In Section 4, we perform spectral analysis of the XMM-Newton data. A discussion and summary are given in Sections 5 and 6, respectively. Throughout this paper, we assume a CDM cosmology with km s-1 Mpc-1, , and . We utilize HEASoft version 6.22 for X-ray data reduction, and XSPEC version 12.9.1p (Arnaud, 1996) for spectral analysis. The solar abundance table provided in Wilms et al. (2000), where the oxygen abundance ratio of is 8.69, is adopted. Errors attached to X-ray spectral parameters are given at 90% confidence limits for a single parameter of interest by following convention, while others are quoted at the confidence level unless otherwise stated.
2 WISE MIR PROPERTIES
We present that in the MIR (3–22 m) band the GPs have red colors, steep spectral indices, and luminous emission, consistent with the presence of an AGN. Their MIR data were taken from the AllWISE data release, which combined the data taken from the four-band cryogenic phase (Wright et al., 2010) and the NEOWISE post-cryo phase (Mainzer et al., 2011). The GPs were detected in all four bands (W1: 3.4 m, W2: 4.6 m, W3: 12 m, and W4: 22 m) with S/N above 12 (i.e., ph_qual = A) and little saturation (i.e., w[1,2,3,4]sat 0). The photometry flag of ccflag = 0 guaranteed that our sources were unaffected by known artifacts (e.g., contamination and/or biased flux due to proximity to an image artifact). The observed magnitudes were converted into flux densities by assuming a spectral index of in the form of , close to those obtained by our spectral energy distribution (SED) fits (see below).
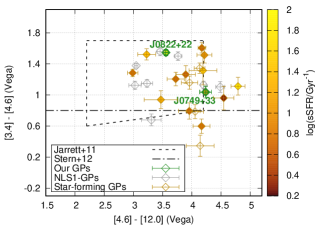
Figure 1 shows a WISE color–color plot of the GPs together with two AGN selection regions proposed by Stern et al. (2012) and Jarrett et al. (2011):
[3.4] - [4.6] >= 0.8 mag
and
 [4.6] - [12] > 2.2 mag
 & [4.6] - [12] < 4.2 mag
 & [3.4] - [4.6] > (0.1 x [4.6 - 12] + 0.38) mag
 & [3.4] - [4.6] < 1.7 mag.
Here, we additionally add another 28 GPs that were detected in the four WISE bands with S/N . The additional sample consists of 20 star-forming GPs and 8 AGN, or narrow-line Seyfert 1 galaxies (NLS1), GPs, the details of which (i.e., R.A., and Dec.) are available in Cardamone et al. (2009). J0749+3337 and J0822+2241 satisfy both of the AGN criteria within uncertainty. All of the optically identified AGN GPs can be classified as AGNs, and a large fraction of the star-forming GPs fall also within the criteria. However, Hainline et al. (2016) suggested that the selections do not guarantee the presence of an AGN, particularly for low-stellar-mass, high SFR, or high sSFR () galaxies. Indeed, our GPs have high sSFRs (Figure 1)iiiiiiBy following Hainline et al. (2016), SFRs were calculated with H luminosity as ..
MIR SEDs have often been used to identify AGNs by detecting a power law component originating in AGN-heated dust (e.g., Polletta et al., 2007). Spectral indices of luminous AGNs are typically 0.5 in the form of (Alonso-Herrero et al., 2006; Mullaney et al., 2011). The spectral indices of J0749+3337 and J0822+2241 derived from single power law fits to W1, W2, and W4 band photometry were and , respectively. These are therefore supportive of the presence of an AGN. The W3 band was excluded because various emission (e.g., polycyclic aromatic hydrocarbon (PAH) emission at the 7.7 m, 8.6 m, 11.3 m, and 12.7 m bands) and absorption features (e.g., silicate absorption at 9.7 m) contribute to emission. Note that we can obtain spectral indices consistent with those above even if we incorporate the W3 emission into the fits.
We further investigate the origin of the MIR emission by focusing on the rest frame 22 m luminosities, which are erg s-1 and erg s-1 for J0749+3337 and J0822+2241, respectively. The luminosities were derived based on the W4 22-m band magnitudes of 6.8 and 6.4 in Vega for J0749+3337 and J0822+2241 and K-correction with . In discussing whether star formation (SF) is the only MIR source, we make a comparison with the expected SF luminosity. The W4 band is indeed suited for this purpose because dust may cause emission at the shorter wavelengths (W1 and W2) to become extinct, and also because a correlation between the W3 luminosity and SFR likely depends on the metallicity (Lee et al., 2013), making the comparison more complex. Lee et al. (2013) derived a correlation between the W4 band and H luminosity, proxies of the SFR, as with an intrinsic scatter of 0.21 dex. Their sample was composed of WISE 22 m-detected star-forming galaxies at 0.01 0.3 in an SDSS catalog. The H luminosities, metallicities, and stellar masses of our GPs are within the ranges considered in Lee et al. (2013). If all of the band W4 emission is ascribed to SF, and are predicted. These are significantly larger by 0.6–0.8 dex than those observed (42.870.02 of J0749+3337 and 42.670.05 of J0822+2241). Thus, there may be an additional contribution by AGNs. Conservative 22 m AGN luminosities, from which the SF contribution expected by the H emission is subtracted, are erg s-1and erg s-1for J0749+3337 and J0822+2241, respectively. The AGN MIR luminosities can be converted into hard X-ray 14–150 keV luminosities of 44.700.48 and 44.670.47 with 1 scatters through the second equation in Table 3 of Ichikawa et al. (2017) iiiiiiiiiAlthough the energy band represented in Ichikawa et al. (2017) is 14–195 keV, the correct one is 14–150 keV.. The correlation was derived based on Swift/BAT hard X-ray-selected nearby () AGNs. Conventional 2–10 keV luminosities can be derived as 44.29 and 44.26, respectively, by assuming a cut-off power law with and keV.
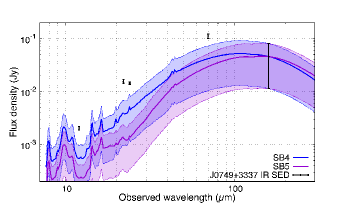
For J0749+3337 alone, we supplementarily examine the MIR luminosity expected from the far-infrared (FIR) luminosity that traces the SFR. J0822+2241 is not discussed here because no FIR data were available. We make a comparison between observed and model infrared (IR) SEDs (Figure 2). FIR (70 m and 160 m) and additional MIR 24 m photometry data from the Spitzer/MIPS is taken from Laag et al. (2010). The model SEDs are taken from Mullaney et al. (2011), who created five IR (6–1090 m) templates by grouping 14 local ( Mpc) star-forming galaxies in terms of their overall shape and the relative strength of their PAH features. Out of the five IR templates, we adopt two (SB4 and SB5 in Mullaney et al. 2011) that considered galaxies with IR (8—1000 m) luminosities of , comparable to that of J0749+3337 (; Laag et al., 2010). Figure 2 indicates MIR excess with respect to the models even in the most extreme case compatible with the observed 160 m flux densities. This is consistent with the above statement.
3 NuSTAR Hard X-ray Data Analysis
To obtain direct evidence for the presence of AGNs, we observed J0749+3337 and
J0822+2241 by NuSTAR, which carries two independent
focal plane modules (FPMA and FPMB), with on-source exposures of
19 ksec and 22 ksec, respectively. Following the “NuSTAR Analysis
Quickstart Guide”ivivivhttp://www.srl.caltech.edu/NuSTAR_Public/
NuSTAROperationSite/SAA_Filtering/SAA_Filter.php,
we used the standard nupipeline script for reprocessing. Our targets were
very faint ( counts s-1), and periods of high background (such
as paths through or near the South Atlantic Anomaly (SAA)) must be excluded.
Typical background rates observed with NuSTAR are 1 count s-1
integrated over the focal plane (Forster et al., 2014). Times of high background can be
identified by simultaneously increased count rates in the detectors and shields that surround the focal planes. Using the
telemetry reports made by the NuSTAR team, we checked the total event rates during all orbital
passages of our observations. During the J0749+3337 observation, the event rate slightly
increased around the standard SAA area ( 2 counts s-1). In addition,
high count rates occasionally occurred in the so-called tentacle region (Forster et al., 2014)
near the SAA. Thus, we ran nupipeline to reject times with high count rates
by setting options saamode=optimized and tentacle=yes.
Background rates during the J0822+2241 observation were stable and low, and thus we adopted
saamode=none and tentacle=no.
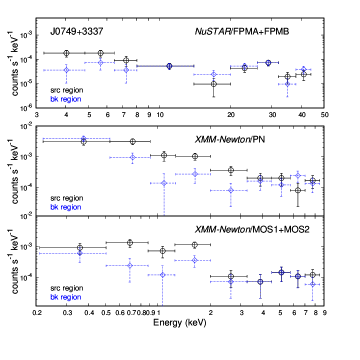
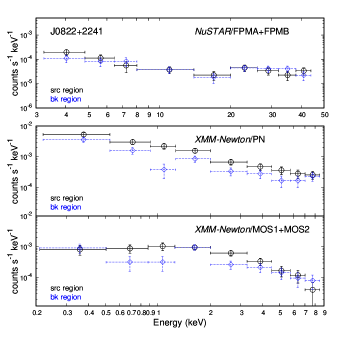
We defined source regions as -radius circles centered at each optical position by taking account of the full width at half maximum (FWHM) of the NuSTAR point spread function (PSF; 18′′). The size is much larger than the typical size of GPs ( arcsec; Cardamone et al., 2009). Background regions were off-source circular regions with a -radius on the same detector. Then, we produced source and background spectra, and response files using the nuproducts task. The products of FPMA and FPMB were combined to provide better statistics by using the addascaspec command. The systematic uncertainty between the two modules is likely much smaller than the statistical uncertainty. Figure 3 shows the obtained spectra, as well as the background contribution. This clearly illustrates that we detected no significant emission from J0749+3337 and J0822+2241 even in the most sensitive 8–24 keV band. Count rate upper limits at 3 in the energy range are counts s-1 and counts s-1, respectively. They are converted into 2–10 keV luminosities of erg s-1and erg s-1, respectively, by adopting a power law model with . In Section 5.2, we further investigate how large absorbing column densities are needed to be consistent with the non-detection if there are AGNs with (Section 2).
| SDSS Name | Observatory | ObsID | Obs. date (UT) | Exp. |
|---|---|---|---|---|
| (ksec) | ||||
| (1) | (2) | (3) | (4) | (5) |
| J0749+3337 | XMM-Newton | 0690470101 | 2013 Mar. 25 | 20/22 |
| NuSTAR | 60301008002 | 2018 Mar. 23 | 34 | |
| J0822+2241 | XMM-Newton | 0690470201 | 2013 Apr. 06 | 28/33 |
| NuSTAR | 60301009002 | 2018 Feb. 04 | 44 |
Note. — Columns: (1) SDSS source name. (2) Observatory name. (3) Observation ID. (4) Observation start date. (5) Exposure after data reduction. For the XMM-Newton observations, the PN and MOS 1 plus 2 exposure times are denoted separately, while the FPMA and FPMB merged exposures are represented in the NuSTAR rows.
4 XMM-Newton Soft X-ray Data Analysis
The XMM-Newton data for J0749+3337 and J0822+2241 were obtained through the European Photon Imaging Camera/MOS (1 and 2) and PN detectors with duration time of 44 ks and 34 ks. All observations were performed by adopting the Prime Full Window mode and the thin filter.
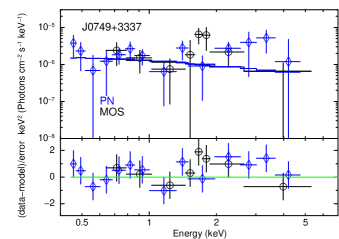
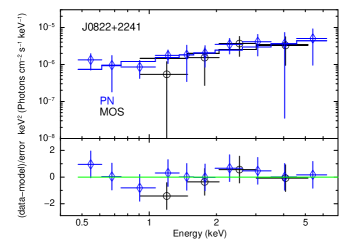
We reduced the data following the XMM-Newton ABC guidevvvhttps://heasarc.gsfc.nasa.gov/docs/xmm/abc/. The raw PN and MOS data were reprocessed using pipelines of epchain and emchain, respectively. To filter periods with a high background, we created PN background light curves in the 10–12 keV band with PATTERN = 0 (single events), and those of the MOS in energies above 10 keV with the same pattern selection. Regarding the J0822+2241 data, we adopted background count rate thresholds of 0.35 s-1 and 0.40 counts s-1 for the MOS and PN cameras, respectively. These are the recommended values in the guide. In contrast, we found two high-background flares during the J0749+3337 observation, and could not clearly remove the tails of the flares with the recommended thresholds. Thus, we excluded the first 10 ks and the last 11 ks to obtain clean data. The PN data were further limited to those with PATTERN 4 (single and double events) and FLAG = 0, corresponding to the most conservative screening criteria. For the MOS data selection, PATTERN 12 (single, double, triple, and quadruple events) was adopted. Central circular regions with and radii, larger than the FWHM of the XMM-Newton PSF (), were set to extract J0749+3337 and J0822+2241 source events, respectively. The larger region was adopted for J0822+2241 because its X-ray image seemed to be slightly extended, although this was likely due to low photon statistic fluctuation. Each background spectrum was extracted from an off-source circular region with the same radius as that used for the source events. The spectra from the MOS1 and MOS2 detectors were combined into one. We analyzed the spectra in the 0.4–7.0 keV band, where J0749+3337 and J0822+2241 were significantly detected with S/N = (5.5, 4.1) and (6.6, 3.9) for (PN, MOS), respectively. The response files were generated in a standard manner for a point source.
4.1 XMM-Newton Spectral Analyses
We simultaneously fit the PN and MOS spectra (Figure 4) to increase the S/N. The spectra are binned so that each energy bin had at least one count. We thus determine best-fit models based on the -statistic (Cash, 1979), appropriate for low photon counts. Goodness of fit is examined by following the procedure given in Kaastra (2017), where the expected -statistic value () and variance () from a model is compared with the observed value (). Note that the best-fit models found in the following sections are consistent with the non-detection by NuSTAR.
Essentially, we determine the best-fit models using the following model,
constant*TBabs*zTBabs*zpowerlw (Model1),
expressed in XSPEC terminology. The main component is the single absorbed power law (zTBabs*zpowerlw), and is adopted for a consistent comparison with the work by Brorby et al. (2016) (Section 5.1). They parameterized the X-ray emission of low-mass galaxies by single power law fits and discussed its association with SF. The power law component may be ascribed to emission from high-mass X-ray binaries (HMXBs) and an AGN, if present. We also include the Galactic absorption, whose hydrogen column density is estimated from the nh command in HEASoft (Kalberla et al., 2005), with TBabs. We fix cm-2 and cm-2 for J0749+3337 and J0822+2241, respectively. To absorb systematic uncertainty in the normalization between the PN and MOS spectra, we apply the constant model, whose value is represented by . To avoid implausible values, we allow it to vary only within 10%, a canonical range (e.g., see Figures 6 and 7 of Madsen et al., 2017). We finally obtain four free parameters: the photon index () and normalization of zpowerlw, the absorbing column density (), and the cross-normalization between the spectra (). Errors in intrinsic luminosity from the power law are constrained by replacing zpowerlw with pegpwrlw, which explicitly provides flux (or luminosity) errors in a given energy range.
We also apply another model that additionally takes into account emission from the hot interstellar medium (ISM) and young stellar objects (YSOs) according to the Mineo et al. (2012):
 constant*TBabs*zTBabs(zpowerlw+apec+zbremss)
                                     (Model2).
The ISM emission is modeled by optically thin thermal emission (apec) with a temperature of 0.24 keV, the average value of those measured in nearby galaxies. The metal abundance is set to 0.40 for J0749+3337 and 0.25 for J0822+2241 according to each oxygen abundance ratio. The YSO emission is modeled by bremsstrahlung (zbremss) with a canonical temperature of 3 keV (Winston et al., 2007; Mineo et al., 2012). Luminosities from the ISM and YSOs are expected to increase with SFR as (erg s-1/ yr-1) and (erg s-1/ yr-1). Accordingly, we fix the normalizations of the two thermal emission at those corresponding to the expected luminosities. Note that we do not consider X-ray emission from low-mass X-ray binaries, cataclysmic variables, or active binaries. Given correlations of their luminosities and stellar mass (Gilfanov, 2004; Bogdán & Gilfanov, 2011), at most erg s-1 is expected from those populations. This is much smaller than observed luminosities ( erg s-1). Finally, we obtain the same four free parameters as in Model1. We stress that because the two models provide similar values (Table 3), our discussion does not depend on the adopted models, as detailed below.
4.1.1 Soft X-ray Band J0749+3337 Spectra
Fitting Model1, we obtain an un-absorbed ( cm-2), soft () power law model in / = 92/87. The rest frame 0.5–8 keV intrinsic luminosity () is measured to be 1.2 erg s-1. Model2 also provides a similar result, where cm-2, , and 1.2 erg s-1.
4.1.2 Soft X-ray Band J0822+2241 Spectra
Similarly to the J0749+3337 case, Model1 can reproduce the J0822+2241 spectra well with insignificant absorption ( 3.5cm-2) and a harder photon index ( = ) in / = 200/21015. The luminosity is erg s-1. A similar result can be obtained by fitting Model2 (Table 3).
| (1) | SDSS Name | J0749+3337 | J0822+2241 | |||
|---|---|---|---|---|---|---|
| (2) | Model | Model1 | Model2 | Model1 | Model2 | |
| (3) | (1020 cm-2) | 4.65 | 4.13 | |||
| (4) | 0.97 | 0.96 | 0.98 | 0.98 | ||
| (5) | (1022 cm-2) | 0.00 | 0.00 | 0.00 | 0.00 | |
| (6) | 2.6 | 2.5 | 1.3 | 1.3 | ||
| (7) | Norm | (10-6 photon cm-2 s-1 keV-1) | 2.6 | 2.3 | 1.9 | 1.8 |
| (8) | (10-15 erg cm-2 s-1) | 2.8 | 2.8 | 3.1 | 3.1 | |
| (9) | (10-15 erg cm-2 s-1) | 4.2 | 4.4 | 11 | 11 | |
| (10) | (10-15 erg cm-2 s-1) | 1.6 | 1.8 | 10 | 10 | |
| (11) | (1041 erg s-1) | 8.5 | 7.6 | 4.0 | 3.9 | |
| (12) | (1041 erg s-1) | 12 | 12 | 14 | 14 | |
| (13) | (1041 erg s-1) | 4.2 | 4.5 | 13 | 13 | |
| (14) | //d.o.f | 92/8710/109 | 92/8811/109 | 200/21015/241 | 200/21015/241 | |
| (15) | S/N (PN, MOS) | 5.5, 4.1 | 6.6, 3.9 | |||
Note. — Columns: (1) SDSS source name. (2) Model1 is the absorbed power law, and Model2 consists of the absorbed power law, the optically thin thermal emission, and bremsstrahlung. The latter two thermal emission are fixed. (3) Hydrogen column density of the Galactic absorption. (4) Ratio between the MOS and PN spectral models. (5) Hydrogen column density of extragalactic absorption. (6) Power law photon index of the power law component. (7) Power law normalization at 1 keV. (8)–(10) Observed fluxes in the 0.5–2, 0.5–8, and 2–10 keV bands. (11)–(13) Absorption-corrected intrinsic luminosities in the 0.5–2, 0.5–8, and 2–10 keV bands. (14) Observed -statistic value, and expected -statistic value with its 1 uncertainty, and degrees of freedom. (15) S/N in the 0.4–7.0 keV band. (The fluxes and luminosities are estimated from the PN spectra.)
5 DISCUSSION
5.1 Origin of Soft X-ray Emission
We investigate the origin of the soft X-ray emission reported in Section 4.1 in terms of the luminosity. To discuss whether or not SF can reproduce 1042 erg s-1, we refer to Brorby et al. (2016). They derived a correlation between the X-ray (0.5–8 keV) luminosity, SFR, and oxygen abundance ratio (12 + (O/H)) for Lyman break analogues: supercompact, UV-luminous galaxies at 0.3, regarded as nearby analogues of more distant Lyman break galaxies such as GPs. The SFR used in the correlation is defined as the sum of dust-obscured and un-obscured SFRs (Brorby & Kaaret, 2017) (see also Hirashita et al., 2003). The dust un-obscured SFRs of 59 yr-1 for J0749+3337 and 37 yr-1 for J0749+3337 derived by Cardamone et al. (2009) may therefore be underestimated. Thus, by dividing the un-obscured H-based SFRs with an absorbed Lyman continuum fraction of (Hirashita et al., 2003), we estimate the total SFRs to be 12351 yr-1 and 78 yr-1 for J0749+3337 and J0822+2241, respectively. Regarding the stellar mass and oxygen abundance ratio, we adopt those from Izotov et al. (2011). The two values were derived, respectively, based on SED fits and the so-called direct method, which uses the electron temperature within the [O III] zone from the [O III]/(+) line ratio. Then, predicted 0.5–8 keV luminosities from the correlation are (1) for J0749+3337 and (1) for J0822+2241. These are consistent with the observed 0.5–8 keV luminosities of for J0749+3337 and for J0822+2241. Thus, the soft X-ray emission can be ascribed solely to SF, or likely HMXBs. Therefore, we cannot detect any evidence for soft X-ray emission from AGNs.
5.2 NuSTAR Non-detection due to Heavy Obscuration?
The 22 m luminosities of our sample would seem to originate from AGN emission, and their expected luminosities would be (see Section 2). However, NuSTAR does not show any significant detection from those sources. This seemingly contradictory result could be naturally described if the central engine is heavily obscured. Mainly utilizing the NuSTAR 8–24 keV data, we compute how large absorbing hydrogen column densities are required to be consistent with the non-detection.
We construct our model by adopting a Monte-Carlo-based numerical AGN torus model
viviviThe model is available from
https://heasarc.gsfc.nasa.gov/xanadu/xspec/models/etorus.htmle-torus.
The original version was created by Ikeda et al. (2009) and has often been used to study
AGN tori (e.g., Tazaki et al., 2013; Kawamuro et al., 2013, 2016b; Ricci et al., 2013, 2014; Guainazzi et al., 2016; Tanimoto et al., 2016, 2018; Oda et al., 2018; Yamada et al., 2018).
The e-torus model calculates reflected spectra from constant-density cold matter that has two
cone-shaped holes along the polar axis (see Figure 2 of Ikeda et al., 2009). The ratio of
the inner and outer radii is fixed at 0.01. The solar metal abundance is adopted. The torus
property is determined by the hydrogen column density in the equatorial plane (),
and the half opening () and inclination () angles.
These angles are defined so that 0∘ and 90∘ correspond to the pole direction and
the equatorial direction, respectively. The GPs are optically non-active galaxies, implying that
a torus with a small opening angle prevents formation of the narrow line region (i.e., Ueda et al., 2007).
Thus, within the acceptable range of –,
we adopt = 10∘, corresponding to a covering factor of 98%,
while is set to 60∘ as a representative value to ensure an
obscured AGN. The primary X-ray emission is modeled by a cut-off power law
spectrum with a high-energy cut-off of 360 keV and (e.g., Kawamuro et al., 2016a).
Adopting alternative values (i.e., , , and
) instead of the default values, we can confirm that our
conclusion is little affected. Specifically, our model is represented as
 torusabs*zpowerlw*zhighect
  +zpowerlw*zhighect
   *mtable{e-torus_20161121_2500M.fits}
  +atable{refl_fe_torus.fits}
  +[Best-fit Model of the XMM-Newton Spectra],
almost the same as those used in past studies (e.g., Tanimoto et al., 2018; Oda et al., 2018). From the first to the third terms, we take account of the absorbed cut-off power law component from an AGN, the reflected emission, and the accompanying 6.4 keV iron-K line. The fourth term means that we include emission expected from each best-fit model (Model1) determined in the XMM-Newton spectra (Section 4.1).
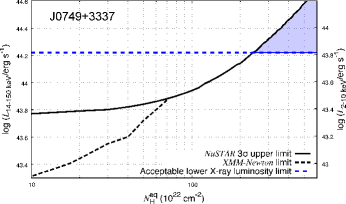
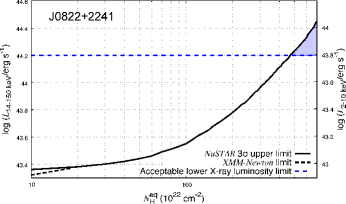
We estimate power law normalizations that reproduce the 3 source count rates for various column densities in the equatorial plane (), and compute corresponding intrinsic X-ray luminosities. The result is plotted in Figure 5 and is compared with the 14–150 keV (plus 2–10 keV) luminosities expected from the 22 m ones to constrain acceptable ranges of . A point of concern is that when the column density is lower than a certain value, the torus models tend to exceed the XMM-Newton spectra while being consistent with the NuSTAR observations. Therein, we take account of the maximum luminosity accepted by the XMM-Newton spectra and also plot the results. Specifically, we fit a suite of torus models having a given column density with various normalizations together with an absorbed power law model to the XMM-Newton spectra. Then, we compute , , and following Kaastra (2017). Finally, we search for a maximum normalization where , equivalent to 3, and plot the corresponding luminosity. Eventually, Figure 5 indicates that the column density () must be larger than cm-2 for J0749+3337 and cm-2 for J0822+2241. Thus, if present, their AGNs should be heavily obscured.
The low metal abundances of the GPs make photoelectric absorption more ineffective compared with solar absorption. In this case, higher column densities are needed. As a simple estimate, by considering that the column density is inversely proportional to the metal abundance for a given level of absorption, cm-2 for J0749+3337 and cm-2 for J0822+2241 are expected. The estimate may be reasonable but un-rigorous for various reasons; for example, the reflection component seen around 30 keV and the Compton scattering are not taken into consideration in this discussion.
5.3 MIR Emission due to SF?
We also discuss another possibility for a non-AGN case for our GPs. In this case, the red MIR colors and steep spectral slopes may be ascribed to YSOs. Note that the asymptotic giant branch (AGB) star is another stellar MIR emitter, but is not likely to be the main source given that the W3-W4 colors of our GPs (3.6 and 2.9 for J0749+3337 and J0822+2241) are redder than expected from usual AGBs (2; Koenig & Leisawitz, 2014; Lian et al., 2014). It has been suggested that very young YSOs in particular, with an age a few Myr show NIR and MIR emission from optically thick disks (e.g., Lada, 1987; Strom et al., 1989; Haisch et al., 2001; Dunham et al., 2014). Motivated by this fact, some studies proposed selection and classification criteria for YSOs that use the WISE data (e.g., Koenig & Leisawitz, 2014; Kang et al., 2017). The results indicate that Class I and II YSOs have MIR colors similar to those observed in luminous AGNs; that is, in our GPs as well. Moreover, a MIR index defined as has often been used for the classification of conventional YSO classes. (Greene & Lada, 1996; Marton et al., 2013; Majaess, 2013; Kang et al., 2017). Characterizing the MIR slopes of our GPs based on Marton et al. (2013), we find that they show , consistent with those of Class I YSOs. Thus, if SF is the main source that powers the MIR emission, the Class I YSO is a plausible type of star that mainly contributes to it. This YSO interpretation is consistent with the idea that GPs correspond to an early phase of galaxy formation.
6 Summary
To discuss whether or not the two GPs (J0749+3337 and J0822+2241) host AGNs, suggested from the MIR WISE observations, we obtained the initial hard X-ray ( 10 keV) data using NuSTAR. Then, including the XMM-Newton data ( 10 keV), we explored X-ray evidence for the presence of an AGN. Our results are summarized as follows.
-
•
Both GPs were detected in all WISE bands, and have red colors, steep spectral indices of , and higher MIR luminosities (– erg s-1) than expected from the H emission. These data are consistent with the presence of an AGN.
-
•
We detected no significant hard X-ray (8–24 keV) emission from the GPs.
-
•
Soft (0.4–7 keV) X-ray emission was significantly () detected. The 0.5–8 keV luminosities reach erg s-1, and can be explained by SF only.
-
•
Considering the AGN X-ray luminosities expected from the MIR data, we estimated the minimum column densities required to be consistent with the non-detection by NuSTAR. The result indicated that if present, the AGNs in J0749+3337 and J0822+2241 were obscured with column densities cm-2 and cm-2, respectively. If smaller abundances were assumed, larger column densities of cm-2 for J0749+3337 and cm-2 for J0822+2241 were expected.
-
•
Finally, the possibility remains that no AGN exists and is not the main source that powers the MIR emission. In this case, young Class I YSOs would be plausible main contributors in the MIR band (Section 5.3). This is consistent with a previous study (Section 1) where low-mass galaxies with active SF, such as GPs, probably in an early phase of galaxy growth, were suggested to reproduce photometric MIR properties similar to those of AGN hosts. If true, this implies that diagnostics that use MIR photometry data alone may misidentify such galaxies as AGNs.
To finally distinguish between the two possibilities, MIR spectroscopy may be an option. Detection of a deep silicate absorption feature at 9.7 m may favor the presence of an AGN deeply embedded in the dust (e.g., Dudley & Wynn-Williams, 1997; Evans et al., 2003), because it is difficult to produce if sources are largely distributed, as in SF. Also, equivalent widths of PAH emission may be examined given that a lower (higher) value is expected if an AGN (SB) dominates the MIR emission (e.g., Imanishi et al., 2007; Veilleux et al., 2009). In the future, the JWST/MIRI spectroscopy observation with high sensitivity will be a promising way to draw a strong conclusion.
References
- Alonso-Herrero et al. (2006) Alonso-Herrero, A., Pérez-González, P. G., Alexander, D. M., et al. 2006, ApJ, 640, 167
- Arnaud (1996) Arnaud, K. A. 1996, Astronomical Data Analysis Software and Systems V, 101, 17
- Baldassare et al. (2015) Baldassare, V. F., Reines, A. E., Gallo, E., & Greene, J. E. 2015, ApJ, 809, L14
- Basu-Zych et al. (2013) Basu-Zych, A. R., Lehmer, B. D., Hornschemeier, A. E., et al. 2013, ApJ, 774, 152
- Begelman et al. (2006) Begelman, M. C., Volonteri, M., & Rees, M. J. 2006, MNRAS, 370, 289
- Bogdán & Gilfanov (2011) Bogdán, Á., & Gilfanov, M. 2011, MNRAS, 418, 1901
- Brorby et al. (2016) Brorby, M., Kaaret, P., Prestwich, A., & Mirabel, I. F. 2016, MNRAS, 457, 4081
- Brorby & Kaaret (2017) Brorby, M., & Kaaret, P. 2017, MNRAS, 470, 606
- Bromm & Yoshida (2011) Bromm, V., & Yoshida, N. 2011, ARA&A, 49, 373
- Cardamone et al. (2009) Cardamone, C., Schawinski, K., Sarzi, M., et al. 2009, MNRAS, 399, 1191
- Cash (1979) Cash, W. 1979, ApJ, 228, 939
- Chakraborti et al. (2012) Chakraborti, S., Yadav, N., Cardamone, C., & Ray, A. 2012, ApJ, 746, L6
- Chen et al. (2017) Chen, C.-T. J., Brandt, W. N., Reines, A. E., et al. 2017, ApJ, 837, 48
- Dudley & Wynn-Williams (1997) Dudley, C. C., & Wynn-Williams, C. G. 1997, ApJ, 488, 720
- Dunham et al. (2014) Dunham, M. M., Stutz, A. M., Allen, L. E., et al. 2014, Protostars and Planets VI, 195.
- Evans et al. (2003) Evans, A. S., Becklin, E. E., Scoville, N. Z., et al. 2003, AJ, 125, 2341
- Forster et al. (2014) Forster, K., Harrison, F. A., Dodd, S. R., et al. 2014, Proc. SPIE, 9149, 91490R
- Fragos et al. (2013) Fragos, T., Lehmer, B., Tremmel, M., et al. 2013, ApJ, 764, 41
- Gandhi et al. (2015) Gandhi, P., Yamada, S., Ricci, C., et al. 2015, MNRAS, 449, 1845
- Gebhardt et al. (2000) Gebhardt, K., Bender, R., Bower, G., et al. 2000, ApJ, 539, L13
- Gilfanov (2004) Gilfanov, M. 2004, MNRAS, 349, 146
- Greene & Lada (1996) Greene, T. P., & Lada, C. J. 1996, AJ, 112, 2184
- Greene (2012) Greene, J. E. 2012, Nature Communications, 3, 1304
- Gürkan et al. (2004) Gürkan, M. A., Freitag, M., & Rasio, F. A. 2004, ApJ, 604, 632
- Guainazzi et al. (2016) Guainazzi, M., Risaliti, G., Awaki, H., et al. 2016, MNRAS, 460, 1954
- Gültekin et al. (2009) Gültekin, K., Cackett, E. M., Miller, J. M., et al. 2009, ApJ, 706, 404
- Hainline et al. (2016) Hainline, K. N., Reines, A. E., Greene, J. E., & Stern, D. 2016, ApJ, 832, 119
- Haisch et al. (2001) Haisch, K. E., Jr., Lada, E. A., Piña, R. K., Telesco, C. M., & Lada, C. J. 2001, AJ, 121, 1512
- Harrison et al. (2013) Harrison, F. A., Craig, W. W., Christensen, F. E., et al. 2013, ApJ, 770, 103
- Hasinger et al. (2005) Hasinger, G., Miyaji, T., & Schmidt, M. 2005, A&A, 441, 417
- Haehnelt & Rees (1993) Haehnelt, M. G., & Rees, M. J. 1993, MNRAS, 263, 168
- Henry et al. (2015) Henry, A., Scarlata, C., Martin, C. L., & Erb, D. 2015, ApJ, 809, 19
- Hirashita et al. (2003) Hirashita, H., Buat, V., & Inoue, A. K. 2003, A&A, 410, 83
- Ichikawa et al. (2014) Ichikawa, K., Imanishi, M., Ueda, Y., et al. 2014, ApJ, 794, 139
- Ichikawa et al. (2017) Ichikawa, K., Ricci, C., Ueda, Y., et al. 2017, ApJ, 835, 74
- Ikeda et al. (2009) Ikeda, S., Awaki, H., & Terashima, Y. 2009, ApJ, 692, 608
- Imanishi et al. (2001) Imanishi, M., Dudley, C. C., & Maloney, P. R. 2001, ApJ, 558, L93
- Imanishi et al. (2006) Imanishi, M., Dudley, C. C., & Maloney, P. R. 2006, ApJ, 637, 114
- Imanishi et al. (2007) Imanishi, M., Dudley, C. C., Maiolino, R., et al. 2007, ApJS, 171, 72
- Imanishi et al. (2008) Imanishi, M., Nakagawa, T., Ohyama, Y., et al. 2008, PASJ, 60, S489
- Imanishi et al. (2010) Imanishi, M., Nakagawa, T., Shirahata, M., Ohyama, Y., & Onaka, T. 2010, ApJ, 721, 1233
- Izotov et al. (2011) Izotov, Y. I., Guseva, N. G., & Thuan, T. X. 2011, ApJ, 728, 161
- Jarrett et al. (2011) Jarrett, T. H., Cohen, M., Masci, F., et al. 2011, ApJ, 735, 112
- Jaskot & Oey (2013) Jaskot, A. E., & Oey, M. S. 2013, ApJ, 766, 91
- Jansen et al. (2001) Jansen, F., Lumb, D., Altieri, B., et al. 2001, A&A, 365, L1
- Kaastra (2017) Kaastra, J. S. 2017, A&A, 605, A51
- Kauffmann et al. (2003) Kauffmann, G., Heckman, T. M., Tremonti, C., et al. 2003, MNRAS, 346, 1055
- Kalberla et al. (2005) Kalberla, P. M. W., Burton, W. B., Hartmann, D., et al. 2005, A&A, 440, 775
- Kang et al. (2017) Kang, S.-J., Kerton, C. R., Choi, M., & Kang, M. 2017, ApJ, 845, 21
- Kawamuro et al. (2013) Kawamuro, T., Ueda, Y., Tazaki, F., & Terashima, Y. 2013, ApJ, 770, 157
- Kawamuro et al. (2016b) Kawamuro, T., Ueda, Y., Tazaki, F., Terashima, Y., & Mushotzky, R. 2016, ApJ, 831, 37
- Kawamuro et al. (2016a) Kawamuro, T., Ueda, Y., Tazaki, F., Ricci, C., & Terashima, Y. 2016, ApJS, 225, 14
- Kewley et al. (2001) Kewley, L. J., Dopita, M. A., Sutherland, R. S., Heisler, C. A., & Trevena, J. 2001, ApJ, 556, 121
- Koenig & Leisawitz (2014) Koenig, X. P., & Leisawitz, D. T. 2014, ApJ, 791, 131
- Kormendy & Richstone (1995) Kormendy, J., & Richstone, D. 1995, ARA&A, 33, 581
- Kormendy & Ho (2013) Kormendy, J., & Ho, L. C. 2013, ARA&A, 51, 511
- Laag et al. (2010) Laag, E., Croft, S., Canalizo, G., et al. 2010, AJ, 140, 2052.
- Lada (1987) Lada, C. J. 1987, Star Forming Regions, 115, 1
- Lee et al. (2013) Lee, J. C., Hwang, H. S., & Ko, J. 2013, ApJ, 774, 62
- Lian et al. (2014) Lian, J., Zhu, Q., Kong, X., & He, J. 2014, A&A, 564, A84
- Linden et al. (2010) Linden, T., Kalogera, V., Sepinsky, J. F., et al. 2010, ApJ, 725, 1984
- Lintott et al. (2008) Lintott, C. J., Schawinski, K., Slosar, A., et al. 2008, MNRAS, 389, 1179
- Lodato & Natarajan (2006) Lodato, G., & Natarajan, P. 2006, MNRAS, 371, 1813
- Madsen et al. (2017) Madsen, K. K., Beardmore, A. P., Forster, K., et al. 2017, AJ, 153, 2
- Magorrian et al. (1998) Magorrian, J., Tremaine, S., Richstone, D., et al. 1998, AJ, 115, 2285
- Mainzer et al. (2011) Mainzer, A., Grav, T., Bauer, J., et al. 2011, ApJ, 743, 156
- Majaess (2013) Majaess, D. 2013, Ap&SS, 344, 175.
- Marconi & Hunt (2003) Marconi, A., & Hunt, L. K. 2003, ApJ, 589, L21
- Marconi et al. (2004) Marconi, A., Risaliti, G., Gilli, R., et al. 2004, MNRAS, 351, 169
- Marton et al. (2013) Marton , G., Verebélyi, E., Kiss, C., et al. 2013, Astronomische Nachrichten, 334, 924.
- Mateos et al. (2012) Mateos, S., Alonso-Herrero, A., Carrera, F. J., et al. 2012, MNRAS, 426, 3271
- Mezcua et al. (2016) Mezcua, M., Civano, F., Fabbiano, G., Miyaji, T., & Marchesi, S. 2016, ApJ, 817, 20
- Mezcua et al. (2018) Mezcua, M., Civano, F., Marchesi, S., et al. 2018, MNRAS, 478, 2576
- Mineo et al. (2012) Mineo, S., Gilfanov, M., & Sunyaev, R. 2012, MNRAS, 426, 1870
- Mullaney et al. (2011) Mullaney, J. R., Alexander, D. M., Goulding, A. D., & Hickox, R. C. 2011, MNRAS, 414, 1082
- Nguyen et al. (2017) Nguyen, D. D., Seth, A. C., den Brok, M., et al. 2017, ApJ, 836, 237
- Nguyen et al. (2018) Nguyen, D. D., Seth, A. C., Neumayer, N., et al. 2018, ApJ, 858, 118
- Oda et al. (2018) Oda, S., Ueda, Y., Tanimoto, A., & Ricci, C. 2018, ApJ, 855, 79
- Polletta et al. (2007) Polletta, M., Tajer, M., Maraschi, L., et al. 2007, ApJ, 663, 81
- Reines & Comastri (2016) Reines, A. E., & Comastri, A. 2016, PASA, 33, e054
- Ricci et al. (2013) Ricci, C., Paltani, S., Awaki, H., et al. 2013, A&A, 553, A29
- Ricci et al. (2014) Ricci, C., Ueda, Y., Paltani, S., et al. 2014, MNRAS, 441, 3622
- Sartori et al. (2015) Sartori, L. F., Schawinski, K., Treister, E., et al. 2015, MNRAS, 454, 3722
- Satyapal et al. (2014) Satyapal, S., Secrest, N. J., McAlpine, W., et al. 2014, ApJ, 784, 113
- Secrest et al. (2015) Secrest, N. J., Satyapal, S., Gliozzi, M., et al. 2015, ApJ, 798, 38
- Shankar et al. (2004) Shankar, F., Salucci, P., Granato, G. L., De Zotti, G., & Danese, L. 2004, MNRAS, 354, 1020
- Stern et al. (2012) Stern, D., Assef, R. J., Benford, D. J., et al. 2012, ApJ, 753, 30
- Strom et al. (1989) Strom, K. M., Newton, G., Strom, S. E., et al. 1989, ApJS, 71, 183
- Svoboda et al. (2018) Svoboda, J., Douna, V., Ehle, M., & Orlitová, I. 2018, arXiv:1810.09318
- Tanimoto et al. (2016) Tanimoto, A., Ueda, Y., Kawamuro, T., & Ricci, C. 2016, PASJ, 68, S26
- Tanimoto et al. (2018) Tanimoto, A., Ueda, Y., Kawamuro, T., et al. 2018, ApJ, 853, 146
- Tazaki et al. (2013) Tazaki, F., Ueda, Y., Terashima, Y., Mushotzky, R. F., & Tombesi, F. 2013, ApJ, 772, 38
- Thornton et al. (2008) Thornton, C. E., Barth, A. J., Ho, L. C., Rutledge, R. E., & Greene, J. E. 2008, ApJ, 686, 892
- Ueda et al. (2003) Ueda, Y., Akiyama, M., Ohta, K., & Miyaji, T. 2003, ApJ, 598, 886
- Ueda et al. (2007) Ueda, Y., Eguchi, S., Terashima, Y., et al. 2007, ApJ, 664, L79
- Ueda et al. (2014) Ueda, Y., Akiyama, M., Hasinger, G., Miyaji, T., & Watson, M. G. 2014, ApJ, 786, 104
- Ueda et al. (2015) Ueda, Y., Hashimoto, Y., Ichikawa, K., et al. 2015, ApJ, 815, 1
- Wilms et al. (2000) Wilms, J., Allen, A., & McCray, R. 2000, ApJ, 542, 914
- Winston et al. (2007) Winston, E., Megeath, S. T., Wolk, S. J., et al. 2007, ApJ, 669, 493
- Wright et al. (2010) Wright, E. L., Eisenhardt, P. R. M., Mainzer, A. K., et al. 2010, AJ, 140, 1868
- Veilleux et al. (2009) Veilleux, S., Rupke, D. S. N., Kim, D.-C., et al. 2009, ApJS, 182, 628
- Volonteri et al. (2008) Volonteri, M., Lodato, G., & Natarajan, P. 2008, MNRAS, 383, 1079
- Volonteri (2010) Volonteri, M. 2010, A&A Rev., 18, 279
- Yamada et al. (2018) Yamada, S., Ueda, Y., Oda, S., et al. 2018, ApJ, 858, 106
- Yang et al. (2016) Yang, H., Malhotra, S., Gronke, M., et al. 2016, ApJ, 820, 130