The GMRT High Resolution Southern Sky Survey for pulsars and transients -II. New discoveries, timing and polarization properties
Abstract
We have been conducting the GMRT High Resolution Southern Sky (GHRSS) survey for the last four years and have discovered 18 pulsars to date. The GHRSS survey is an off-Galactic-plane survey at 322 MHz in a region of the sky (declination range 40° to 54°) complementary to other ongoing low-frequency surveys. In this paper we report the discovery of three pulsars, PSRs J123948, J151643 and J172652. We also present timing solutions for three pulsars previously discovered with the GHRSS survey: PSR J21445237, a millisecond pulsar with a period ms in a 10 day orbit around a 0.18 M companion; PSR J151643, a mildly recycled ms pulsar in a 228 day orbit with a companion of mass 0.4 M; and the ms PSR J05144408 which we show is a source of pulsed -ray emission. We also report radio polarimetric observations of three of the GHRSS discoveries, PSRs J04184154, J05144408 and J21445237.
1 Introduction
Neutron stars are accessible to observations as pulsars and provide a valuable means for probing the behaviour of matter, energy, space and time under extraordinarily diverse conditions. Studies of normal pulsars having spin period 30 ms can reveal interesting properties like glitches, profile state changes, nulling and intermittency (e.g. lyne96, kramer06). The extreme stability of the spin of millisecond pulsars (MSPs) makes them ideal laboratories to test the physics of gravity (lee12). In spite of the fact that the rates of discovery of pulsars in ongoing surveys at major telescopes over the last decade have increased dramatically, the presently known population of about 2600 pulsars is less than 5% of the predicted number of detectable radio pulsars (faucher06). A large fraction of the pulsars are faint sources requiring sensitive searches and improved analysis techniques for discovery. Pulsar surveys are sensitivity limited, hence the design of more sensitive instruments promises a higher discovery rate. Large arrays of many smaller telescopes is one possible strategy for sensitivity improvement and is implemented in the Giant Metrewave Radio Telescope (GMRT111http://gmrt.ncra.tifr.res.in). It is the largest array telescope at metre wavelengths and has the potential to undertake sensitive pulsar searches, a potential which was confirmed with the discovery of 23 pulsars in targeted and blind searches (bh13, bh16). We have been carrying out the GMRT High Resolution Southern Sky (GHRSS) survey using the 32 MHz bandwidth GMRT Software Backend (GSB, roy10) for pulsars and transients since the fall of 2013. In this paper, the 32 MHz bandwidth component of the GHRSS survey will be notated as GHRSS “phase-1”. The GHRSS phase-1 is an off-Galactic-plane ( 5°) survey at 322 MHz whose declination range of 40° to 54° complements other ongoing low-frequency surveys with the GBT222http://arcc.phys.utb.edu/gbncc/ and LOFAR333http://www.astron.nl/lotaas. The survey description and initial discovery of 10 pulsars are reported in bh16. Beginning in late 2017, we embarked on phase-2 of this survey with the upgraded GMRT using up to 200 MHz of bandwidth (Roy et al. 2018). The survey description and discoveries with the GHRSS phase-2 will be reported in a follow up paper.
Following the discovery of a pulsar, the next essential step is regular timing to characterize its nature, rotation properties, and companion type and orbital properties if in a binary system. Precise localistion of the newly discovered pulsars by the GMRT interferometric array reduces the discovery positional uncertainty of 40′ to the size of the synthesized beam of the array, 10″ (roy13, roy12). This allowed us to carry out more sensitive follow up observations with the narrower coherent array beam.
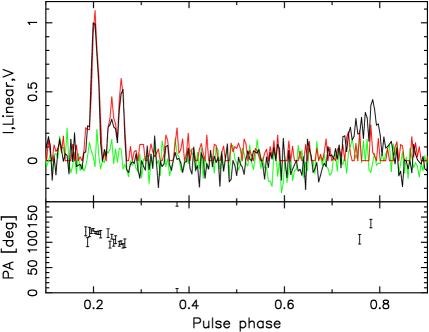
Radiation from pulsars is believed to originate from the particles streaming outward along the open field lines above the poles of an essentially dipolar magnetic field. Linear polarization at any point in the profile is related to the orientation of the magnetic field at the corresponding point of origin. In the simplest form the position angle (PA) of the linear polarization within the pulse window rotates smoothly as a function of longitude in an “S” shaped fashion described within the “rotating vector model” (rc69). Studying the polarization of radio pulsars is important for understanding the geometry and underlying emission mechanisms. We performed polarization studies of three of the pulsars discovered with GHRSS phase-1 survey with the Parkes telescope.
| Pulsar name | Period | Dispersion measure | Detection significance | Flux density |
| (ms) | (pc cm) | () | (mJy) | |
| PSR J04184154 | 757.11 | 24.325(9) | 50 | 10.3 |
| PSR J05144408 | 320.27 | 15.122(6) | 42 | 9.7 |
| PSR J123948 | 653.9 | 107.6 | 21 | 0.4 |
| PSR J151643 | 36.02 | 70.3 | 9 | 0.7 |
| PSR J172652 | 631.8 | 119.7 | 8 | 0.7 |
| PSR J21445237 | 5.04 | 19.5465(2) | 9 | 1.6 |
We announce the discovery of the pulsars marked in bold face in this paper.
Uncertainty in dispersion measure value in the last digit are quoted in the parentheses for the pulsars for which accurate measurement is possible with long-term timing
: Flux density is without primary beam correction for the three newly discovered pulsars.
: Please note that there was a typo in the period mentioned for this pulsar in P1.
Section 2 of this paper details the search and timing observations with the GMRT and polarization observations with Parkes. We describe the discovery of three pulsars, PSRs J123948, J151643 and J172652, in Section 3.1. Section 3.2 details the timing study of PSR J05144408 (originally reported as J05144407 in P1), mildly recycled pulsar J151643, and MSP J21445237. Section 3.3 details the detection of -ray pulses from PSR J05144408 with the Fermi Large Area Telescope (LAT). Section LABEL:sec:polarization describes the polarization properties of three of the GHRSS pulsars, J04184154, J05144408 MSP J21445237. In Section LABEL:sec:discussion we present discussion of the results and the summary.
|

2 Observation and analysis
| Name | J05144408 | J21445237 |
| Gated imaging position | ||
| Right ascension (J2000) | 051451.84(1.04) | 214439.2(65.7) |
| Declination (J2000) | 44°07′0651(84) | 52°37′3217(38) |
| Parameters from radio and -ray timing | ||
| Right ascension (J2000) | 051452190(3) | 21443565(6) |
| Declination (J2000) | 44°08′3738(2) | 52°37′0753(2) |
| Pulsar frequency (Hz) | 3.122357486324(6) | 198.3554831467(9) |
| Pulsar frequency derivative (Hz s) | 1.99080(1)10 | 3.50(2)10 |
| Period epoch (MJD) | 57330 | 57328 |
| Dispersion measure DM (pc cm) | 15.122(6) | 19.5465(2) |
| Binary model | ELL1 | |
| Orbital period (days) | 10.5803185(2) | |
| Projected semi-major axis (lt-s) | 6.361098(1) | |
| Epoch of ascending node passage (MJD) | 57497.785577172346066(1) | |
| Timing Data Span | 54715.258271.5 | 57167.958245.1 |
| Number of TOAs | 155 | 217 |
| Reduced Chi-square | 1.4 | 2.9 |
| Post-fit residual rms (ms) | 0.459 | 0.024 |
| Derived parameters | ||
| Period (ms) | 320.270822408985(6) | 5.04145377851813(2) |
| Period Derivative (s/s) | 2.04203(2)10 | 8.89(7)10 |
| Total time span (yr) | 9.7 | 2.9 |
| Spin down energy loss rate (erg/s) | 2.410 | 2.710 |
| Characteristic age (yr) | 2.510 | 8.910 |
| Surface magnetic flux density (Gauss) | 8.210 | 2.110 |
| Rotation measure (rad m) | 17.3 | 25.1 |
| DM distance (kpc) | 0.8 | 0.8 |
| DM distance (kpc) | 0.9 | 1.6 |
Errors correspond to 1.
DM values are calculated from fitting sub-band TOAs from 300500 MHz wide observing band of uGMRT
using the cl01 model of electron distribution
using the yao17 model of electron distribution
We note that the calculated DM distance is model dependent.
Timing uses DE421 solar system ephemeris.
The observing setup for GHRSS phase-1 is detailed in P1. The GMRT is a multi-element aperture synthesis telescope consisting of 30 antennas, each 45 m diameter, spread over a 25 km-diameter region and operating at 5 frequencies ranging from 150 MHz to 1450 MHz (swarup97). The observations used the GMRT Software Backend, a fully real-time backend utilizing an FX correlator444http://www.gmrt.ncra.tifr.res.in/gmrt_hpage/Users/doc/WEBLF/LFRA/node76.html and a beamformer for an array of 32 dual polarized signals Nyquist sampled at 33 or 66 MHz (roy10). For the survey observations we used 61.44 s time resolution with 16.275 kHz frequency resolution over 32 MHz observing bandwidth for mid-Galactic latitudes and 30.72 s time resolution with 32.55 kHz frequency resolution over 32 MHz observing bandwidth for high-Galactic latitudes. A factor of two better frequency resolution is used at mid-Galactic latitudes to compensate for larger dispersion smearing. The calculated theoretical search sensitivity for a 15 min GHRSS pointing with incoherent array gain of 2.5 K/Jy at 322 MHz is 0.5 mJy for a 5 detection assuming a 10% duty cycle and a total system temperature at 322 MHz of 106 K (P1; for minimum T of GHRSS). As demonstrated in P1 (Fig. 10), the observed GHRSS survey sensitivity is within 50% of the theoretical one, thus allowing us to detect faint pulsars. We recorded Stokes-I at a data rate of 32 MB/s for 8 bit samples. We used the wider incoherent beam of the GMRT (FWHM of 80′ at 322 MHz), which is ideal for blind pulsar surveys. With 60% of the GHRSS survey (1800 deg) we have collected about 30 TB of data. We searched for pulsations using a 512 core cluster (10 Tflops) at the National Centre for Radio Astrophysics (NCRA) and a prestobased (Ransom02) pipeline. The dedispersion range used in the search is 0 to 500 pc cm (discussed in P1). We used an acceleration search allowing for up to 5 m s line-of-sight acceleration for a 2 ms pulsar over 15 mins of observing duration and up to 8 harmonics were used in harmonic summing. Further details about the search analysis pipeline can be found in P1.
| Right ascension (J2000) | 15163231(1.09) |
|---|---|
| Declination (J2000) | 43°20′0000(10) |
| Pulsar frequency (Hz) | 27.760652(2) |
| Period epoch (MJD) | 57575.4 |
| Dispersion measure DM (pc cm) | 70.3 |
| Binary model | BT |
| Orbital period (days) | 228.4(1) |
| Projected semi-major axis (lt-s) | 1.0(1) |
| Epoch of ascending node passage (MJD) | 57575.419(1) |
| Number of TOAs | 40 |
| Reduced Chi-square | 1.04 |
| Derived parameters | |
| Period (ms) | 36.022209(2) |
| DM distance (kpc) | 1.8 |
| DM distance (kpc) | 3.0 |
| Total time span (yr) | 520 days |
used by fitorbit software
using the cl01 model of electron distribution
using the yao17 model of electron distribution
We note that the calculated DM distance is model dependent.

|
We can localise the newly discovered pulsars and transients in the image plane with the GMRT interferometric array with an accuracy of better than 10″(half of the typical synthesized beam used in the image made at 322 MHz) using gated imaging of pulsars (roy13). For the pulsars which are localised in the image plane, we use the smaller field of view but more sensitive coherent array for follow up observations. Using the coherent array with the central core of the GMRT having 17 antennas (i.e. gain of 7 K/Jy) the timing sensitivity is 0.3 mJy for 10 detection. After discovery we started a regular timing campaign at 322 MHz. We used the highest signal-to-noise ratio profiles as templates for extracting times-of-arrival (TOAs). The TOAs are modeled using the standard pulsar timing software tempo2555http://www.atnf.csiro.au/research/pulsar/tempo2.
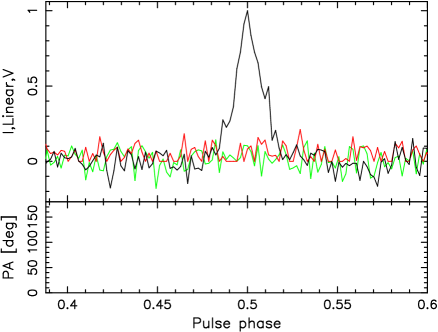
The polarimetric observations of the three GHRSS pulsars (J04184154, J05144408 and J21445237) were performed on the 10th of September 2017 with the Parkes radio telescope. We used the central beam of the multibeam receiver (Staveley96) and the PDFB4 backend at a central frequency of 1369 MHz and a bandwidth of 256 MHz. More details about the receiver and the backend used in this observation can be found in manchester13. The receiver consists of two linear, perpendicular dipoles which receive the orthogonal components of the incoming electric field. These two fields were correlated to produce the four Stokes parameters. The first half of each observation was performed with a feed angle rotation of , and the second half with a feed angle rotation of , allowing asymmetries in the performance of the two signal paths corresponding to the two polarizations to effectively cancel out. In order to calibrate for the leakage between the dipoles, a polarimetric calibration model (vs04) has been applied to the data, as derived for the Parkes Pulsar Timing Array project666https://www.atnf.csiro.au/research/pulsar/ppta/. For some additional details about the methodology we refer to wj08.
The observations were structured as follows: PSR J04184154 was observed for 3600 s, PSR J05144408 for 13500 s and PSR J21445237 for 12250 s (in folded mode with 30 s sub-integrations). A 120 s calibration observation with the noise diode switched on was performed before the first half and after the second half. Each half was calibrated using its corresponding polarization calibration observation. The two halves were added together to form the final integrated polarized profiles. The tools which were used to produce the plots in this section are part of the PSRSALSA777https://github.com/weltevrede/psrsalsa software package (wel16), publicly available at the link provided.
3 Results
3.1 New discoveries
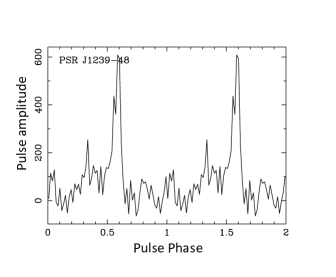
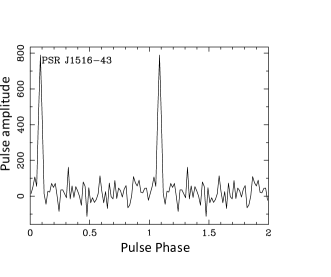
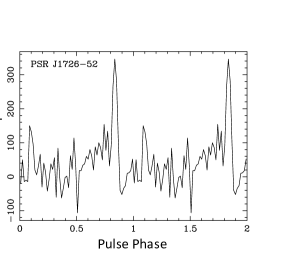
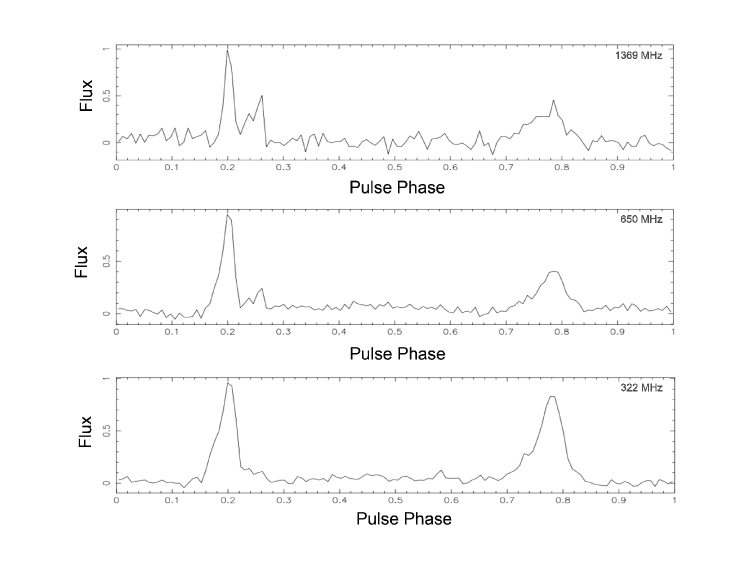
In this paper we announce the discovery of PSRs J123948, J151643 and J172652 in GHRSS phase-1. Fig. 1 shows the discovery profiles of these three pulsars. Table 1 presents the spin period, dispersion measure (DM) and flux density of these three pulsars marked in boldface. PSR J123948 is a 653.9 ms pulsar having a DM of 107.6 pc cm and estimated discovery flux density 0.4 mJy. PSR J151643 has a period of 36.02 ms, a DM of 70.3 pc cm, and a discovery flux density of 0.7 mJy. PSR J172652 is a 631.8 ms pulsar at a DM of 119.7 pc cm with a flux density 0.7 mJy. Detection of such faint pulsars with the GHRSS survey indicates that we are achieving our theoretical sensitivity limit of 0.5 mJy.
3.2 Timing study
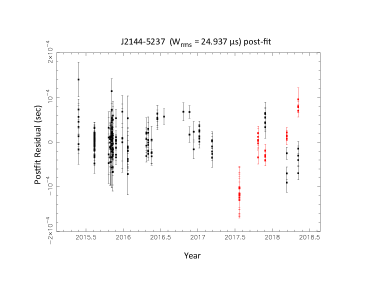
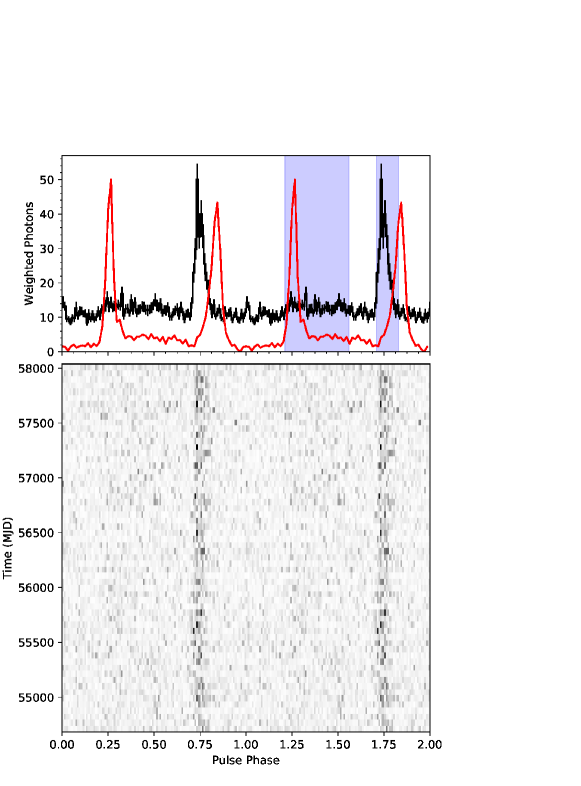
We have been performing timing observations at approximately monthly cadence (with 15 minutes integration) since the discovery and derived timing solutions for PSRs J05144408 and J21445237. The timing solutions for these two pulsars are presented in Table 2. We note that the timing position is off from the position derived from gated imaging. This could be due to the fact that these pulsars were observed at very low elevation angles (as the pulsars are very southern), so refractive effects can cause a significant shift between the measured position and the true position of the sources. Similar effects were also observed for other GHRSS discoveries reported in P1. The detection significance increase while pointing centre is at timing position. PSR J05144408 is a 320 ms pulsar with a Fermi LAT source 3FGL J0514.64406 1.8′ from the pulsar. Folding LAT photons with the radio timing model, we discovered ray pulsations from this pulsar, described in Section 3.3. Fig. 2 presents the radio and ray timing residuals for PSR J05144408. We have generated 38 TOAs from the Fermi LAT observations spanning 9.2 years, which are presented as blue points in Fig. 2. We checked the preliminary 8-year Fermi LAT catalog888Available at https://fermi.gsfc.nasa.gov/ssc/data/access/lat/8yr_catalog/ (4FGL) for positional associations with the other pulsars in Table 1 and found none. PSR J21445237 is a 5.04 ms pulsar in a binary with orbital period of 10.6 days for which the timing model is presented in Table 2 and timing residuals are plotted in Fig. 2. The calculated mass function (lorimer04) of PSR J21445237 is 0.002 M, which corresponds to a companion mass range of 0.18–0.46 M considering 90° and 25° inclination and a median mass of 0.20 M for 60° inclination.
Timing residuals for PSRs J05144408 and J21445237 contain measurements from simultaneous timing observations using the 32 MHz legacy system (black points) and the 200 MHz upgraded GMRT (red points), allowing us to determine the timing offset of 1.090011(1) seconds between them. This offset is also validated for two other GHRSS pulsars, PSRs J04184154 and J07024956, for which the timing solution is reported in P1. The timing offset of the legacy GMRT system is well characterized with the other telescopes like Parkes (roy15), GBT, Lovell, Effelsberg (Dolch14). Knowing the precise timing offset between 32 MHz legacy system and 200 MHz upgraded GMRT will allow combination of the upgraded GMRT data with data from other telescopes for high precision timing studies.
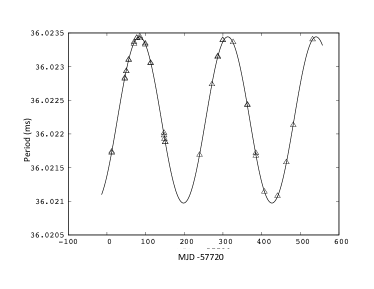
PSR J151643 is a mildly recycled pulsar in a binary orbit with an orbital period of 228 days. We determined best-fit barycentric periods at various epochs using psrtime999http://www.jb.man.ac.uk/pulsar/observing/progs/psrtime_commands.html. The time variations of these barycentric periods are fitted with a binary model using fitorbit, to derive a best-fit orbital solution. The periods and model are shown in the left panel of Fig. 3. The timing model for this pulsar is presented in Table 3, but we are yet to arrive at a long-term phase-connected timing solution due to large positional uncertainty ( 40′). The mass function of 0.0225 M corresponds to a companion mass range of 0.42–1.29 M and a median mass of 0.5 M for the same inclination angle ranges as above.
| Parameter | Phase-averaged | Peak 1 | Peak 2 |
|---|---|---|---|
| (10 cm s MeV) | 1.200.28 | 0.870.18 | 0.360.16 |
| 0.770.34 | 0.460.27 | 1.200.50 | |
| (MeV) | 560120 | 50080 | 590230 |
| (10 cm s) | 7.31.2 | 4.10.4 | 3.10.9 |
| (10 erg cm s) | 4.80.4 | 3.00.2 | 1.60.3 |
| TS | 409 | 883 | 94 |
| TS | 178 | 153 | 46 |
| TS | 1 | 0 | 1 |
Note: Column 1 reports results for the phase-averaged analysis described in Section 3.3.2. Columns 2 and 3 report results for the phase-resolved analyses for each peak in the -ray light curve as described in Section LABEL:lattime. The photon and energy fluxes reported in rows 4 and 5 are integrated from 0.1 to 100 GeV. All uncertainties are statistical only.
3.3 Discovery of -ray pulsations from PSR J05144408
3.3.1 LAT data selection and preparation
We selected Pass 8 LAT data spanning the time range from the start of science operations on 2008 August 4 up to 2017 October 12. We kept events belonging to the SOURCE class, as defined by the P8R2_SOURCE_V6 instrument response functions, with reconstructed directions within a 15 radius of the timing position of PSR J05144408; energies from 0.1 to 100 GeV; and zenith angles 90 to reduce contamination of Earth limb rays. We filtered the events to keep only data flagged as good and recorded when the LAT was in nominal science operations mode. All analyses of Fermi LAT data were done using v10r00p05 of the Fermi ScienceTools101010Available for download at
https://fermi.gsfc.nasa.gov/ssc/data/analysis/software/..
We constructed a spectral and spatial model of the region by including all sources from the third Fermi LAT catalog (3FGL, 3FGL) within 25 of PSR J05144408. For sources within 6 of PSR J05144408, we allowed the spectral parameters to be free only if they were found with an average significance of at least 5. We also allowed the spectral normalizations of sources within 8 of PSR J05144408 to vary if their 3FGL variability index surpassed the threshold for variability defined by 3FGL. The Galactic diffuse emission was modeled using the spectral and spatial template gll_iem_v06.fits, while the isotropic diffuse and misidentified cosmic-ray background emissions were modeled jointly with the spectral template111111Both background templates are available for download at
https://fermi.gsfc.nasa.gov/ssc/data/access/lat/BackgroundModels.html. iso_P8R2_SOURCE_V6_v06.txt (P8bkgds). We moved the 3FGL source associated with PSR J05144408 to the timing position keeping all the other sources in original 3FGL positions.
The 3FGL catalog was constructed using Pass 7 reprocessed data and covers only the first four years of the mission. As such, it was necessary to check our initial fits (see Section 3.3.2) for new sources in residual counts and test-statistic (TS, 3FGL) maps, where the TS is defined as twice the difference in log-likelihood when comparing the fit without the source in the model to the fit with the source. Doing so, we found that it was necessary to free the spectral normalizations of several sources that did not meet our initial criteria (namely, 3FGL J0438.84519, J0515.34557, J0533.83754, J0550.34521, and J0428.63756) and that we needed to add two additional sources not in the 3FGL catalog. One of the new sources was reported already as 2FAV J045146.8 (2FAV). GeV emission from the other new source, associated with PKS 043843, was first reported in an Astronomer’s Telegram (PKS0438ATel), with a more detailed analysis in a forthcoming paper (Cheung et al. in preparation).
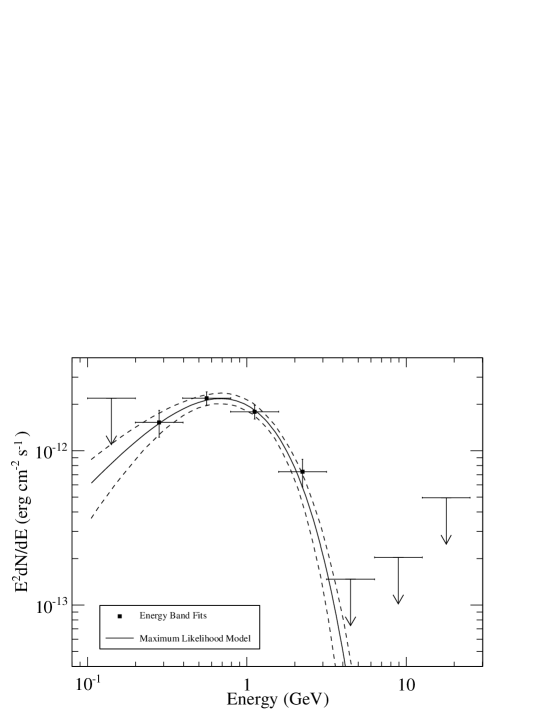
3.3.2 LAT spectral analysis
We performed a binned maximum likelihood spectral analysis on a region, using the data and region model described in Section 3.3.1. The spectrum of PSR J05144408 was modeled as a power law:
| (1) |
a power law with a simple exponential cutoff:
| (2) |
and a power law with a super- or sub-exponential cutoff:
| (3) |
In Equations 1-3, is a normalization parameter with units of MeV cm s; is a scale parameter, chosen to be 534 MeV, the PIVOT_ENERGY of the corresponding 3FGL source; and is the photon index. In Equations 2 and 3 is the cutoff energy, and the parameter in Equation 3 is the exponential index, which controls the strength of the spectral cutoff. Note that fixing returns Equation 2. The spectra of most -ray pulsars are well described by Equation 2, but the spectra of the brightest pulsars detected with the LAT are better fit with Equation 3 with , suggesting a sub-exponential cutoff (2PC).
| Parameter | Value |
|---|---|
| 0.7350.003 | |
| 0.0140.002 | |
| 0.0340.0030 | |
| 0.3930.021 | |
| 0.1370.017 |
Note: The peak widths () are given as half-width at half max values. For the two-sided Gaussian, refers to the leading side of the peak, earlier phases, while refers to the trailing side of the peak, later phases.