Swift UVOT Grism Observations of Nearby Type Ia Supernovae – II. Probing the Progenitor Metallicity of SNe Ia with Ultraviolet Spectra
Abstract
Ultraviolet (UV) observations of Type Ia supernovae (SNe Ia) are crucial for constraining the properties of their progenitor systems. Theoretical studies predicted that the UV spectra, which probe the outermost layers of a SN, should be sensitive to the metal content of the progenitor. Using the largest SN Ia UV ( Å) spectroscopic sample obtained from Neil Gehrels Swift Observatory, we investigate the dependence of UV spectra on metallicity. For the first time, our results reveal a correlation () between SN Ia UV flux and host-galaxy metallicities, with SNe in more metal-rich galaxies (which are likely to have higher progenitor metallicities) having lower UV flux level. We find that this metallicity effect is only significant at short wavelengths ( Å), which agrees well with the theoretical predictions. We produce UV spectral templates for SNe Ia at peak brightness. With our sample, we could disentangle the effect of light-curve shape and metallicity on the UV spectra. We also examine the correlation between the UV spectra and SN luminosities as parameterised by Hubble residuals. However, we do not see a significant trend with Hubble residuals. This is probably due to the large uncertainties in SN distances, as the majority of our sample members are extremely nearby (redshift ). Future work with SNe discovered in the Hubble flow will be necessary to constrain a potential metallicity bias on SN Ia cosmology.
keywords:
supernovae: general – supernovae1 Introduction
Type Ia supernovae (SNe Ia; see Filippenko 1997 for a review of SN classification) are remarkable cosmological standardisable candles that are consistently used to measure cosmological parameters (e.g., Riess et al., 1998; Perlmutter et al., 1999; Riess et al., 2007; Kessler et al., 2009; Suzuki et al., 2012; Rest et al., 2014; Betoule et al., 2014; Riess et al., 2016, 2018; Scolnic et al., 2018). Observations of SNe Ia provide a direct route to probe the nature of the dark energy that drives the accelerated expansion. As these studies become increasingly more precise, systematic uncertainties become a significant component of the error budget (e.g., Conley et al., 2011). Thus, one important consideration for their future use is how well we can understand the effect of underlying systematics and their evolution with redshift.
Theoretical studies suggested the progenitor metallicity could be one potential systematic that significantly alters SN Ia luminosities. Timmes et al. (2003) showed that the amount of 56Ni (which powers the SN light curve) produced during the SN explosion will strongly depend on the progenitor metallicity. SNe Ia with higher progenitor metallicities will generate more 14N during the hydrogen-burning stage and then convert to neutron-rich 22Ne during the helium-burning stage. This 22Ne will favour the production of stable and neutron-rich 58Ni instead of the radioactive 56Ni, resulting in fainter peak luminosity. The evolution of this metallicity effect is believed to have substantial bias on SN Ia cosmology (e.g., Podsiadlowski et al., 2006).
Technically, the direct measurement of SN progenitor properties is extremely difficult. Indirect methods like host-galaxy studies have been proven to be a profitable way to probe the astrophysical effects in SN progenitors (e.g., Kelly et al., 2010; Lampeitl et al., 2010; Sullivan et al., 2010; D’Andrea et al., 2011; Childress et al., 2013; Pan et al., 2014). Some studies found that SN Ia luminosities correlate with the host-galaxy metallicities even after the empirical corrections for light-curve width and colour (e.g., D’Andrea et al., 2011; Childress et al., 2013; Pan et al., 2014), in the sense that brighter SNe Ia (after corrections) tend to reside in more metal-rich galaxies. However, the host metallicities measured by these studies are mostly on a galactic scale. The discrepancy from the metallicity of the progenitor can be expected to deviate from the galactic mean.
Another promising alternative to constrain the progenitor metallicity is through ultraviolet (UV) observations of SNe Ia. Theoretical models suggested that the UV spectra of SNe Ia should be sensitive to the progenitor metallicity. SNe with higher progenitor metallicity will increase the iron-group elements (IGEs) in the outer layers of the SN and cause greater UV line blanketing (e.g., Höflich et al., 1998; Lentz et al., 2000). Thus, we should see a more suppressed UV flux for SNe having higher progenitor metallicities. This metallicity effect will only dramatically change the UV spectrum but not the optical spectrum, as the electron scattering opacity (which is not sensitive to the line-blanketing effect) is a more dominant factor than the line opacity in the optical (e.g., Ellis et al., 2008).
There have been many efforts to obtain UV spectra of SNe Ia (e.g., Kirshner et al., 1993; Ellis et al., 2008; Foley et al., 2008; Maguire et al., 2012). However, most of the spectra from these studies do not probe Å (which by theory is most sensitive to the progenitor metallicity). Several studies were able to obtain high signal-to-noise ratio (SNR) UV spectra that probe shorter wavelengths (down to Å; e.g., Foley et al., 2012b; Mazzali et al., 2014; Foley et al., 2014; Pan et al., 2015; Foley et al., 2016), but the relatively small sample size makes them unable to cover the diversity of SNe Ia and fully interpret the metallicity effect.
Recent observations of “twin” SN 2011by and SN 2011fe provide some evidence of a potential metallicity effect on SN Ia UV spectra (Foley & Kirshner, 2013; Graham et al., 2015; Foley et al., 2018a). These two SNe have nearly identical optical light-curve widths and spectra but very different UV spectra. Intriguingly, despite being so similar in the optical, SN 2011fe and SN 2011by present significantly different peak absolute magnitudes ( mag; Foley et al., 2018a). These studies suggested that the difference in UV flux between the two SNe is likely due to their significantly different progenitor metallicities. However, these twin SNe might be rare. They must have very similar explosions but with the variations in their UV spectra primarily driven by the metallicity difference. For two random SNe, we will need to disentangle the metallicity and other explosion effects when comparing their UV spectra. In theory, this can be done by generating a SN Ia UV spectral template with which we can derive the relative metallicity of any SN Ia without needing a twin, but a large UV spectral sample which covers a wide range of parameter space will be necessary to achieve this purpose.
Recently, Pan et al. (2018, hereafter P18) constructed a large UV spectral sample with the Neil Gehrels Swift Observatory (Gehrels et al., 2004). Their study contains 120 UV spectra of 39 SNe Ia, representing the largest UV ( Å) spectroscopic sample of SNe Ia to date. However, owing to the slitless design of the Swift UV grism, the target spectrum is more easily contaminated by nearby background sources. P18 developed an improved data-reduction procedure to produce more-accurate spectra. With this improved sample, we can probe a larger parameter space of SNe Ia and construct better UV spectral templates than previous studies. In this second paper of the series, we perform detailed analysis of the Swift UV spectroscopic sample with the goal of constraining the metallicity effect on SN Ia UV spectra.
2 Data
2.1 SN sample
| SN Name | Redshift | ()a | Phase | Host name | Morph.b | log | 12 + log (O/H)d | AGN?e | |
|---|---|---|---|---|---|---|---|---|---|
| (mag) | (day) | (mag) | (M⊙) | ||||||
| SN 1992Af | 0.0062 | 1.47(05) | NGC 1380 | 0.00(02) | S0 | Y | |||
| SN 2005cf | 0.0065 | 1.05(03) | MCG-01-39-03 | 0.10(03) | S0 | N | |||
| SN 2005df | 0.0044 | 1.12(00) | NGC 1559 | 0.00(02) | Sc | ||||
| SN 2005ke | 0.0049 | 1.76(01) | NGC 1371 | 0.04(01) | Sa | N | |||
| SN 2008Q | 0.0079 | 1.41(05) | NGC 524 | 0.00(02) | S0 | ||||
| SN 2009an | 0.0092 | 1.44(00) | NGC 4332 | 0.09(03) | Sa | N | |||
| SN 2009ig | 0.0088 | 0.89(00) | NGC 1015 | 0.00(05) | Sa | N | |||
| SN 2011ao | 0.0107 | 1.00(00) | IC 2973 | 0.04(02) | Scd | N | |||
| SN 2011by | 0.0028 | 1.14(03) | NGC 3972 | 0.07(01) | Sb | N | |||
| SN 2011fe | 0.0008 | 1.11(00) | NGC 5457 | 0.03(00) | Sc | N | |||
| SN 2011iv | 0.0065 | 1.69(05) | NGC 1404 | 0.00(03) | E | N | |||
| SN 2012cgf | 0.0014 | 0.86(00) | NGC 4424 | 0.18(04) | Sa | N | |||
| SN 2012fr | 0.0055 | 0.85(05) | NGC 1365 | 0.03(04) | Sb | N | |||
| SN 2012ht | 0.0036 | 1.39(05) | NGC 3447 | 0.00(02) | Sm | N | |||
| SN 2013aa | 0.0040 | 0.80(03) | NGC 5643 | 0.00(05)g | Sc | Y | |||
| SN 2013dyf | 0.0039 | 0.92(01) | NGC 7250 | 0.21(01) | Scd | N | |||
| iPTF14bdn | 0.0156 | 0.84(05) | UGC 8503 | 0.00(05)g | Irr | N | |||
| ASASSN-14lpf | 0.0051 | 0.80(01) | NGC 4666 | 0.32(01) | Sc | N | |||
| SN 2015Ff | 0.0049 | 1.26(10) | NGC 2442 | 0.04(03) | Sbc | ||||
| SN 2016ccz | 0.0150 | 1.00(02) | MRK 685 | 0.00(05)g | Sb | N | |||
| SN 2016coj | 0.0045 | 1.33(03) | NGC 4125 | 0.03(05)g | E | Y | |||
| SN 2016eiy | 0.0087 | ESO 509-IG064 | 0.00(05)g | Sab | N | ||||
| SN 2016ekg | 0.0171 | 1.00(00) | PGC 67803 | 0.00(05)g | Sbc | N | |||
| SN 2016fff | 0.0114 | 1.49(05) | UGCA 430 | 0.00(02) | Sd | N | |||
| SN 2017cbv | 0.0040 | 1.06(00) | NGC 5643 | 0.00(02) | Sc | ||||
| SN 2018aoz | 0.0058 | 1.12(00) | NGC 3923 | 0.00(02) | E | N |
aThe -band decline 15 days after the peak brightness.
bHost-galaxy morphology from HyperLeda (Makarov et al., 2014).
cHost-galaxy stellar mass.
dHost-galaxy gas-phase metallicity based on the PP04 O3N2 calibration (Pettini & Pagel, 2004).
eIs the host galaxy contaminated by an AGN?
fUV spectra observed by HST/STIS.
g determined by fitting the host-galaxy spectrum.
A detailed description of the Swift data can be found in P18 and has been summarised below, along with any of the additions made to define our sample.
Our original sample contains 120 Swift/UVOT grism spectra of 39 SNe Ia. The redshift of that sample ranges from to 0.0214 (a median of 0.0079). The () (defined as -band decline 15 days after peak -band brightness) of that sample ranges from 0.6 mag to 1.8 mag, with three more SNe measured (, 1.11, and 1.12 mag for SN 2016ekg, SN 2017erp, and SN 2018aoz, respectively) since P18111The of SN 2016ekg and SN 2017erp are determined from Swift UVOT -band light curves. The of SN 2018aoz is determined from a Swope -band light curve..
Two-thirds of the SNe in our sample have multiple epochs of UV spectra, with a median phase of and days for the first observation of a SN and all spectra, respectively. In this work, we focus our major analysis on the near-peak-brightness spectra (i.e., within 5 days relative to the maximum light). This contains 28 SNe from our parent sample in P18.
Among the 28 SNe, we exclude SN 2014J owing to its high and uncertain reddening (e.g., Goobar et al., 2014; Foley et al., 2014; Amanullah et al., 2014). The super-Chandra SN 2012dn is also excluded owing to its anomalous behaviour in the UV (Brown et al., 2014). Five SNe (SN 2008hv, SN 2009Y, SN 2010ev, SN 2013cg, and SN 2016gsb) were further excluded owing to either poor data quality or insufficient wavelength coverage for our analysis. To increase the sample size, we include 5 SNe (SN 1992A, SN 2012cg, SN 2013dy, ASASSN-14lp, and SN 2015F) which do not have near-peak Swift/UVOT grism spectra but rather near-peak HST/STIS UV spectra. We also include all other HST UV spectra studied by Foley et al. (2016) to our analysis when appropriate. Our final near-peak sample contains 26 SNe (see Table LABEL:peak-sample).
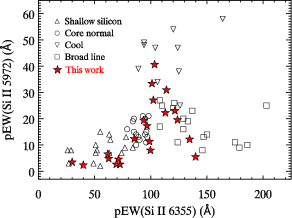
Figure 1 shows the subclasses of SNe Ia according to the pseudo-equivalent width (pEW) of and (Branch et al., 2006). Branch et al. (2006) split the SN Ia sample into four groups: A “shallow-silicon” group, which have low pEWs for both and lines (and include SN 1991T-like objects); a “core-normal” group, which have homogeneous and intermediate pEWs; a “cool” group (similar to the FAINT group in Benetti et al., 2005), with strong lines relative to ; and a “broad-line” group, which present strong absorption lines. We also display our near-peak sample (where we were able to measure the pEWs from the optical spectra) in Figure 1. It is clear that our sample covers all four subclasses and probes a larger parameter space (especially those in the broad-line group) than that of the HST UV sample of Foley et al. (2016).
2.2 UV Spectra
The spectroscopic observations were performed by the Swift UVOT (Roming et al., 2004; Kuin et al., 2015). Owing to the slitless design of the Swift UV grism observations, the target spectrum is easily contaminated by nearby background sources (e.g., host galaxy). Thus, we have developed an improved data-reduction procedure to mitigate this issue. A complete description of our methods can be found in P18. The details of the UV spectra included in our sample are presented by Foley et al. (2016).
We correct all spectra for foreground Galactic reddening using the calibrations of Schlafly & Finkbeiner (2011). We use the host-galaxy reddening determined from the SN light curves as reported by previous studies (Phillips et al., 1999; Wang et al., 2009; Folatelli et al., 2010; Foley et al., 2012a, b; Munari et al., 2013; Sahu et al., 2013; Yamanaka et al., 2014; Pan et al., 2015; Im et al., 2015; Shappee et al., 2016; Hosseinzadeh et al., 2017; Marion et al., 2016; Krisciunas et al., 2017; Stritzinger et al., 2018; Pierel et al., 2018). Here we adopt and a Cardelli, Clayton, & Mathis (1989, CCM) reddening law. Some of these SNe (4 out of 18) do not have uncertainties measured for host-galaxy reddening. Here we adopt a typical error of 0.02 mag in their host , as determined from the mean value of those having uncertainties measured from their light curves in our sample. However, we find that our result is not sensitive to the assigned uncertainty or the choice of reddening laws (see Section 3.2 for a discussion).
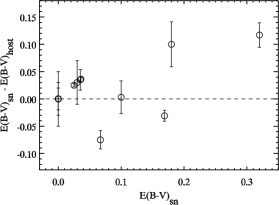
For SNe without host extinction derived from their light curves (only 6 SNe in our near-peak sample), we dereddened their spectra with the colour excess given by the host spectrum fitting. This is done with the reddening model in gandalf (see Section 2.3 for more details). By comparing the observed spectra to the unreddened spectral templates, gandalf can determine the diffusive dust throughout the whole galaxy that affects the entire host spectrum including emission lines and the stellar continuum. We compare the colour excess derived from host-galaxy spectral fitting and SN light-curve fitting for those SNe having both measurements available; the result is shown in Figure 2. We find that the values determined from the two different methods generally agree well with each other, with a dispersion of only mag. The dispersion becomes even smaller for those objects suffering lower extinction. This is likely to be the case for the 6 SNe measured with host-galaxy spectral fitting in our near-peak sample, where we find no or negligible extinctions from their host galaxies. We have incorporated this dispersion in estimating the uncertainty of host-galaxy reddening (for those determined from the host spectra).
Two SNe (SN 2016fff and SN 2018aoz) in our near-peak sample do not have host reddening derived from either method; we assume no host-galaxy extinction given their position in the outskirts of their host galaxies. The of each host galaxy in the near-peak sample is listed in Table LABEL:peak-sample.
2.3 Host-galaxy properties
To investigate the relation between SN Ia UV spectrum and host galaxy, we determine the host-galaxy parameters (e.g., morphology, stellar mass, and metallicity) with both photometric and spectroscopic data.
The morphology of the host galaxy is given by HyperLeda222http://leda.univ-lyon1.fr/ (Makarov et al., 2014), with the numerical code for the host morphology defined by de Vaucouleurs morphological type in RC2 (de Vaucouleurs et al., 1976). The host stellar mass is derived by fitting the multicolour photometry of the host galaxy with the photometric redshift code z-peg (Le Borgne & Rocca-Volmerange, 2002). The host photometry is provided from SDSS (Abolfathi et al., 2018), Pan-STARRS1 (Chambers et al., 2016), and Skymapper (Wolf et al., 2018) catalogs. z-peg fits the observed galaxy colours with galaxy spectral energy distribution (SED) templates corresponding to 9 spectral types (SB, Im, Sd, Sc, Sbc, Sb, Sa, S0, and E). We assume a Salpeter (1955) initial-mass function (IMF). A foreground dust screen varying from a colour excess of to 0.2 mag in steps of 0.02 mag is used. The photometry is corrected for foreground Milky Way reddening with and a CCM reddening law.
To measure the host metallicity, we obtained optical spectra of the host galaxies, primarily with the Kast spectrograph (Miller & Stone, 1993) on the Lick Observatory 3 m Shane telescope and the Goodman spectrograph (Clemens et al., 2004) on the SOAR telescope. We fit the emission lines and stellar continuum of the host spectrum using the Interactive Data Language (IDL) codes ppxf (Cappellari & Emsellem, 2004) and gandalf (Sarzi et al., 2006). A complete description of this process can be found in Pan et al. (2014). Briefly, ppxf fits the line-of-sight velocity distribution (LOSVD) of the stars in the galaxy in pixel space using a series of stellar templates. Before fitting the stellar continuum, the wavelengths of potential emission lines are masked to remove any possible contamination. The stellar templates are based on the miles empirical stellar library (Sánchez-Blázquez et al., 2006; Vazdekis et al., 2010). A total of 288 templates is selected with to in 6 bins and ages ranging from to Gyr in 48 bins.
After the emission-line measurements from ppxf and gandalf, we calculate the host gas-phase metallicity with pymcz (Bianco et al., 2016), a python-based code that determines the oxygen abundances and their uncertainties with a Monte Carlo method. Here the PP04 O3N2 calibration (Pettini & Pagel, 2004) is adopted. We further use BPT diagrams (Baldwin, Phillips, & Terlevich, 1981) to check for potential contamination from active galactic nuclei (AGNs) in our host galaxies. The criteria proposed by Kewley et al. (2001) are adopted to distinguish between normal and AGN host galaxies. For the host galaxies identified as AGNs, their gas-phase metallicity will be discarded from further analysis. The host-galaxy parameters measured for our near-peak sample can be found in Table LABEL:peak-sample.
| linear trend | probability of | correlation | linear trend | probability of | correlation | |||
| negative slope | Pearson | Kendall | negative slope | Pearson | Kendall | |||
| () | 7.69% | 99.4% | ||||||
| Morphology | 79.1% | 55.9% | ||||||
| Stellar Mass | 88.5% | 94.0% | ||||||
| 94.9% | 55.6% | |||||||
| (incl. AGNs) | 97.9% | 72.9% | ||||||
3 Analysis
3.1 Mean spectra
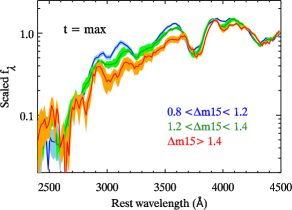
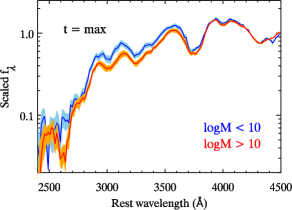
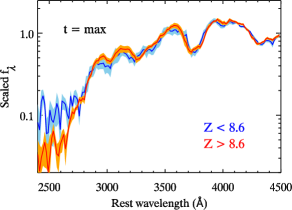
Here we produce the mean spectra to investigate potential correlation between the UV spectrum and other physical parameters, such as SN decline rate and host morphology, stellar mass, and gas-phase metallicity. The mean spectra are created using a bootstrap sampling method. The variance of the mean spectra is estimated with the range of spectra for the middle 68.27% of spectra generated from the sample. All of the spectra are normalised with the median flux for a wavelength range of 4000–4500 Å. The results are shown in Figure 3.
We first examine the dependence of UV spectrum on (). Using HST spectra, Foley et al. (2016) found a strong trend between () and the flux level at –3500 Å, with higher () (i.e., fast decliners) having lower flux level. Here we confirm their finding with the larger Swift sample. We also see some potential (but opposite) trend with () at Å, although it is less significant owing to the poorer SNR at shorter wavelengths.
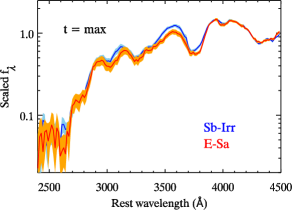
We find trend between UV spectrum and host stellar mass, with SNe Ia in more-massive galaxies tending to have lower flux levels at –3500 Å. This trend is as expected given the tight correlation between SN decline rate and host stellar mass (e.g., Pan et al., 2014). A similar (but less significant) trend is also seen for the flux level below Å. We find no clear trend between UV flux and host morphology.
The most intriguing result is probably from the relation with host metallicity. Here the split metallicity () is selected to make approximately equally sized subgroups. We find a clear trend that SNe in more metal-rich galaxies (thus likely to have a metal-rich progenitor) tend to have lower flux levels at Å than their metal-poor counterparts, while the flux levels at longer wavelengths are similar for both subgroups. This is the first time we are able to see from observations that the host metallicity shows a correlation with SN Ia UV spectra, and this metallicity effect apparently alters the flux exclusively at short wavelengths. We will discuss our findings in Section 4.1.
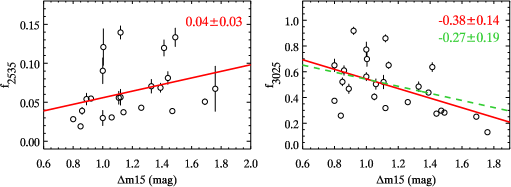
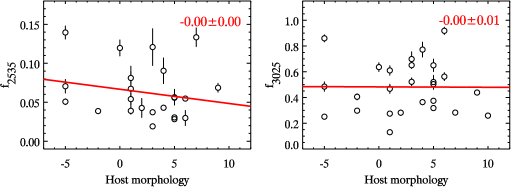
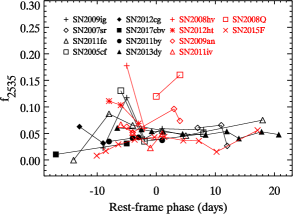
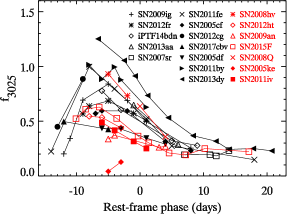
3.2 UV flux ratio
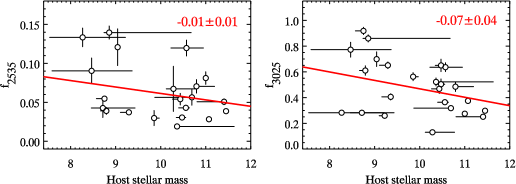
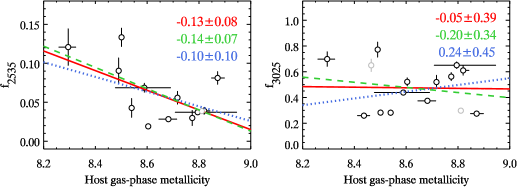
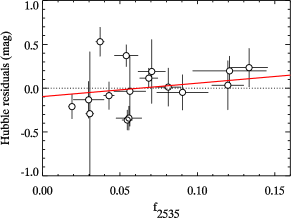
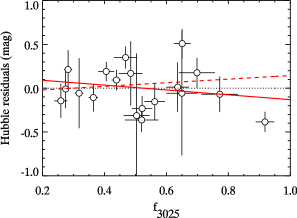
Following Foley et al. (2016), we investigate the flux ratio of several spectral regions as a function of SN and host properties. In contrast to Foley et al. (2016), here we are only able to examine two spectral regions owing to the smaller wavelength coverage of our Swift UV spectra; these correspond to the wavelength ranges of 2450–2620 and 2900–3150 Å. The flux ratio (labeled as and , respectively) is then defined as the median flux of each region divided by the median flux for a wavelength range of 4000–4500 Å. The result is shown in Figure 4.
We see a trend between and (), with larger having smaller . This is consistent with the mean spectra studied in Section 3.1. Performing the linear fitting by using the Monte Carlo Markov Chain (MCMC) method linmix (Kelly, 2007), there is a % probability that the slope is negative based on 10,000 MCMC realisations. We also derive a Pearson and Kendall correlation coefficient of and , respectively. This trend still holds if we exclude two extremely fast decliners (with mag) from the fitting. There is also some trend that SNe having lower tend to be found in more massive galaxies, but this trend is less significant than that of . No clear trend is found with other host properties, such as morphology and gas-phase metallicity.
We next examine the trend with . We see a moderate trend with and host stellar mass, with SNe showing slower decline rates or found in more massive galaxies having smaller . No significant trend is found between and host morphology. However, there is a trend with host metallicity, in the sense that SNe in more metal-rich galaxies tend to have smaller . A % probability of negative slope is determined, and a Pearson and Kendall correlation coefficient of and , respectively. This result is also consistent with what we have seen using the mean spectra. The trend also holds if we further include the SN whose host was identified as a potential AGN in Section 2.3. The probability of a negative slope increases to 98%, and the Pearson and Kendall correlation coefficients become and , respectively. Excluding the SN hosted by the most metal-poor galaxy in our near-peak sample () does not change the trend, but decreases its significance to the level. In the future, a larger sample in this low-metallicity regime () will be crucial to verify our results.
Our result is not sensitive to the uncertainty of the host-galaxy reddening or the choice of reddening laws. We performed a Monte Carlo experiment, where we assigned a random error in host from 0 to 0.05 mag for SNe without uncertainties measured in their host-galaxy reddening. A dispersion of only 0.003 (2%) is found for the slope of the to host metallicity relation. This has a negligible effect on our result. We also compared our result with different reddening laws, such as the Fitzpatrick (1999) law and two Large Magellanic Cloud reddening laws (Misselt et al., 1999). The resulting differences in are all % and do not change the trends in Figure 4.
The results of the fitting and the correlation coefficients can be found in Table 2.
3.3 Data-driven spectral template
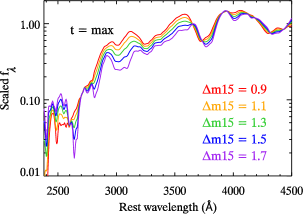
Here we generate the data-driven UV spectral template with our near-peak sample. We first create the template spectra with as the parameter. Following Eq. (1) of Foley et al. (2016), we generate a smoothed spectrum of each SN using an inverse-variance Gaussian filter (Blondin et al., 2006) and fit the smoothed flux for all spectra at each wavelength as a function of . Note that the fitting performed here is unweighted, and we do not estimate the uncertainties for our template spectra. The result is shown in the upper panel of Figure 5.
The template spectra generally follow the same trend as we found in the data (e.g., the mean spectra). There is a strong correlation between the and the flux level at –3500 Å. Similar to what was found by Foley et al. (2016), our templates also show a pivot point at Å, where the templates tend to show an opposite trend blueward of 2700 Å in contrast to that redward of 2700 Å.
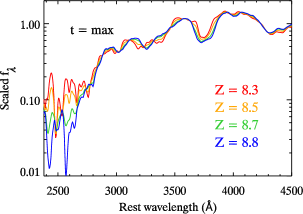
We next create the template spectra with host metallicity as the parameter. We fit the smoothed flux for all spectra in the sample at each wavelength as a function of host metallicity such that
| (1) |
where represents the spectrum of a nominal SN Ia of host gas-phase metallicity . The is the deviation from that spectrum for a hypothetical SN Ia of host . We present the parameters in Table LABEL:tab:model1. The result is shown in the lower panel of Figure 5.
There is an obvious trend that the metallicity has a substantial effect in altering the flux level of our template spectra, and is particularly significant at Å. This implies that the near-peak UV spectra (at least for Å) could be promising indicators of SN Ia progenitor metallicity.
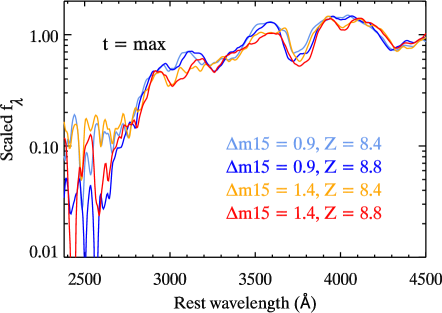
As noted above, it is apparent that and metallicity are both affecting the UV spectra of SNe Ia (although likely in different ways). To disentangle this degeneracy, we try to construct UV templates based on both and metallicity parameters to explore the two-dimensional parameter space. The formula we use for the fitting is
| (2) |
where represents the spectrum of a nominal mag SN Ia with the host galaxy having a gas-phase metallicity . Also, is the deviation from that spectrum for a hypothetical SN Ia of mag and host , while is the deviation from the same spectrum for a hypothetical SN Ia of mag and host . We present the parameters in Table LABEL:tab:model2. The result is shown in Figure 6. Our two-parameter templates clearly indicate that and metallicity have distinct effects on the UV spectrum.
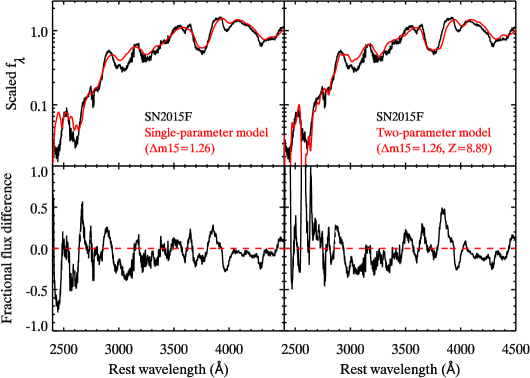
Figure 7 shows the comparison between the UV spectrum of SN 2015F and our templates. The templates parameterised with only and both and host metallicity are compared. Since we do not have the host metallicity measured for SN 2015F, we fix to that of SN 2015F (which is already known from the light-curve fitting) and only let the metallicity vary. Note that the comparison made here is simply by-eye inspection; we did not fit our templates to the data.
It is clear that with the UV template having only a single parameterisation in light-curve shape, it is difficult to interpret the whole UV spectrum (especially for the behaviour at short wavelengths). The template which takes the metallicity into consideration is apparently more consistent with the data. By comparing the UV spectrum with our templates, we find that SN 2015F is likely to reside in a metal-rich host environment. This is probably not surprising given its relatively massive host galaxy (). Thus, it implies that SN 2015F could have a high-metallicity progenitor.
However, one should be cautious in using these templates. Firstly, we have only a relatively small number of SNe with measured host metallicities in certain regions of parameter space (especially those SNe at both ends of the distribution of P18). A discrepancy between the host metallicity measured in this work and SN progenitor metallicity is also expected, but the relative trend existing in both mean spectra and spectral templates should be real. Secondly, the real mechanisms forming the UV spectra of SNe Ia should be far more complicated than a simple description of a two-parameter template (e.g., Mazzali, 2000). Other parameters (from the progenitor and/or explosion) could also play a role, but the strong dependence of SN Ia UV spectra on light-curve shape and metallicity implies that they are likely important factors.
| Wavelength | ||
|---|---|---|
| (Å) | ||
| 2350 | 0.0757 | |
| 2355 | 0.0887 | |
| 2360 | 0.0926 | |
| 2365 | 0.0938 | |
| 2370 | 0.0934 | |
| 2375 | 0.0885 | |
| 2380 | 0.0802 | |
| 2385 | 0.0737 | |
| 2390 | 0.0716 | |
| 2395 | 0.0700 |
| Wavelength | |||
|---|---|---|---|
| (Å) | |||
| 2350 | 0.1431 | 0.2148 | |
| 2355 | 0.1587 | 0.2460 | |
| 2360 | 0.1625 | 0.2628 | |
| 2365 | 0.1628 | 0.2836 | |
| 2370 | 0.1621 | 0.3000 | |
| 2375 | 0.1553 | 0.2941 | |
| 2380 | 0.1443 | 0.2681 | |
| 2385 | 0.1342 | 0.2264 | |
| 2390 | 0.1261 | 0.1714 | |
| 2395 | 0.1171 | 0.1160 |
3.4 Spectral evolution
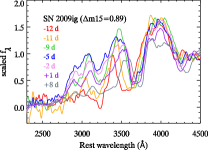
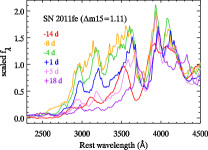
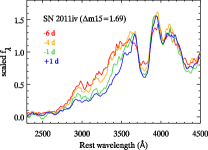
Many SNe in our sample have a well-observed spectral sequence, making them ideal targets for studying the temporal evolution of UV spectral features.
In Figure 8, we present examples of UV spectral sequences for SNe with several different values of . The epochs of our spectral observations span –2 weeks relative to the time of peak brightness. There is clear evolution for the UV feature at –3500 Å. The flux level rises dramatically (relative to the flux at Å) with time after the SN explosion and peaks week before optical maximum light. It then decreases slowly (relative to the rising) with time after peak brightness. This trend is similar for both low- and high- SNe, although the high- SNe generally exhibit much weaker (and more featureless) UV spectra than do low- SNe at similar phases.
We examine the temporal evolution of the flux ratios and in Figure 9. Similar to what we have seen in Figure 8, there is strong evolution of with time. The feature also peaks week before optical maximum light, indicating that early-time observations are more critical for the UV than for the optical. However, we do not see clear evolution for .
By examining each individual SN, we find that SN 2008hv and SN 2008Q are apparent outliers to these trends (in terms of their ). They are noticeably bright in the UV despite their relatively fast decline rates ( and 1.40 mag, respectively). We note that both SNe were classified as “NUV-blue” SNe Ia by Milne et al. (2013). This represents a relatively minor group of SNe Ia (at least at low redshifts) which shows distinctly high NUV to optical ratios. SN 2011fe and SN 2011by were also classified as NUV-blue SNe Ia. It is clear that their peak flux ratios are higher than the majority of our sample. SN 2013dy and SN 2012cg are also similar to those NUV-blue events as described by Milne et al. (2013). Intriguingly, we find that these NUV-blue SNe Ia are not necessarily blue at shorter wavelength (e.g., ). This implies that the UV spectrum at those wavelengths might be influenced by different physics (e.g., progenitor metallicity).
4 Discussion
4.1 Comparison with previous studies
Lentz et al. (2000) modeled the effects of progenitor metallicity on SNe Ia by modifying the metallicity of the unburned C+O layer in the W7 model of Nomoto et al. (1984). They produced synthetic spectra of a variety of progenitor metallicities with wavelengths extended to the UV. They found that the UV continuum of the synthetic spectra is strongly affected by the metallicity in the unburned layer, with higher metallicities having lower flux levels. This trend is likely caused by the stronger UV line blanketing with increasing IGEs in the SN outer layers. Higher metallicity also results in a shallower line-forming region and causes the UV features to move blueward in the spectra.
Using a different spectral synthesis code, Sauer et al. (2008) also showed that the variation of IGE abundance does not significantly affect the optical, but is significant in the UV part of the spectrum. However, they found that the UV flux level may either increase or decrease with increasing abundance of heavy elements, depending on the models they used. Walker et al. (2012) adopted the radiative transfer codes based on Sauer et al. (2008) but different explosion models to investigate the effect of metal content in the SN outer layers on the UV spectrum. They concluded that the flux at –3500 Å relative to that near 4000 Å is a good tracer of metallicity.
In this work, we use the host-galaxy metallicity as a proxy for progenitor metallicity to examine the correlation with SN Ia UV spectra. Our result is generally consistent with the predictions of Lentz et al. (2000). Their model spectra at 15 days after explosion (i.e., similar to the phase studied in this work) also reveal that the flux levels start to show increasingly large differences at Å between progenitor metallicities. This is consistent with both the mean spectra and data-driven spectral templates in this work. We do not see a significant trend between flux level at –3500 Å and metallicity, which contradicts the model predictions of Walker et al. (2012).
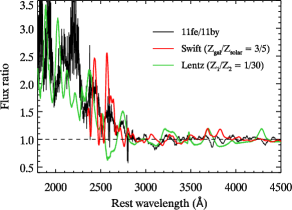
Foley & Kirshner (2013) studied the “twin” SN 2011by and SN 2011fe and found some evidence of a metallicity effect on the SN Ia UV spectrum. These two SNe have nearly identical optical spectra and light curves but very different UV spectra. They compared the observed difference to those of model spectra in Lentz et al. (2000) and concluded that the difference in their progenitor metallicities is likely the main source driving the discrepancy in the UV (without affecting the optical). Following their methods, we produce the near-peak flux-ratio spectrum of SN 2011fe to SN 2011by and present it in Figure 10. By using flux ratios, we can avoid the differences of spectral features between models and data, and focus on the differences between models (e.g., the metallicity). We then compare the flux-ratio spectrum of the twin SNe to that of our data-driven templates as parameterised by the host metallicity. We find that SN 2011by is likely to have higher progenitor metallicity than that of SN 2011fe. For example, the flux ratio produced by 0.6 and 1.0 (using the solar value of 8.69; Allende Prieto et al., 2001) template spectra could match the data quite well (the comparison made here is simply a by-eye inspection). The model flux-ratio spectrum of metallicity factor from Lentz et al. (2000) is also overplotted for comparison.
Our results support the previous findings that SN 2011by and SN 2011fe could have solar (or above solar) and subsolar progenitor metallicities, respectively. Nonetheless, the “direct” interpretation or measurement of the progenitor metallicity using our templates could be problematic owing to a potential discrepancy between the host-galaxy and SN-progenitor metallicities. The metallicity measured close to the position of the progenitor system (e.g., determined from the local environment) should be considered to build more precise templates.
4.2 Implications for cosmology
Theory predicts that the amount of 56Ni produced during the SN Ia explosion shows a strong dependence on the progenitor metallicity (e.g., Timmes et al., 2003). More metal-rich progenitors will likely generate more stable and neutron-rich 58Ni instead of the radioactive 56Ni, and therefore result in fainter SNe Ia. Host-galaxy observations also suggested that SNe found in more metal-rich environments tend to be fainter than those in metal-poor environments (e.g., D’Andrea et al., 2011; Childress et al., 2013; Pan et al., 2014). This dependence is significant even after the empirical corrections for SN light-curve width and colour. Given the underlying metallicity evolution with redshift (e.g., dex from to 1; Savaglio et al., 2005), this could introduce substantial bias in the current cosmological analyses.
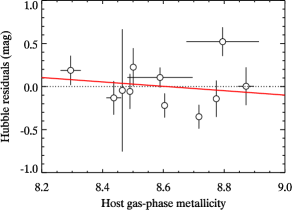
Theoretically, the UV spectrum of a SN Ia should be a more direct probe of progenitor metallicity than the host galaxy. Accordingly, we inspect the correlation between the UV flux ratio and SN luminosity as parameterised by Hubble residuals to see if it shows a stronger trend than that with host galaxies. The Hubble residuals are defined as the difference between the observed rest-frame -band SN apparent magnitude corrected for light-curve width and colour, and the peak SN magnitude expected in our assumed cosmological model. We use salt2 (Guy et al., 2007) to fit the SN light curves, and we adopt similar procedures and cuts on light-curve width and colour as those described by Foley et al. (2018b). However, we did not apply the correction for the host mass step as we are actually searching for potential variables which could have the same effect as host stellar mass (e.g., metallicity). For the 9 SNe having precise distances measured by Riess et al. (2016), we use their Cepheid-based distance modulus instead of that derived from the cosmological models. For those without Cepheid distances, the distance modulus is determined by the python script cosmos and assumes km s-1 Mpc-1 and a flat universe with .
The result is shown in Figure 11. Previous studies revealed that SNe in more metal-rich environments tend to have more negative Hubble residuals than their metal-poor counterparts (e.g., Pan et al., 2014). If the host metallicity traces the progenitor metallicity well, we should expect SNe with lower flux ratio (caused by higher progenitor metallicity) to have more negative Hubble residuals. However, we do not see a significant trend with ; if anything, SNe with lower tend to have more negative Hubble residuals. There is a % probability that the slope is positive based on 10,000 MCMC realisations. In comparison, we see an opposite trend with . We find this trend is likely caused by an outlier in the sample (see the middle panel of Figure 11), and which otherwise is not present. We also show the Hubble residuals as a function of host gas-phase metallicities (the bottom panel of Figure 11). However, we are unable to reproduce the significant trend found by previous host studies, although it is consistent with the absence of a trend we found with .
It is likely that our results suffer from large uncertainties, given that our sample is relatively small and nearby. At , precise distance measurement becomes extremely difficult owing to peculiar velocities, and thus those Hubble residuals only very weakly depend on the cosmological model. It would be interesting to re-examine these relations by extending the current analysis to a higher- SN sample in the future.
4.3 Early-time UV spectra
In this work, we have shown that the near-peak UV spectra are promising indicators of progenitor metallicity. However, theoretical models also predict that the progenitor metallicity should have a more significant effect at earlier epochs (Lentz et al., 2000): the SN Ia UV spectra are expected to show larger differences with progenitor metallicities, and diverge at longer wavelengths. This implies that the early-time UV spectra could be better metallicity indicators.
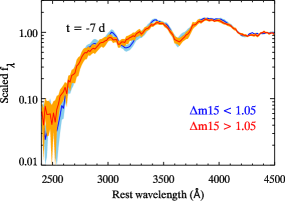
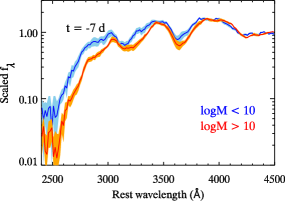
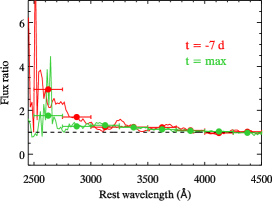
To test this, we build an early-time sample with the UV spectra observed week before peak brightness. Our early-time sample contains 14 SNe, with phases ranging from to days (a mean phase of days). Following the procedure described in Section 3.1, we produce the mean UV spectra based on and host-galaxy stellar mass. Here the stellar mass is used instead of metallicity as it not only greatly increases the number of our early-time sample (13 out of 14 SNe have their host mass measured, but only half of them have host metallicity available), but also is a good proxy for metallicity (e.g., Tremonti et al., 2004). We then compare the flux-ratio spectra between the early-time and near-peak samples. The results are shown in Figure 12.
We find no significant difference between the slower decline and faster decline samples (here defined as and mag, respectively), indicating that the decline rate is likely to have a negligible effect on the early-time UV spectra. However, there is an obvious trend that the mean spectra between low-mass and high-mass host galaxies present larger differences at days than that at peak brightness (see also Figure 3). The spectra also tend to diverge at longer wavelengths. Using the stellar mass as the proxy for metallicity, this implies that the early-time UV spectra are better indicators of progenitor metallicity. Our finding is consistent with the theoretical predictions, although with large uncertainties owing to the small number of SNe with early-time observations available.
The fast turnaround of Swift makes it an ideal instrument for increasing the number of SNe with early-time UV spectra in the future. With earlier observations, we should be able to detect the metallicity differences more easily. This especially has the advantage of mitigating the problem that the SNR of Swift UV spectra generally deteriorates dramatically at shorter wavelengths, barely probing the region where metallicity just starts to take effect for the near-peak spectra (i.e., Å).
5 Conclusions
Theoretical studies predicted that the SN Ia UV spectrum is sensitive to the progenitor metallicity. However, it is extremely difficult to constrain such metallicity effects from observations owing to either limited wavelength coverage or sample size. In this work, we present the analysis of the largest UV ( Å) spectroscopic sample of SNe Ia observed by Swift. We constructed mean spectra and spectral templates to investigate the relation between UV spectra and both SN and host-galaxy properties.
-
We confirm previous findings that the UV flux shows a strong dependence on SN light-curve shape, with slower-decline SNe having higher flux levels at Å. There is also some potential (but opposite) trend with SN light-curve shape at Å.
-
Using host galaxy as a proxy for the SN progenitor system, we find a trend between the UV spectrum and host metallicity. SNe found in more metal-rich galaxies (thus likely to have more metal-rich progenitors) tend to exhibit a lower UV flux level at Å. We find that this metallicity effect is nearly negligible at longer wavelengths. Our results are consistent with the theoretical predictions and provide strong observational evidence for a correlation between SN Ia UV spectrum and progenitor metallicity.
-
Following Foley et al. (2016), we generate UV spectral templates that depend on light-curve shape and host metallicity. While the UV templates with only a single parameterisation using light-curve shape agree quite well with the observations, they fail to describe the behaviour of the spectrum at shorter wavelengths (e.g., Å). The two-parameter templates which take both light-curve shape and metallicity into consideration are more consistent with the observations. Although other parameters could also play a role, the strong dependence of SN Ia UV spectra on light-curve shape and metallicity implies that they are important factors.
-
We investigate the relation between UV spectra and SN luminosity as parameterised by Hubble residuals. We do not see a significant trend between UV spectra and Hubble residuals; if anything, the flux level at Å (which is sensitive to the progenitor metallicity) tends to increase with Hubble residuals. However, the determination of Hubble residuals for our sample suffers large uncertainties from SN distances, as most of our SNe are extremely nearby (). That means they only weakly depend on the cosmological model. Future analyses of higher- SN samples will be necessary to examine the metallicity bias on Hubble residuals.
-
We find that early-time UV spectra are likely better metallicity indicators than near-peak UV spectra. We generate the mean spectra for SNe in low-mass and high-mass galaxies at earlier epochs ( days) and find that their difference tends to be larger than that of the near-peak sample. This implies that the early-time UV observations could be better probes of progenitor metallicity.
UV spectra are critical to understanding the explosion mechanism and progenitor systems of SNe Ia. In particular, they are expected to be more direct probes of SN progenitor metallicity, which is believed to be able to significantly alter the SN luminosity and bias the distance measurement. Future studies with rest-frame UV spectra for higher- SNe will be critical for investigating the metallicity evolution and potential bias on cosmological analyses.
6 Acknowledgements
Swift spectroscopic observations were performed under programs GI–04047, GI–5080130, GI–6090689, GI–8110089, GI–1013136, and GI–1215205; we are very grateful to N. Gehrels, S. B. Cenko, and the Swift team for executing the observations quickly. Based in part on observations made with the NASA/ESA Hubble Space Telescope, obtained at the Space Telescope Science Institute (STScI), which is operated by the Association of Universities for Research in Astronomy, Inc., under National Aeronautics and Space Administration (NASA) contract NAS 5–26555. These observations are associated with Programmes GO–12298, GO–12592, GO–13286, GO–13646, and DD–14925. This manuscript is based upon work supported by NASA under Contract No. NNG16PJ34C issued through the WFIRST Science Investigation Teams Programme.
Y.-C.P. is supported by the East Asian Core Observatories Association (EACOA) Fellowship. N.P.M.K. has been supported by the UK Space Agency. The UCSC group is supported in part by NASA grant 14-WPS14-0048, NSF grant AST-1518052, the Gordon & Betty Moore Foundation, and by fellowships from the Alfred P. Sloan Foundation and the David and Lucile Packard Foundation to R.J.F. Additional financial assistance to A.V.F. was provided by the TABASGO Foundation, the Christopher R. Redlich Fund, and the Miller Institute for Basic Research in Science (U.C. Berkeley).
The national facility capability for SkyMapper has been funded through ARC LIEF grant LE130100104 from the Australian Research Council, awarded to the University of Sydney, the Australian National University, Swinburne University of Technology, the University of Queensland, the University of Western Australia, the University of Melbourne, Curtin University of Technology, Monash University, and the Australian Astronomical Observatory. SkyMapper is owned and operated by The Australian National University’s Research School of Astronomy and Astrophysics. The survey data were processed and provided by the SkyMapper Team at ANU. The SkyMapper node of the All-Sky Virtual Observatory (ASVO) is hosted at the National Computational Infrastructure (NCI). Development and support the SkyMapper node of the ASVO has been funded in part by Astronomy Australia Limited (AAL) and the Australian Government through the Commonwealth’s Education Investment Fund (EIF) and National Collaborative Research Infrastructure Strategy (NCRIS), particularly the National eResearch Collaboration Tools and Resources (NeCTAR) and the Australian National Data Service Projects (ANDS).
References
- Abolfathi et al. (2018) Abolfathi B. et al., 2018, ApJS, 235, 42
- Allende Prieto et al. (2001) Allende Prieto C., Lambert D. L., Asplund M., 2001, ApJ, 556, L63
- Amanullah et al. (2014) Amanullah R. et al., 2014, ApJ, 788, L21
- Baldwin et al. (1981) Baldwin J. A., Phillips M. M., Terlevich R., 1981, PASP, 93, 5
- Benetti et al. (2005) Benetti S. et al., 2005, ApJ, 623, 1011
- Betoule et al. (2014) Betoule M. et al., 2014, A&A, 568, A22
- Bianco et al. (2016) Bianco F. B., Modjaz M., Oh S. M., Fierroz D., Liu Y. Q., Kewley L., Graur O., 2016, Astronomy and Computing, 16, 54
- Blondin et al. (2006) Blondin S. et al., 2006, AJ, 131, 1648
- Branch et al. (2009) Branch D., Dang L. C., Baron E., 2009, PASP, 121, 238
- Branch et al. (2006) Branch D. et al., 2006, PASP, 118, 560
- Brown et al. (2014) Brown P. J. et al., 2014, ApJ, 787, 29
- Cappellari & Emsellem (2004) Cappellari M., Emsellem E., 2004, PASP, 116, 138
- Cardelli et al. (1989) Cardelli J. A., Clayton G. C., Mathis J. S., 1989, ApJ, 345, 245
- Chambers et al. (2016) Chambers K. C. et al., 2016, arXiv e-prints
- Childress et al. (2013) Childress M. et al., 2013, ApJ, 770, 108
- Clemens et al. (2004) Clemens J. C., Crain J. A., Anderson R., 2004, in Proceedings of the SPIE, Vol. 5492, Ground-based Instrumentation for Astronomy, Moorwood A. F. M., Iye M., eds., pp. 331–340
- Conley et al. (2011) Conley A. et al., 2011, ApJS, 192, 1
- D’Andrea et al. (2011) D’Andrea C. B. et al., 2011, ApJ, 743, 172
- de Vaucouleurs et al. (1976) de Vaucouleurs G., de Vaucouleurs A., Corwin J. R., 1976, in Second reference catalogue of bright galaxies, Vol. 1976, p. Austin: University of Texas Press., Vol. 1976
- Ellis et al. (2008) Ellis R. S. et al., 2008, ApJ, 674, 51
- Filippenko (1997) Filippenko A. V., 1997, ARA&A, 35, 309
- Fitzpatrick (1999) Fitzpatrick E. L., 1999, PASP, 111, 63
- Folatelli et al. (2010) Folatelli G. et al., 2010, AJ, 139, 120
- Foley et al. (2012a) Foley R. J. et al., 2012a, ApJ, 744, 38
- Foley et al. (2008) Foley R. J., Filippenko A. V., Jha S. W., 2008, ApJ, 686, 117
- Foley et al. (2014) Foley R. J. et al., 2014, MNRAS, 443, 2887
- Foley et al. (2018a) Foley R. J., Hoffmann S. L., Macri L. M., Riess A. G., Brown P. J., Filippenko A. V., Graham M. L., Milne P. A., 2018a, arXiv e-prints
- Foley & Kirshner (2013) Foley R. J., Kirshner R. P., 2013, ApJ, 769, L1
- Foley et al. (2012b) Foley R. J. et al., 2012b, ApJ, 753, L5
- Foley et al. (2016) Foley R. J. et al., 2016, MNRAS, 461, 1308
- Foley et al. (2018b) Foley R. J. et al., 2018b, MNRAS, 475, 193
- Gehrels et al. (2004) Gehrels N. et al., 2004, ApJ, 611, 1005
- Goobar et al. (2014) Goobar A. et al., 2014, ApJ, 784, L12
- Graham et al. (2015) Graham M. L. et al., 2015, MNRAS, 446, 2073
- Guy et al. (2007) Guy J. et al., 2007, A&A, 466, 11
- Höflich et al. (1998) Höflich P., Wheeler J. C., Thielemann F. K., 1998, ApJ, 495, 617
- Hosseinzadeh et al. (2017) Hosseinzadeh G. et al., 2017, ApJ, 845, L11
- Im et al. (2015) Im M., Choi C., Yoon S.-C., Kim J.-W., Ehgamberdiev S. A., Monard L. A. G., Sung H.-I., 2015, ApJS, 221, 22
- Kelly (2007) Kelly B. C., 2007, ApJ, 665, 1489
- Kelly et al. (2010) Kelly P. L., Hicken M., Burke D. L., Mandel K. S., Kirshner R. P., 2010, ApJ, 715, 743
- Kessler et al. (2009) Kessler R. et al., 2009, ApJS, 185, 32
- Kewley et al. (2001) Kewley L. J., Dopita M. A., Sutherland R. S., Heisler C. A., Trevena J., 2001, ApJ, 556, 121
- Kirshner et al. (1993) Kirshner R. P. et al., 1993, ApJ, 415, 589
- Krisciunas et al. (2017) Krisciunas K., Suntzeff N. B., Espinoza J., Gonzalez D., Miranda A., Sanhueza P., 2017, Research Notes of the American Astronomical Society, 1, 36
- Kuin et al. (2015) Kuin N. P. M. et al., 2015, MNRAS, 449, 2514
- Lampeitl et al. (2010) Lampeitl H. et al., 2010, ApJ, 722, 566
- Le Borgne & Rocca-Volmerange (2002) Le Borgne D., Rocca-Volmerange B., 2002, A&A, 386, 446
- Lentz et al. (2000) Lentz E. J., Baron E., Branch D., Hauschildt P. H., Nugent P. E., 2000, ApJ, 530, 966
- Maguire et al. (2012) Maguire K. et al., 2012, MNRAS, 426, 2359
- Makarov et al. (2014) Makarov D., Prugniel P., Terekhova N., Courtois H., Vauglin I., 2014, A&A, 570, A13
- Marion et al. (2016) Marion G. H. et al., 2016, ApJ, 820, 92
- Mazzali (2000) Mazzali P. A., 2000, A&A, 363, 705
- Mazzali et al. (2014) Mazzali P. A. et al., 2014, MNRAS, 439, 1959
- Miller & Stone (1993) Miller J. S., Stone R. P. S., 1993, Lick Obs. Tech. Rep., No. 66
- Milne et al. (2013) Milne P. A., Brown P. J., Roming P. W. A., Bufano F., Gehrels N., 2013, ApJ, 779, 23
- Misselt et al. (1999) Misselt K. A., Clayton G. C., Gordon K. D., 1999, ApJ, 515, 128
- Munari et al. (2013) Munari U., Henden A., Belligoli R., Castellani F., Cherini G., Righetti G. L., Vagnozzi A., 2013, NA, 20, 30
- Nomoto et al. (1984) Nomoto K., Thielemann F.-K., Yokoi K., 1984, ApJ, 286, 644
- Pan et al. (2018) Pan Y.-C., Foley R. J., Filippenko A. V., Kuin N. P. M., 2018, MNRAS, 479, 517
- Pan et al. (2015) Pan Y.-C. et al., 2015, MNRAS, 452, 4307
- Pan et al. (2014) Pan Y.-C. et al., 2014, MNRAS, 438, 1391
- Perlmutter et al. (1999) Perlmutter S. et al., 1999, ApJ, 517, 565
- Pettini & Pagel (2004) Pettini M., Pagel B. E. J., 2004, MNRAS, 348, L59
- Phillips et al. (1999) Phillips M. M., Lira P., Suntzeff N. B., Schommer R. A., Hamuy M., Maza J., 1999, AJ, 118, 1766
- Pierel et al. (2018) Pierel J. D. R. et al., 2018, PASP, 130, 114504
- Podsiadlowski et al. (2006) Podsiadlowski P., Mazzali P. A., Lesaffre P., Wolf C., Forster F., 2006, arXiv Astrophysics e-prints
- Rest et al. (2014) Rest A. et al., 2014, ApJ, 795, 44
- Riess et al. (1998) Riess A. G. et al., 1998, AJ, 116, 1009
- Riess et al. (2016) Riess A. G. et al., 2016, ApJ, 826, 56
- Riess et al. (2018) Riess A. G. et al., 2018, ApJ, 853, 126
- Riess et al. (2007) Riess A. G. et al., 2007, ApJ, 659, 98
- Roming et al. (2004) Roming P. W. A. et al., 2004, in Proceedings of the SPIE, Vol. 5165, X-Ray and Gamma-Ray Instrumentation for Astronomy XIII, Flanagan K. A., Siegmund O. H. W., eds., pp. 262–276
- Sahu et al. (2013) Sahu D. K., Anupama G. C., Anto P., 2013, MNRAS, 430, 869
- Salpeter (1955) Salpeter E. E., 1955, ApJ, 121, 161
- Sánchez-Blázquez et al. (2006) Sánchez-Blázquez P. et al., 2006, MNRAS, 371, 703
- Sarzi et al. (2006) Sarzi M. et al., 2006, MNRAS, 366, 1151
- Sauer et al. (2008) Sauer D. N. et al., 2008, MNRAS, 391, 1605
- Savaglio et al. (2005) Savaglio S. et al., 2005, ApJ, 635, 260
- Schlafly & Finkbeiner (2011) Schlafly E. F., Finkbeiner D. P., 2011, ApJ, 737, 103
- Scolnic et al. (2018) Scolnic D. M. et al., 2018, ApJ, 859, 101
- Shappee et al. (2016) Shappee B. J. et al., 2016, ApJ, 826, 144
- Stritzinger et al. (2018) Stritzinger M. D. et al., 2018, ApJ, 864, L35
- Sullivan et al. (2010) Sullivan M. et al., 2010, MNRAS, 406, 782
- Suzuki et al. (2012) Suzuki N., et al., 2012, ApJ, 746, 85
- Timmes et al. (2003) Timmes F. X., Brown E. F., Truran J. W., 2003, ApJ, 590, L83
- Tremonti et al. (2004) Tremonti C. A. et al., 2004, ApJ, 613, 898
- Vazdekis et al. (2010) Vazdekis A., Sánchez-Blázquez P., Falcón-Barroso J., Cenarro A. J., Beasley M. A., Cardiel N., Gorgas J., Peletier R. F., 2010, MNRAS, 404, 1639
- Walker et al. (2012) Walker E. S., Hachinger S., Mazzali P. A., Ellis R. S., Sullivan M., Gal Yam A., Howell D. A., 2012, MNRAS, 427, 103
- Wang et al. (2009) Wang X. et al., 2009, ApJ, 697, 380
- Wolf et al. (2018) Wolf C. et al., 2018, PASA, 35, e010
- Yamanaka et al. (2014) Yamanaka M. et al., 2014, ApJ, 782, L35