Simplex2Vec embeddings for community detection in simplicial complexes
Abstract
Topological representations are rapidly becoming a popular way to capture and encode higher-order interactions in complex systems. They have found applications in disciplines as different as cancer genomics, brain function, and computational social science, in representing both descriptive features of data and inference models. While intense research has focused on the connectivity and homological features of topological representations, surprisingly scarce attention has been given to the investigation of the community structures of simplicial complexes. To this end, we adopt recent advances in symbolic embeddings to compute and visualize the community structures of simplicial complexes. We first investigate the stability properties of embedding obtained for synthetic simplicial complexes to the presence of higher order interactions. We then focus on complexes arising from social and brain functional data and show how higher order interactions can be leveraged to improve clustering detection and assess the effect of higher order interaction on individual nodes. We conclude delineating limitations and directions for extension of this work.
I Introduction
In the last decades, network science has successfully characterized real-world complex systems Barabasi_Albert_2002 ; Newman_book2010 ; Latora_Nicosia_Russo_book2017 by studying each system’s corresponding network representation. Nodes represent the elements of the system, and links represent pairwise interactions Latora_Review_2006 ; barrat2004architecture . However, many real-world networks including social systems bajardi2015unveiling ; carstens2013persistent ; bonato2010geometric ; schebesch2017topological ; sekara2016fundamental , collaboration networks among scientists carstens2013persistent ; patania_shape_2017 , joint appearances among actors ramasco2004self , neural activity of the human brain giusti2015clique ; petri_homological_2014 ; lord2016insights ; bassett2017network ; bendich2016persistent ; yoo2016topological , etc., often exhibit interactions that cannot be captured when only considering pairwise relationships. As an example, consider a congress who meets as a single body when in session. Representing this relationship as a set of pairwise meetings would miss the fact that more than two congresspersons must meet together to make a legal quorum. Moreover, several real-world networks display "small-world" topologies, where high concentrations of edges exist among special groups of vertices, and where low concentrations of edges exist between these groups.
Owing to the importance of understanding correlated processes in terms of their function(s) as a network, much attentions has been devoted to the development of new and scalable methods to extract communities and their boundaries based on the structural roles of interconnected nodes fortunato2010community ; lancichinetti2011finding ; newman2006modularity ; newman2013spectral ; javed2018community ; patania_topological_2017 . Simplicial complexes were introduced as a way to account for higher-order interactions beyond more traditional pairwise descriptors ghrist2008barcodes ; carlsson2005persistence ; chazal2017introduction ; lambiotte2019networks . Indeed, it has been shown that simplicial representations provide new and satisfactory explanations for many complex dynamics in neuroscience lord2016insights ; bassett2017network ; bendich2016persistent ; yoo2016topological , social systems iacopini2019simplicial ; skardal and dynamical systems bianconi2018topological ; petri_icial_2018 ; maletic2016persistent . Surprisingly, with the exception of few notable examples courtney2016generalized ; bianconi2015complex ; bianconi2017emergent , scarce attention has been devoted to define community structure of simplicial complexes.
To this end, the present work implements recent advances in symbolic embeddings, i.e. node2vec and word2vec grover2016node2vec ; goldberg2014word2vec , combined with biased and unbiased random walks to map, detect and visualize the community structure of simplicial complexes.
II Methods
II.1 Simplices and simplicial complexes
The simplest definition of a -dimensional simplex is combinatorial: a simplex is a set of vertices . It is easy to understand how simplices can describe both pairwise and group interactions. An edge is a collection of two vertice , while larger sets represent groups, e.g. a 2-simplex is a “filled” triangle , while the set of all its edges is . Notice that a set of simplices constitutes simplicial complexes in a similar manner to how a set of edges defines a network. More formally, a simplicial complex on a given set of vertices , with , is a collection of simplices, with two conditions: (i) if then all the possible sub-simplices constructed from any subsets of are also contained in and (ii) the intersection of any two is empty or a face of both and .
There are several ways to build a simplicial complex. A commonly used one is via clique complexes: we start from a network and promote each clique to simplex defined by the nodes of . Then we focus our attention on maximal cliques, since they are automatically promoted to facets, i.e. simplices that are not a face of another simplex of the complex, and a list of facets uniquely defines a simplicial complex. Moreover, each facet contains all its subsimplices petri_homological_2014 . In a clique complex however it is impossible to have an empty triangle (, without ), since its structure is defined by its 1-dimensional skeleton, the collection of its edges (1-simplices). For this reason, in section II.5 we consider alternative ways to build simplices.
II.2 Hasse diagrams and persistent homology
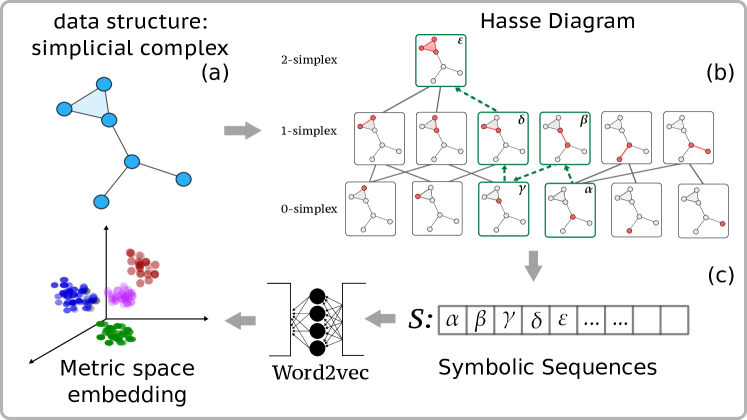
Computational topology and Topological Data Analysis (TDA) are concerned with how to represent and quantify the structure of simplicial complexes edelsbrunner2010computational . One of the most common, indeed equivalent, mathematical representations of simplicial complexes is based on the Hasse diagram. This is a directed acyclic graph (DAG), where each vertex represents a -simplex of the simplicial complex and there exist an edge connecting two vertices and , if and , i.e. they correspond to two simplices of consecutive dimensions (see Figure 2b for a graphical representation). The Hasse diagram effectively is the backbone of inclusions between simplices of different dimensions.
In addition, in many contexts we are required to make quantitative comparisons within and across datasets. Persistent homology ghrist2008barcodes ; petri2013topological was developed for this purpose of quantifying the shape of data by providing a multiscale description of its topological structure. This is achieved by encoding data as a sequence of simplicial complexes, called a filtration. Features of the complexes (connected components, one-dimensional cycles, three-dimensional cavities) persist along this sequence of simplicial complexes for different intervals, and their persistence defines how relevant they are for the shape of the dataset. In such a way, it is possible to identify unique meso-scale structures otherwise invisible to classic analytical tools. This intervals can also be mapped in a persistence diagram carlsson_topology_2009 and distances between persistence diagrams can be used. Notably, the persistence diagrams come with various notions of metric: in this work, we will adopt one of the most flexible ones, the (sliced) Wasserstein distance mileyko2011probability , which is often used to compare diagrams.
II.3 Random Walks and symbolic embedding
Random walks (RWs) are sequences of locations visited by a walker on a substrate. This substrate can be anything from a metric space to a discrete structure, like a network. Because of this flexibility, RWs are often used as exploration processes for different properties of the substrate. In particular, RWs can be unbiased or biased. In the former case, walkers have no preference for the future direction and choose uniformly at random from the possible next locations for a jump, e.g. among the neighbours of the node the walker is sitting on. Biased and correlated models were developed to take into account that, in certain situations, some directions are more probable than others and the situations where the sequential step orientations are correlated Patlak1953 .
In order to generate the symbolic sequences that will be processed by word2vec in the embedding process, we employed both the unbiased and biased approaches to random walk on the Hasse Diagram (for our purpose, we discard the direction of the inclusions in the DAC when performing a jump). In the unbiased model, the walker starts from any node of the graph and has uniform probability to move to any of the neighbours. This is the RW scheme used for the synthetic simplicial complexes analysis in section III.1.
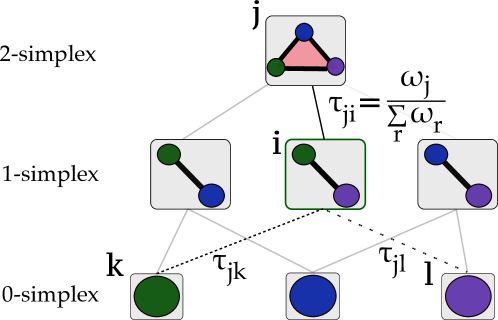
In the biased model we attach specific weights to nodes of the Hasse diagram and transition probability at each step is proportional to the weight of the destination node (see Figure 1). Specifically, Whereas the node weighting scheme can be in principle arbitrary, we implement two specific weighting schemes used in the analysis: a) with the bias towards lower order simplices (lower order bias) and b) to higher order simplices (higher order bias). The higher order bias scheme is described as follows. Initially all nodes in the Hasse diagram has assigned weight zero and we by start sequentially considering simplices in the data. Each -simplex in the data adds weight 1 to a respective node in the Hasse diagram, the weight to -simplices connected to the given -simplex, the weight to -simplices connected to respective -simplices and so on. Overall, if the -simplex is directly reachable from the considered -simplex, it receives the weight
The lower order bias scheme is analogous to the higher order scheme, except the additional weigths are inverse:
The motivation behind the weighting schemes is to compare two different exploration strategies - the lower order bias tends to explore 0-simplices, whereas the higher order bias pushes the exploration to higher order simplices in order to better capture the higher order structure.
While the biased random walk we implemented is motivated by the combinatorial structure of the inclusions among simplices in the Hasse Diagram itself, any weighting strategy for RW can be chosen according to the needs of the user. The length and the number of walks are important parameters that influence the results of the analysis as well, and usually should be chosen such that , where is a complex and its cardinality corresponds to the number of simplices in it (or nodes in its Hasse Diagram).
Notice that in our formulation, RWs are essential to navigate the -simplices of the simplicial complex. As a matter of fact, the sequence of locations visited by a RW can be regarded as a sequence of symbols that encode the local structure of adjacency of the substrate. For example, random walks are at the core of graph embedding techniques, e.g. node2vec GOYAL201878 and DeepWalk perozzi2014deepwalk . These rely on word embeddings developed in the context of natural language processing and unsupervised learning, out of which the most commonly used is word2vec 2013arXiv1301.3781M .
These models, usually, consist of two-layer neural networks that are trained to reconstruct linguistic contexts of words. Indeed, word2vec takes as its input a large corpus of texts and produces a vector space, typically of several hundred dimensions, with each unique word in the corpus being assigned a corresponding vector in the space. Word vectors are positioned in the vector space such that words that share similar contexts in the dataset are positioned close to one another in the space goldberg2014word2vec . Word2vec can both predict a word from its context or predict the context from a word. Details on the two main implementations can be found in Mikolov:2013:DRW:2999792.2999959 .
DeepWalk leverages random walks to sample node contexts (their quasi-local environment), that are subsequently fed to word2vec in order to calculate the embedding of the nodes. The DeepWalk method computes a graph embeddings in two steps. A graph is first sampled with random walks. Then, random walks are treated as sentences in the word2vec approach and fed to its neural network. Node2vec is a modification of DeepWalk. In the node2vec approach, two additional parameters are employed in order to implement an exploration-exploitation trade-off mechanism. One parameter defines how probable it is that the random walk will discover the undiscovered part of the graph, while the other one defines how probable it is that the random walk will go back to the node it visited in the step before.
II.4 Simplex2Vec
The method we propose here, Simplex2Vec, builds on these ideas and it is based on constructing contexts for the nodes of a graph which may then be fed to the word2vec package. More specifically, we use RWs defined on the Hasse diagram associated with a simplicial complex. In such a way, by navigating through the -simplices, each walk preserves high-order information on the topological structure of the simplicial complex. We sample a large set of random walks on the Hasse Diagram, which can be regarded as symbolic sequences or “words”, and subsequently we embed the contexts created in this manner in a metric space by computing a vector representation (see Figure 2 for a graphical representation of the workflow). Note that since our RWs are defined on the Hasse diagram, our method simultaneously returns a vector representation for vertices and all of the higher-dimensional simplices (up to the chosen maximal simplicial dimension). A preliminary implementation of the Simplex2Vec method is available at https://github.com/lordgrilo/doublenegroni.
II.5 Data processing and simplicial construction
II.5.1 Costa-Farber Model
To explore the effect of higher order simplices on the embeddings and corresponding partitions, we use the Costa-Farber random simplicial complex model costa2016random .
They proposed a simple construction, based on a flexible model for random simplicial complexes with randomness in all dimensions.
It starts with a set of vertices and retains each of them with probability (usually set to 1); then it connects every pair of retained vertices by an edge with probability , and then fills in every 3-clique (closed path of edges) with a 2-simplex (a full triangle) in the obtained random graph with probability , and so on for constructing simplices of order with probability . At the final step we obtain a random simplicial complex which depends on the set of probability parameters , for all .
II.5.2 Sociopatterns Data
We consider a dataset of face-to-face interactions between children and teachers of a primary school (LyonSchool) gemmetto2014mitigation and interactions between students of a high school (Thiers13) Genois2018 , available from sociopatterns.org. Interactions have a temporal resolution of s, but we aggregated the data using a temporal window of min. Within each time window we define a graph by aggregating the pairwise interactions and computed all the maximal cliques that appear in that time-window. These maximal cliques can be considered facets. We collect them across all windows and build a simplicial complex by aggregating over all the time windows. We are able to subsequently reconstruct all the lower-order simplices stemming from them, thus recovering the whole structure of the Hasse diagram. Note that, for computational reasons in the following analysis, we limit ourselves to consider simplices up to order . While higher-dimensional cliques are not included in the final simplicial complex, their sub-cliques up to size are considered in the counting.
II.5.3 Functional Connectivity
Furthermore, we consider a dataset composed of group average fMRI time series correlations (). These correlations are understood to characterize relationships among brain regions, i.e., their degree of "functional connectivity" SMITH2013144 ; BILLINGS2017344 ; Ganiesse2019 . Data were acquired from the Human Connectome Project VANESSEN20122222 . Specifically, we used an adjacency matrix of group-level correlations among 200 brain regions as input to the Hasse graph. The 200 regions are a projection from the raw fMRI voxel space onto 200 independent components (ICA200). The native connectome matrices (netmats) arrive as -statistics of Pearson correlation -values. Data were therefore preprocessed to normalize inputs to the range by calculating the inverse Fischer transform, with all constant terms set to . We then calculated absolute values on the adjacency matrix because we were interested in describing -dimensional coordinations (correlation with a 180 degree phase shift) among ICA components rather than distinguishing between strongly positive versus strongly negative correlations. This is because coordinated activation and suppression of brain hemodynamics develops unique and important routes for information flow with respect to a given brain state. Finally, the adjacency matrix was masked with a threshold of the upper of correlation values. Facets were constructed from the maximal cliques of the thresholded graphs, and included all sub-cliques. Equal weights were given to the random-walk transition probabilities between facets connected by an edge in the Hasse graph.
II.6 Clustering
When considering a graph structure, clustering of the nodes is usually carried out by directly probing the topological structure of the graph itself. This task goes under the name of community detection, and many algorithms have been developed for this purpose newman2006modularity ; rosvall2008maps ; blondel2008fast ; traag2019louvain . In the case of simplicial complexes however it is less clear how one might want to re-define classical community detection algorithms. Against this background, embeddings are very helpful: indeed, one of the main purposes of embeddings is to represent data in a non-trivial metric space, where it becomes easier for clustering algorithms to partition data into sensible groups. In order to test the quality of our embedding procedure, we run the widespread hierarchical clustering algorithm friedman2001elements on its representations of nodes. We then proceed to test the quality of the obtained results against the true labels of groups of nodes, by means of the normalized mutual information () metric cover2012elements . Even though more sophisticated clustering algorithms have been devised during the years, the good results that can be obtained already with this relatively simple procedure show the validity of our embedding approach.
III Results
III.1 Evolution of embedding structure
The first step toward understanding the role of higher order interactions in shaping the resulting embedding is quantifying the difference between the embeddings obtained with and without the contribution of higher order interactions.
To investigate this, we construct a series of simplicial complexes using the Costa-Farber random simplicial complex model (described in the Methods, section II.5.1). In this case, the model has only two parameters: the probability of two nodes being connected (exactly like in the standard Erdos-Renyi model), and the probability that a 3-clique in the underlying 1-skeleton will be filled by a 2-simplex. In particular, when the simplicial complex is one-dimensional and corresponds therefore to a standard graph. Hence, for fixed number of nodes and edge probability , we can investigate the effect of introducing higher order simplices by gradually increasing .
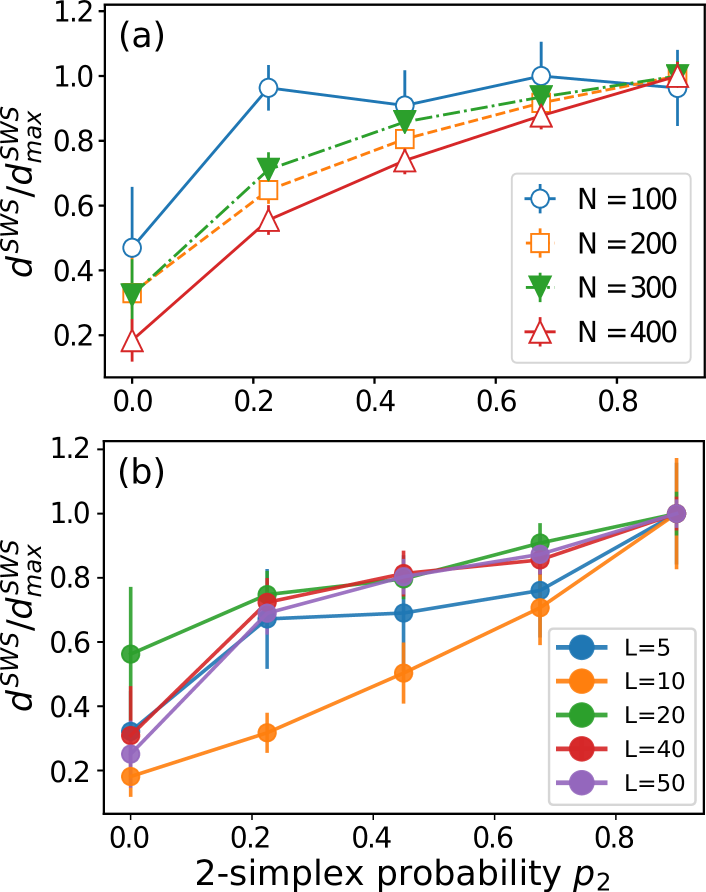
We quantify the effects of increasing by computing the one-dimensional persistence homology of the embeddings (using the standard Rips-Vietoris filtration) and then calculating the sliced Wassersstein distance between the resulting persistence diagrams (Figure 3a). We find large changes in the embedding topology already for small values; in particular, the variability of topology across different realizations of the Costa-Farber model for the same value is much smaller than change induced by increasing . We show the same general behaviour for different number of vertices (Figure 3a) and for the walk lengths , which is one of the main parameter of the embedding construction (Figure 3b).
III.2 Effects of higher-order interactions on clustering stability
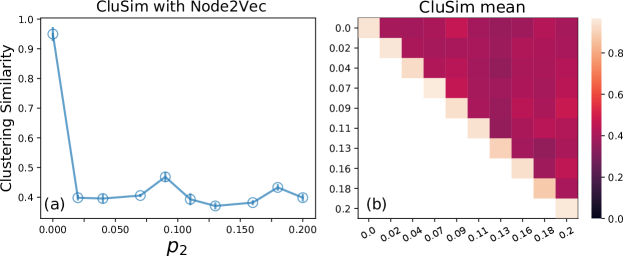
While we showed that the overall topology of the embedding is stable over realization of the same random model, this does not necessarily imply that the local structure of the embedding is stable too. This is important to understand however because the local relations between the embedded points are relevant for the resulting clustering partition. We check this as follows: we construct a graph, that is, an instance of the Costa-Farber model without triangles (); then starting from the same graph, we add triangles with different and compute the corresponding embeddings. We find that already when small amounts of higher-order interactions are present, the partitions are very dissimilar from the one obtained considering only the edge structure (Figure 4a). The same is true when we compare across different values of . We find in fact that the partition structure shows consistently a low similarity across different triangle densities (i.e. average similarity , Figure 4(b)). Note also that different realizations with the same triangle density (the diagonal in Figure 4(b)) result in partitions that are much closer than those obtained for different triangle densities, once more highlighting the critical role of higher order interactions.
;
III.3 Simplicial communities in social systems
We test now whether using the information contained in high-order interactions is relevant to obtain information about the community structure of a simplicial system. We investigate this by considering a datasets of temporal face-to-face interactions collected by the Sociopatterns collaboration: data from contacts between students in an elementary school and in a high school 10.1371/journal.pone.0136497 ; Gemmetto2014 .
Following Iacopini et al. iacopini2019simplicial (see section II.5.2), we aggregate interactions over small non-overlapping time windows (15 minutes) in sub-networks. We then consider each fully connected sub-graph of interactions created within a window as a simplex and construct the simplicial complex aggregating all interactions across all windows.
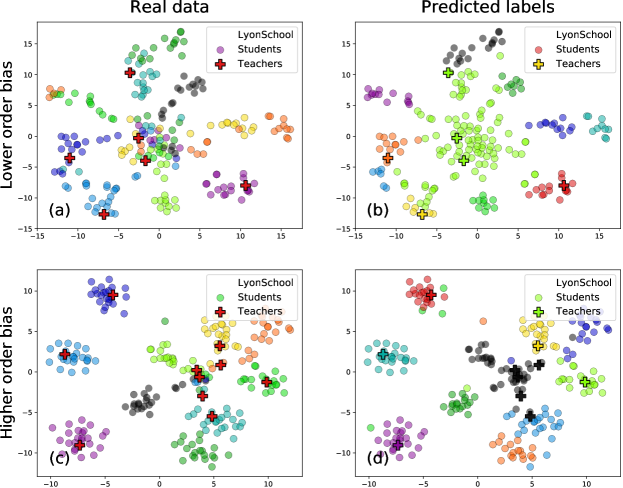
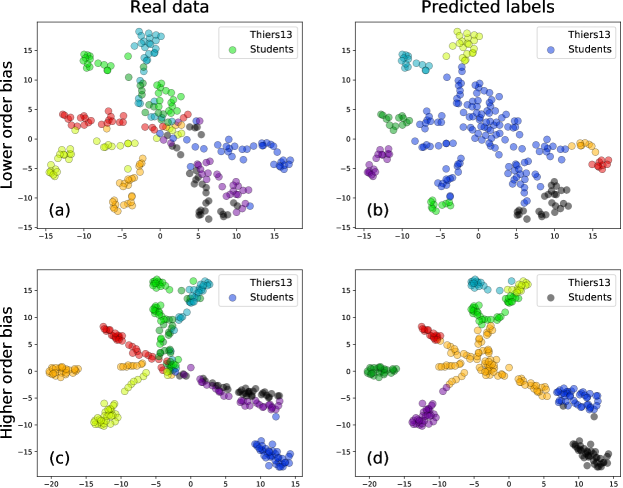
We compute the Simplex2Vec embedding for each dataset and detect clusters in the embeddings using standard clustering techniques. In Figures 5 and 6 we display the results of the clustering detection on the embeddings built using simplices up to dimension for sociopattern datasets and compare them with data on which class the students belong to. Both panels contains results for both the weighting schemes, biased toward lower order simplices (top row), and biased toward higher order simplices (bottom row). We find a better NMI ( for the second case highlighting again the role of higher order simplices in detecting the large and meso-scale structure of the system.
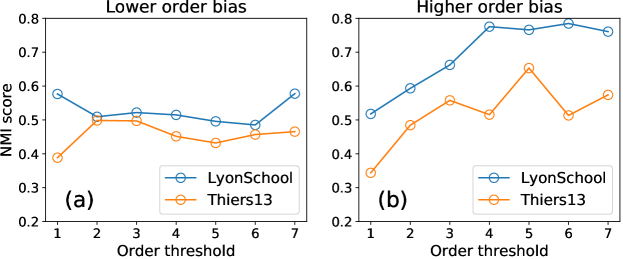
While these results are already encouraging, it is interesting to quantify how much information is encoded in higher-order interactions. This can easily be capping the maximal simplex dimension that we allow in the Hasse Diagram used to construct the embedding. In other words, we repeat the construction of the embeddings but considering only simplices up 1-simplices (edges), then up to 2-simplices (triangles), then up to 3-simplices (tetrahedra) and so on.
This provides us with a natural complexity ladder for the simplicial embeddings. For each maximal simplicial dimension, we repeat the whole construction and compute the corresponding clusters. As expected, we find that, when we bias toward lower-order simplices, increasing the order of the Hasse Diagram has little to no effect on the resulting NMI. In contrast, when using considering the bias toward higher order simplices, we find a clear increase in the resulting NMI (Figure 7).
III.4 Communities of fMRI functional connectivity
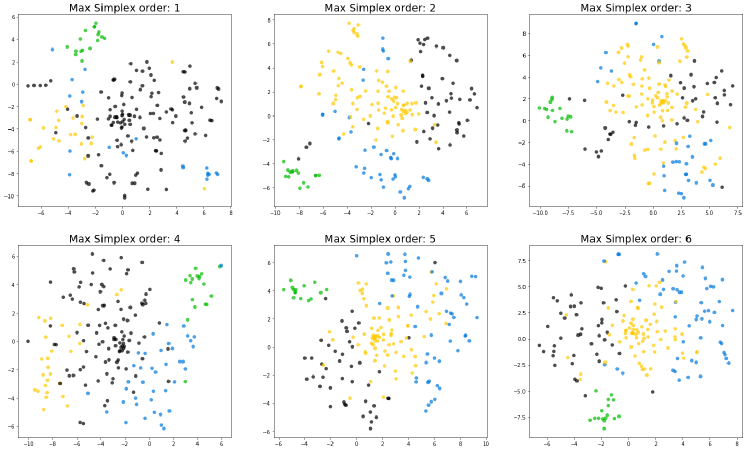
We computed Simplex2Vec embeddings for the average functional connectivity matrix described in section II.5.3 the embedding using different maximal simplicial dimensions in the Hasse Diagrams. We then perform clustering over the different embeddings and show the results in Figure 8 (only points corresponding to brain regions are showed). We find a wide variability in the results of both the embedding and clustering. We use this variability to ask which regions display a conserved community participation structure across different maximal simplicial orders. For each region and maximum simplicial order , we compute a community participation vector . We then compute the cosine similarity between the corresponding to only considering edges, and all the higher order forms, averaged over all .
We use as a coarse indicator of which regions have integration patterns that are prone to be affected by higher order interactions (low ), and regions that are less prone to be affected by higher order interactions. Regions strongly affected across repetitions include the reticular formation, the secondary visual cortex (including early areas of the dorsal and ventral streams), the conjunction of the secondary somatosensory cortex and thalamic nucleai, and single components that highlighted distributed nucleai in the brain stem. A very large plurality of regions in the cerebellum were stable across maximal interaction orders, as were focal brain stem nuclei, large patches of the bilateral dorso-ventral thalamus, and the caudate nucleus.
IV Discussion
Embeddings are a very general tool to study the structure and –potentially– dynamics of interacting systems, thanks to their capacity to represent discrete systems in continuous spaces. This motivated intense research to develop informative and scalable algorithms able to construct such embeddings for unstructured and –more recently– network data. However, with increasing frequency and across a range of disciplines, datasets are produced in which interactions are not well described by pairs of agents, but rather involve a larger and at times heterogeneous number of agents, with applications ranging from structure and prediction in temporal networks petri_icial_2018 ; benson2018simplicial to contagion dynamics iacopini2019simplicial . Simplicial complexes represent a promising way for representing such interactions, but the identification of communities remains an important challenge. The current work takes a step towards filling this gap, by providing a solution based on the developments in symbolic embeddings.
We showed in simple case studies that higher order simplices can alter strongly the community structure of an interacting system and should therefore be considered (or at least their contribution tested). We provide evidence from a social system that simplicial contributions are important to improve the correspondence of the detected clusters to the ground truth. Finally, using a parsimonious example from network neuroscience, we we showed how to assess which nodes in a system are more (or less) prone to be affected by higher order interactions.
Naturally, due to time constraints, this work has many limitations, which we plan to address in the nearest future. In particular, interesting avenues for future work include:
-
1.
extending the Simplex2Vec analysis to other dynamical systems, where the procedure described in section II.5.2 is relevant to extract group interactions over small temporal scales;
-
2.
testing the capacity of Simplex2Vec to predict missing interactions in arbitrary dimension: since Simplex2Vec simultaneously embeds all interactions, it is possible to generate predictions for any group size;
-
3.
extending the community analysis to higher order simplices: this has already been done to some degree by considering edge-communities (in neuroscience for example, see battaglia2017functional ), but Simplex2Vec provides a general framework for this;
-
4.
exploring a wider range of RW navigation biasing schemes (for example, maximally entropic RWsinatra2011maximal ) and include data-driven weights on simplices;
-
5.
and, finally, relating the results of unconstrained RW with those constrained to moving using the combinatorial Laplacian muhammad2006control ; schaub2018random (walks constrained to simplices in dimension ).
V Acknowledgments
This work was produced by the DoubleNegroni group at Complexity72h Workshop, held at IMT School in Lucca, 17-21 June 2019. Website: complexity72h.weebly.com
Data were provided [in part] by the Human Connectome Project, WU-Minn Consortium (Principal Investigators: David Van Essen and Kamil Ugurbil; 1U54MH091657) funded by the 16 NIH Institutes and Centers that support the NIH Blueprint for Neuroscience Research; and by the McDonnell Center for Systems Neuroscience at Washington University. A.M. acknowledges support of the Fonds de la Recherche Scientifique-FNRS under Grant n. 33722509 (CollectiveFootprints) and the grant 19-01-00682 of the Russian Foundation for Basic Research. G.P. and JCW. B.acknowledges partial support from Compagnia San Paolo (ADnD grant). F.M. acknowledges the support of Istituto Nazionele di Fisica Nucleare (INFN), under the BIOPHYS experiment grant.
References
- [1] Réka Albert and Albert-László Barabási. Statistical mechanics of complex networks. Rev. Mod. Phys., 74(1):47–97, 2002.
- [2] Mark Newman. Networks: An Introduction. Oxford University Press, Inc., New York, NY, USA, 2010.
- [3] Vito Latora, Vincenzo Nicosia, and Giovanni Russo. Complex Networks: Principles, Methods and Applications. Cambridge University Press, 2017.
- [4] S. Boccaletti, V. Latora, Y. Moreno, M. Chavez, and D-U. Hwang. Complex networks : Structure and dynamics. Phys. Rep., 424(4-5):175–308, 2006.
- [5] Alain Barrat, Marc Barthelemy, Romualdo Pastor-Satorras, and Alessandro Vespignani. The architecture of complex weighted networks. Proceedings of the national academy of sciences, 101(11):3747–3752, 2004.
- [6] Paolo Bajardi, Matteo Delfino, André Panisson, Giovanni Petri, and Michele Tizzoni. Unveiling patterns of international communities in a global city using mobile phone data. EPJ Data Science, 4(1):3, 2015.
- [7] Corrie J Carstens and Kathy J Horadam. Persistent homology of collaboration networks. Mathematical problems in engineering, 2013, 2013.
- [8] Anthony Bonato, Jeannette Janssen, and Paweł Prałat. A geometric model for on-line social networks. In Proceedings of the International Workshop on Modeling Social Media, page 4. ACM, 2010.
- [9] Klaus B Schebesch and Ralf W Stecking. Topological data analysis for extracting hidden features of client data. In Operations research proceedings 2015, pages 483–489. Springer, 2017.
- [10] Vedran Sekara, Arkadiusz Stopczynski, and Sune Lehmann. Fundamental structures of dynamic social networks. Proceedings of the national academy of sciences, 113(36):9977–9982, 2016.
- [11] Alice Patania, Giovanni Petri, and Francesco Vaccarino. The shape of collaborations. EPJ Data Science, 6(1):18, aug 2017.
- [12] José J Ramasco, Sergey N Dorogovtsev, and Romualdo Pastor-Satorras. Self-organization of collaboration networks. Physical review E, 70(3):036106, 2004.
- [13] Chad Giusti, Eva Pastalkova, Carina Curto, and Vladimir Itskov. Clique topology reveals intrinsic geometric structure in neural correlations. Proceedings of the National Academy of Sciences, 112(44):13455–13460, 2015.
- [14] Giovanni Petri, Paul Expert, Federico Turkheimer, Robin Carhart-Harris, David Nutt, Peter J Hellyer, and Francesco Vaccarino. Homological scaffolds of brain functional networks. Journal of The Royal Society Interface, 11(101):20140873, 2014.
- [15] Louis-David Lord, Paul Expert, Henrique M Fernandes, Giovanni Petri, Tim J Van Hartevelt, Francesco Vaccarino, Gustavo Deco, Federico Turkheimer, and Morten L Kringelbach. Insights into brain architectures from the homological scaffolds of functional connectivity networks. Frontiers in systems neuroscience, 10:85, 2016.
- [16] Danielle S Bassett and Olaf Sporns. Network neuroscience. Nature neuroscience, 20(3):353, 2017.
- [17] Paul Bendich, James S Marron, Ezra Miller, Alex Pieloch, and Sean Skwerer. Persistent homology analysis of brain artery trees. The annals of applied statistics, 10(1):198, 2016.
- [18] Jaejun Yoo, Eun Young Kim, Yong Min Ahn, and Jong Chul Ye. Topological persistence vineyard for dynamic functional brain connectivity during resting and gaming stages. Journal of neuroscience methods, 267:1–13, 2016.
- [19] Santo Fortunato. Community detection in graphs. Physics reports, 486(3-5):75–174, 2010.
- [20] Andrea Lancichinetti, Filippo Radicchi, José J Ramasco, and Santo Fortunato. Finding statistically significant communities in networks. PloS one, 6(4):e18961, 2011.
- [21] Mark EJ Newman. Modularity and community structure in networks. Proceedings of the national academy of sciences, 103(23):8577–8582, 2006.
- [22] Mark EJ Newman. Spectral methods for community detection and graph partitioning. Physical Review E, 88(4):042822, 2013.
- [23] Muhammad Aqib Javed, Muhammad Shahzad Younis, Siddique Latif, Junaid Qadir, and Adeel Baig. Community detection in networks: A multidisciplinary review. Journal of Network and Computer Applications, 108:87–111, 2018.
- [24] Alice Patania, Francesco Vaccarino, and Giovanni Petri. Topological analysis of data. EPJ Data Science, 6(1):7, jun 2017.
- [25] Robert Ghrist. Barcodes: the persistent topology of data. Bulletin of the American Mathematical Society, 45(1):61–75, 2008.
- [26] Gunnar Carlsson, Afra Zomorodian, Anne Collins, and Leonidas J Guibas. Persistence barcodes for shapes. International Journal of Shape Modeling, 11(02):149–187, 2005.
- [27] Frédéric Chazal and Bertrand Michel. An introduction to topological data analysis: fundamental and practical aspects for data scientists. arXiv preprint arXiv:1710.04019, 2017.
- [28] Renaud Lambiotte, Martin Rosvall, and Ingo Scholtes. From networks to optimal higher-order models of complex systems. Nature physics, page 1, 2019.
- [29] Iacopo Iacopini, Giovanni Petri, Alain Barrat, and Vito Latora. Simplicial models of social contagion. Nature communications, 10(1):2485, 2019.
- [30] Per Sebastian Skardal and Alex Arenas. Abrupt desynchronization and extensive multistability in globally coupled oscillator simplexes. Phys. Rev. Lett., 122:248301, Jun 2019.
- [31] Ginestra Bianconi and Robert M Ziff. Topological percolation on hyperbolic simplicial complexes. Physical Review E, 98(5):052308, 2018.
- [32] Giovanni Petri and Alain Barrat. Simplicial activity driven model. Physical review letters, 121(22):228301, 2018.
- [33] Slobodan Maletić, Yi Zhao, and Milan Rajković. Persistent topological features of dynamical systems. Chaos: An Interdisciplinary Journal of Nonlinear Science, 26(5):053105, 2016.
- [34] Owen T Courtney and Ginestra Bianconi. Generalized network structures: The configuration model and the canonical ensemble of simplicial complexes. Physical Review E, 93(6):062311, 2016.
- [35] Ginestra Bianconi and Christoph Rahmede. Complex quantum network manifolds in dimension d> 2 are scale-free. Scientific reports, 5:13979, 2015.
- [36] Ginestra Bianconi and Christoph Rahmede. Emergent hyperbolic network geometry. Scientific reports, 7:41974, 2017.
- [37] Aditya Grover and Jure Leskovec. node2vec: Scalable feature learning for networks. In Proceedings of the 22nd ACM SIGKDD international conference on Knowledge discovery and data mining, pages 855–864. ACM, 2016.
- [38] Yoav Goldberg and Omer Levy. word2vec explained: deriving mikolov et al.’s negative-sampling word-embedding method. arXiv preprint arXiv:1402.3722, 2014.
- [39] Herbert Edelsbrunner and John Harer. Computational topology: an introduction. American Mathematical Soc., 2010.
- [40] Giovanni Petri, Martina Scolamiero, Irene Donato, and Francesco Vaccarino. Topological strata of weighted complex networks. PloS one, 8(6):e66506, 2013.
- [41] Gunnar Carlsson. Topology and data. Bulletin of the American Mathematical Society, 46(2):255–308, 2009.
- [42] Yuriy Mileyko, Sayan Mukherjee, and John Harer. Probability measures on the space of persistence diagrams. Inverse Problems, 27(12):124007, 2011.
- [43] Clifford S Patlak. Random walk with persistence and external bias. The bulletin of mathematical biophysics, 15(3):311–338, sep 1953.
- [44] Palash Goyal and Emilio Ferrara. Graph embedding techniques, applications, and performance: A survey. Knowledge-Based Systems, 151:78–94, 2018.
- [45] Bryan Perozzi, Rami Al-Rfou, and Steven Skiena. Deepwalk: Online learning of social representations. In Proceedings of the 20th ACM SIGKDD international conference on Knowledge discovery and data mining, pages 701–710. ACM, 2014.
- [46] Tomas Mikolov, Kai Chen, Greg Corrado, and Jeffrey Dean. Efficient Estimation of Word Representations in Vector Space. arXiv e-prints, page arXiv:1301.3781, Jan 2013.
- [47] Tomas Mikolov, Ilya Sutskever, Kai Chen, Greg Corrado, and Jeffrey Dean. Distributed representations of words and phrases and their compositionality. In Proceedings of the 26th International Conference on Neural Information Processing Systems - Volume 2, NIPS’13, pages 3111–3119, USA, 2013. Curran Associates Inc.
- [48] Armindo Costa and Michael Farber. Random simplicial complexes. In Configuration spaces, pages 129–153. Springer, 2016.
- [49] Valerio Gemmetto, Alain Barrat, and Ciro Cattuto. Mitigation of infectious disease at school: targeted class closure vs school closure. BMC infectious diseases, 14(1):695, 2014.
- [50] Mathieu G’enois and Alain Barrat. Can co-location be used as a proxy for face-to-face contacts? EPJ Data Science, 7(1):11, May 2018.
- [51] Stephen M. Smith, Christian F. Beckmann, Jesper Andersson, Edward J. Auerbach, Janine Bijsterbosch, Gwenaëlle Douaud, Eugene Duff, David A. Feinberg, Ludovica Griffanti, Michael P. Harms, Michael Kelly, Timothy Laumann, Karla L. Miller, Steen Moeller, Steve Petersen, Jonathan Power, Gholamreza Salimi-Khorshidi, Abraham Z. Snyder, An T. Vu, Mark W. Woolrich, Junqian Xu, Essa Yacoub, Kamil Uğurbil, David C. Van Essen, and Matthew F. Glasser. Resting-state fmri in the human connectome project. NeuroImage, 80:144 – 168, 2013. Mapping the Connectome.
- [52] Jacob C.W. Billings, Alessio Medda, Sadia Shakil, Xiaohong Shen, Amrit Kashyap, Shiyang Chen, Anzar Abbas, Xiaodi Zhang, Maysam Nezafati, Wen-Ju Pan, Gordon J. Berman, and Shella D. Keilholz. Instantaneous brain dynamics mapped to a continuous state space. NeuroImage, 162:344 – 352, 2017.
- [53] Caleb Geniesse, Olaf Sporns, Giovanni Petri, and Manish Saggar. Generating dynamical neuroimaging spatiotemporal representations (dyneusr) using topological data analysis. Network Neuroscience, 0(0):1–16, 2019.
- [54] D.C. Van Essen, K. Ugurbil, E. Auerbach, D. Barch, T.E.J. Behrens, R. Bucholz, A. Chang, L. Chen, M. Corbetta, S.W. Curtiss, S. Della Penna, D. Feinberg, M.F. Glasser, N. Harel, A.C. Heath, L. Larson-Prior, D. Marcus, G. Michalareas, S. Moeller, R. Oostenveld, S.E. Petersen, F. Prior, B.L. Schlaggar, S.M. Smith, A.Z. Snyder, J. Xu, and E. Yacoub. The human connectome project: A data acquisition perspective. NeuroImage, 62(4):2222 – 2231, 2012. Connectivity.
- [55] Martin Rosvall and Carl T Bergstrom. Maps of random walks on complex networks reveal community structure. Proceedings of the National Academy of Sciences, 105(4):1118–1123, 2008.
- [56] Vincent D Blondel, Jean-Loup Guillaume, Renaud Lambiotte, and Etienne Lefebvre. Fast unfolding of communities in large networks. Journal of statistical mechanics: theory and experiment, 2008(10):P10008, 2008.
- [57] Vincent A Traag, Ludo Waltman, and Nees Jan van Eck. From louvain to leiden: guaranteeing well-connected communities. Scientific reports, 9, 2019.
- [58] Jerome Friedman, Trevor Hastie, and Robert Tibshirani. The elements of statistical learning, volume 1. Springer series in statistics New York, 2001.
- [59] Thomas M Cover and Joy A Thomas. Elements of information theory. John Wiley & Sons, 2012.
- [60] Rossana Mastrandrea, Julie Fournet, and Alain Barrat. Contact patterns in a high school: A comparison between data collected using wearable sensors, contact diaries and friendship surveys. PLoS ONE, 10(9):e0136497, 09 2015.
- [61] Valerio Gemmetto, Alain Barrat, and Ciro Cattuto. Mitigation of infectious disease at school: targeted class closure vs school closure. BMC infectious diseases, 14(1):695, December 2014.
- [62] Austin R Benson, Rediet Abebe, Michael T Schaub, Ali Jadbabaie, and Jon Kleinberg. Simplicial closure and higher-order link prediction. Proceedings of the National Academy of Sciences, 115(48):E11221–E11230, 2018.
- [63] Demian Battaglia, Boudou Thomas, Enrique CA Hansen, Sabrina Chettouf, Andreas Daffertshofer, Anthony R McIntosh, Joelle Zimmermann, Petra Ritter, and Viktor Jirsa. Functional connectivity dynamics of the resting state across the human adult lifespan. bioRxiv, page 107243, 2017.
- [64] Roberta Sinatra, Jesús Gómez-Gardenes, Renaud Lambiotte, Vincenzo Nicosia, and Vito Latora. Maximal-entropy random walks in complex networks with limited information. Physical Review E, 83(3):030103, 2011.
- [65] Abubakr Muhammad and Magnus Egerstedt. Control using higher order laplacians in network topologies. In Proc. of 17th International Symposium on Mathematical Theory of Networks and Systems, pages 1024–1038. Citeseer, 2006.
- [66] Michael T Schaub, Austin R Benson, Paul Horn, Gabor Lippner, and Ali Jadbabaie. Random walks on simplicial complexes and the normalized hodge laplacian. arXiv preprint arXiv:1807.05044, 2018.