Lattice dynamics coupled to charge and spin degrees of freedom in the molecular dimer-Mott insulator -(BEDT-TTF)2Cu[N(CN)2]Cl
Abstract
Inelastic neutron scattering measurements on the molecular dimer-Mott insulator -(BEDT-TTF)2Cu[N(CN)2]Cl reveal a phonon anomaly in a wide temperature range. Starting from - K where the charge gap opens, the low-lying optical phonon modes become overdamped upon cooling towards the antiferromagnetic ordering temperature K, where also a ferroelectric ordering at occurs. Conversely, the phonon damping becomes small again when spins and charges are ordered below , while no change of the lattice symmetry is observed across in neutron diffraction measurements. We assign the phonon anomalies to structural fluctuations coupled to charge and spin degrees of freedom in the BEDT-TTF molecules.
pacs:
71.30.+h, 78.70.Nx, 64.70.kt, 78.55.KzElectronic ferroelectricity, where electrons and their interactions play the key role, has been in the focus of recent scientific efforts Van Den Brink and Khomskii (2008); Horiuchi and Tokura (2008); Ishihara (2011). Whereas conventional ferroelectricity is driven by shifts in the atomic positions, electronic ferroelectricity originates from electronic degrees of freedom, such as spin and charge, which offers an alternative route to control the system’s ferroelectric properties. Electronic ferroelectricity, driven by spin degrees of freedom, is often found in frustrated magnetic systems with non-collinear spin structures Ishihara (2011); Kimura et al. (2003). In case of the charge-driven variant, the electric dipoles arise from charge order or charge disproportionation in combination with dimerization, which has been found in inorganic oxides Ikeda et al. (2005) and organic charge-transfer salts Chow et al. (2000); Yamamoto et al. (2008); Abdel-Jawad et al. (2010); Iguchi et al. (2013); Gati et al. (2018).
The -(BEDT-TTF) family, where BEDT-TTF is bis-(ethylenedithio)tetrathiafulvalene C6S8[(CH2)2]2, is known to comprise bandwidth-controlled dimer-Mott systems where pairs of strongly interacting BEDT-TTF (in short ET) molecules form the dimers. In the dimer-Mott insulator picture, one -hole carrier with spin is localized on a molecular dimer unit. The charge degrees of freedom may become active when this localization is no longer symmetric with respect to the center of the dimer but rather adopts an asymmetric state characterized by a charge disproportionation within the dimer Naka and Ishihara (2010); Hotta (2012). Such a charge disproportionation scenario was suggested as the origin of the relaxor-type dielectric anomaly observed in the quantum-spin-liquid-candidate material = Cu2(CN)3 (-CN) Shimizu et al. (2003); Abdel-Jawad et al. (2010) – a suggestion which has created enormous attention as it highlights the important role of the intra-dimer charge degrees of freedom. Since relaxor ferroelectrics are known to consist of nanometer-sized domains, the relaxor-like dielectric anomaly in -CN suggests the presence of an inhomogeneous charge disproportionation. Recently, Lunkenheimer et al. have reported clear ferroelectric signatures in the related dimer-Mott system = Cu[N(CN)2]Cl (-Cl) around the antiferromagnetic ordering temperature K Lunkenheimer et al. (2012); Lang et al. (2014). As in this system long-range ferroelectricity of order-disorder type is observed at , -Cl represents an ideal system to study the coupling of the charge- to the spin- and lattice degrees of freedom in a dimer-Mott insulator.
It is fair to say that the origin of the electric dipoles in these dimer-Mott insulators is still under debate. Whereas for -Cl and -CN a definite proof of charge disproportionation is still missing Sedlmeier et al. (2012), clear evidence for charge order within the ET dimers has recently been found for the more weakly dimerized compound = Hg(SCN)2Cl Drichko et al. (2014), making this system a prime candidate for electronically-driven ferroelectricity within the -(ET) family Gati et al. (2018).
Given that there is a finite electron-lattice coupling, fluctuations of the electric dipoles are expected to give rise to anomalies in the lattice dynamics which can be sensitively probed by neutron scattering. In fact, for relaxor ferroelectrics, neutron scattering studies have been able to reveal a phonon anomaly upon the appearance of inhomogeneous and fluctuating polar domains Gehring et al. (2000).
Unfortunately, systematic inelastic neutron scattering (INS) studies on organic charge-transfer salts have often been hampered due to the lack of sufficiently large single crystals with only a few exceptions: for instance, a sizable phonon renormalization effect on entering the superconducting state was reported for the organic superconductor -(ET)2Cu(NCS)2 Pintschovius et al. (1997). Thanks to major recent improvements in focusing the neutron beam, however, the situation has improved considerably. As we demonstrate in this work, the largely enhanced neutron flux at the sample position in state-of-the-art triple-axis-spectrometers Hiess et al. (2006); Zentrum (2015) now enables such INS studies to be performed even on small single crystals of organic charge-transfer salts. Here we report an INS study of the lattice dynamics and its coupling to the charge- and spin degrees of freedom for the dimer-Mott insulator -Cl. By using an array of co-aligned single crystals of deuterated -Cl with total mass of 7 mg and 9 mg, we were able to detect clear phonon signals the amplitude of which shows a striking variation upon changing the temperature. We found that the low-lying optical phonon modes at 2.6 meV become damped below the onset temperature of the dimer-Mott insulating state in which the -carriers start to localize on the dimer sites. This phonon damping becomes small again on cooling below . In contrast to conventional displacive ferroelectrics, however, there is no divergence of the phonon intensity nor any change in the lattice symmetry at where also the dielectric anomaly was observed. Thus, in -Cl the lattice is clearly coupled to the charge- and spin degrees of freedom but appears not to be the driving force of the antiferromagnetic/ferroelectric phase transition at .
Deuterated single crystals of -(ET)2Cu[N(CN)2]Cl were grown by electrochemical crystallization. The Néel temperature was determined to be K from magnetic susceptibility measurements as shown in Fig. 3(d), which is identical to the ordering temperature reported for hydrogenated -Cl Miyagawa et al. (1995). INS experiments were performed on the triple-axis spectrometers IN8 at the Institut Laue-Langevin Hiess et al. (2006) and PUMA at the Heinz Maier-Leibnitz Zentrum Zentrum (2015). All data were collected with a fixed final neutron energy of 14.7 meV using a doubly focused Cu analyzer for IN8 and a doubly focused pyrolytic graphite (PG) analyzer for PUMA. The initial neutron energy was selected by a doubly focused PG monochromator for both IN8 and PUMA. A PG filter was placed in front of the analyzer to suppress the scattering of higher-order neutrons. To improve the signal-to-noise ratio, two single crystals with a total mass of 7 mg, and six single crystals with a total mass of 9 mg were co-aligned for the neutron experiments on IN8 and PUMA, respectively. In all experiments, the samples were slowly cooled with 1 K/min around K to minimize disorder in the ET molecules’ ethylene endgroup orientations Müller et al. (2002, 2015). The single crystals were mounted so as to access the () and () scattering plane for INS and neutron diffraction measurements, respectively. Throughout this paper, we label the momentum transfer in units of the reciprocal lattice vectors Å-1, Å-1 and Å-1. The instrumental energy resolution for IN8 linearly increases from 0.45 meV () to 0.84 meV ( meV). To relate the fit parameters to the scattering function of the sample, convolution of the instrumental resolution at meV has been included and computed using the RESTRAX simulation package Saroun and Kulda (1997). We assume flat dispersions within -width of the resolution ellipsoid since optical dispersions close to the -point are flat.
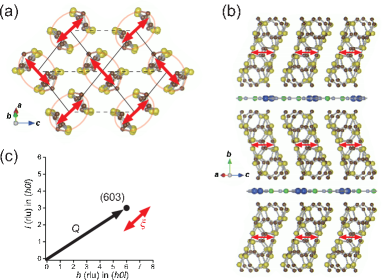
Figures 1 (a) and (b) show the crystal structure of -Cl consisting of layers of ET molecules separated by thin anion sheets. The ET molecules form dimers, resulting in a dimer-Mott insulating ground state. Since the distance between the ET molecules within the dimer reflects the degree of dimerization, some of the modes are expected to couple more strongly to the electronic degrees of freedom than others. One of such modes is a breathing mode of the ET dimers, shown schematically by thick arrows in Figs. 1(a) and (b). The scattering intensity of phonons in neutron scattering is proportional to ()2, where is the momentum transfers between the initial and final state of the neutron, and is the polarization vector of the phonon mode. Thus, the breathing of the ET dimers can best be measured when is large and parallel to of the breathing mode as shown in Fig. 1(c). We measured the phonon spectra mainly at (603) to detect changes in the low-lying vibrational modes which are likely coupled to the charge- and spin degrees of freedom; changes will be detected for any vibrational mode which has a component parallel to [603].
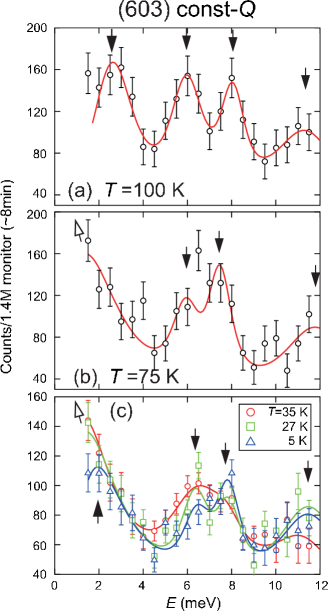
Figures 2(a)-(c) show constant- scans at (603) measured at various temperatures. At K, we observe clear phonon peaks at , 6, 8, and 11 meV shown by the closed arrows. (See Figs. S1 and S2 in the Supplemental Material for the details of the dispersion Sup ). The peak width for the low-lying modes at meV (full-width-at-half-maximum; 2.3 meV) is considerably larger than the energy resolution (0.5 meV) indicating a finite lifetime due to phonon-phonon or electron-phonon interactions. For an anharmonic phonon, the energy dependence of the scattering function can be expressed by by the damped harmonic-oscillator function: Gesi et al. (1972)
| (1) |
where is the energy transfers between the initial and final state of the neutron, and denotes the damping factor. The lifetime of the phonons is inversely proportional to . The enhanced phonon width, when compared to the energy resolution, suggests a strongly anharmonic lattice, consistent with the observation of large expansion coefficients in the -(ET) family Müller et al. (2002). On cooling, the well-resolved peak from the low-lying optical modes at 2.6 meV changes into a sloped signal at K, whereas the three modes at 6, 8, and 11 meV remain at almost the same energy [Fig. 2(b)]. When the damping factor becomes comparable to , the phonon spectrum changes into a single peak at . The sloped spectrum can be explained by an increasing for the low-lying optical modes, which indicates the short lifetime of these modes. Similar phonon spectra at low energies are observed down to K [Fig. 2(c)]. Below , the truly inelastic nature of the low-lying optical modes become again visible.
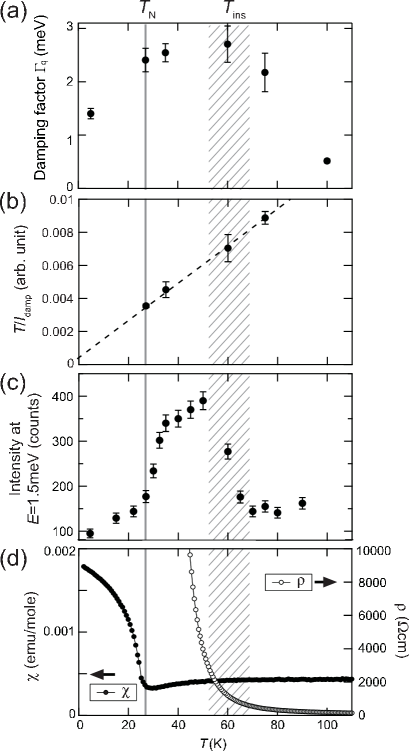
Figure 3(a) shows the temperature dependence of the damping factor for the low-lying optical modes. Note that is comparable to in a wide temperature range for K, indicating the damped nature of the low-lying optical modes. In addition to the phonon anomaly, we find that the energy width of the Bragg peaks is broadened in the same temperature range (Fig. S3 in the Supplemental Material), suggesting an unstable lattice in this temperature region. Thus, the lattice of -Cl shows anomalous behavior in a wide temperature range above .
Overdamped soft modes are often seen near structural phase transitions in a variety of materials. In the overdamped regime, the scattering function is approximated as Shirane et al. (2002):
| (2) |
where is the unit cell volume, is a dynamical structure factor, and . Thus, the integrated intensity of an overdamped soft mode () is proportional to . As goes to zero at the transition temperature, the intensity of the damped soft mode diverges and / goes to zero. Figure 3(b) shows the temperature dependence of / for the low-lying optical modes. Clearly, / does not vanish at , which indicates that the structural change is not the primary order parameter for the phase transition at . This is consistent with the observation of only a small anomaly in the thermal expansion at for -Cl Müller et al. (2002). Instead, other degrees of freedom show divergent behavior at , namely ()-1 of NMR for the spin Miyagawa et al. (1995) and the dielectric constant for the charge degrees of freedom Lunkenheimer et al. (2012).
Note that the overdamped phonon appears already at K, which is much higher than . Figure 3(c) shows the temperature dependence of the scattering intensity at (603) and meV. The effect of the phonon anomaly is clearly seen as an enhancement of the intensity at low energies ( meV) for K. The coupling between a phonon mode and a relaxation mode of different origin (represented by a pseudospin) was discussed by Yamada within a pseudospin-phonon coupling model Yamada et al. (1974). In this model, the relaxation mode and the phonon mode become strongly coupled when the characteristic frequency and wave vector of the pseudospin’s relaxation mode roughly match those of the phonon mode, which results in a broadening of the phonon in energy. The structural fluctuations between the two ethylene endgroup orientations of the ET molecules, known to occur in the -phase (ET) salts Müller et al. (2015); Geiser et al. (1991), however cannot be the origin of the observed phonon anomaly since the ethylene endgroup motion freezes out in a glassy fashion below about 75 K.
On the other hand, the onset temperature of the phonon anomaly roughly coincides with the rapid increase in the electrical resistivity below - K, as shown in Fig. 3(d). Optical conductivity measurements have revealed that the charge gap starts to open below Kornelsen et al. (1992); Sasaki et al. (2004), indicating charge localization at the ET dimer site. Even after the itinerant -carriers become localized at the dimer site below , the distribution of charge within the dimer remains as an active degree of freedom. The coincidence of the onset temperature of the phonon anomaly and suggests a coupling between the lattice and this intra-dimer charge degree of freedom. A similar scenario was observed in the organic superconductor -(ET)2Cu(NCS)2 for the lowest optical mode Pintschovius et al. (1997). We thus expect that the low-lying optical modes are the key modes where the electron-phonon coupling becomes manifest in these organic salts containing ET molecules.
In an attempt to identify the low-lying optical modes with the theoretically obtained vibrational frequencies, we considered the phonon frequencies of the closely related system -CN Dressel et al. (2016) which has a similar arrangement of anion and ET layers as -Cl, but exhibits considerably less phonon modes. The calculated lowest optical mode in -CN at has an energy of 3 meV and two of the ET-dimer breathing modes, involving also the movements of the anion layers, lie at energies of 4.1 meV and 4.7 meV. The -Cl system differs from -CN mainly in two ways: (i) the ET-dimers in -Cl are alternately stacked along the axis, thus doubling the unit cell along that direction and (ii) the anion layers consist of chains arranged in a polymeric zigzag pattern, instead of having a more rigid two-dimensional network in -CN. It is to be expected that these factors will lead to significantly softer spring-constants in -Cl compared to -CN. Such a rescaling of the phonon modes would affect all the phonons in the low-frequency regime. The lowest mode in -CN may shift toward very low energies and merge with the elastic peak, which may allow to identify the observed low-lying optical modes in -Cl as an ET-dimer breathing mode.
Below , the damping of the low-lying optical modes become small as shown in Fig. 2(c) and Fig. 3(a). According to the pseudospin-coupling model Yamada et al. (1974), the reduction in the damping factor is due to the decoupling between the lattice and the pseudospins as a consequence of a critical slowing down of the pseudospin fluctuations. Since both dielectric and antiferromagnetic fluctuations freeze out below Lunkenheimer et al. (2012), the recovery of a truly inelastic phonon peak suggests a close correlation between lattice-, spin- and charge degrees of freedom at the phase transition at .
In order to check for the possibility of a change in the crystallographic symmetry at , we performed detailed neutron diffraction measurements on a deuterated single crystal of -Cl at K () and 4 K () (Fig. S4 in the Supplemental Material). As explained in detail in the supplemental material, we did not find any indications for a crystallographic symmetry lowering at . This supports the picture of electronic ferroelectricity, where instead of the lattice, the spin- or charge degrees of freedom are the driving force of the phase transition in -Cl.
In discussing our results, we recall that recent vibrational spectroscopy studies failed to detect clear signatures of a charge disproportionation in -Cl and -CN Sedlmeier et al. (2012). On the other hand, our finding of overdamped modes for strongly suggests a close coupling between the lattice and the intra-dimer charge degrees of freedom. According to the pseudospin-coupling model Yamada et al. (1974), the characteristic energy of the charge fluctuations is expected to be in the same range as the low-lying optical modes, meV, for . This energy scale is two orders of magnitude smaller than that of the charge-sensitive mode studied in the above-mentioned vibrational spectroscopy experiments. Furthermore, a finite DC conductivity is observed even in the ”Mott-insulating” state below reflecting some degree of remaining itinerancy of the fluctuating -electrons. The complex and seemingly contradictory picture of the low energy charge dynamics reported so far is likely due to the different time-scales of the investigated characteristic mode.
To summarize, by studying the spectra of selected phonons of the dimer-Mott insulator -(ET)2Cu[N(CN)2]Cl as a function of temperature, we found clear renormalization effects which can be associated with charge fluctuations. We argue that the overdamped optical phonon modes, observed in a wide temperature range from - K down to , result from a coupling of the lattice to the intra-dimer charge degrees of freedom. We consider these inelastic neutron scattering results as an important step which may trigger further systematic studies on the lattice dynamics and its coupling to the electronic degrees of freedom in the family of organic charge-transfer salts.
We are grateful to M. Naka and S. Ishihara for helpful discussions. We also thank O. Sobolev, M. Kurosu, R. Kobayashi, B. Hartmann, T. Ohhara, and K. Munakata for their help in the experiments. The neutron experiments were performed with the approval of ILL (7-01-401), MLZ (11879), and J-PARC MLF (2017B0201). The crystal structures in Fig. 1 are produced by VESTA softwareMomma and Izumi (2011). This study was financially supported by Grants-in-Aid for Scientific Research (Grants Nos. 25287080, 19H01833, 16K05430, and 18H04298) from the Japan Society for the Promotion of Science.
References
- Van Den Brink and Khomskii (2008) J. Van Den Brink and D. I. Khomskii, J. Phys.: Cond. Matt. 20, 434217 (2008).
- Horiuchi and Tokura (2008) S. Horiuchi and Y. Tokura, Nat. Mater. 7, 357 (2008).
- Ishihara (2011) S. Ishihara, J. Phys. Soc. Jpn 79, 011010 (2011).
- Kimura et al. (2003) T. Kimura, T. Goto, H. Shintani, K. Ishizaka, T. h. Arima, and Y. Tokura, Nature 426, 55 (2003).
- Ikeda et al. (2005) N. Ikeda, H. Ohsumi, K. Ohwada, K. Ishii, T. Inami, K. Kakurai, Y. Murakami, K. Yoshii, S. Mori, and Y. Horibe, Nature 436, 1136 (2005).
- Chow et al. (2000) D. S. Chow, F. Zamborszky, B. Alavi, D. J. Tantillo, A. Baur, C. A. Merlic, and S. E. Brown, Phys. Rev. Lett. 85, 1698 (2000).
- Yamamoto et al. (2008) K. Yamamoto, S. Iwai, S. Boyko, A. Kashiwazaki, F. Hiramatsu, C. Okabe, N. Nishi, and K. Yakushi, J. Phys. Soc. Jpn. 77, 074709 (2008).
- Abdel-Jawad et al. (2010) M. Abdel-Jawad, I. Terasaki, T. Sasaki, N. Yoneyama, N. Kobayashi, Y. Uesu, and C. Hotta, Phys. Rev. B 82, 125119 (2010).
- Iguchi et al. (2013) S. Iguchi, S. Sasaki, N. Yoneyama, H. Taniguchi, T. Nishizaki, and T. Sasaki, Phys. Rev. B 87, 075107 (2013).
- Gati et al. (2018) E. Gati, J. K. H. Fischer, P. Lunkenheimer, D. Zielke, S. Köhler, F. Kolb, H.-A. K. von Nidda, S. M. Winter, H. Schubert, J. A. Schlueter, et al., Phys. Rev. Lett. 120, 247601 (2018).
- Naka and Ishihara (2010) M. Naka and S. Ishihara, J. Phys. Soc. Jpn 79, 063707 (2010).
- Hotta (2012) C. Hotta, Crystals 2, 1155 (2012).
- Shimizu et al. (2003) Y. Shimizu, K. Miyagawa, K. Kanoda, M. Maesato, and G. Saito, Phys. Rev. Lett. 91, 107001 (2003).
- Lunkenheimer et al. (2012) P. Lunkenheimer, J. Müller, S. Krohns, F. Schrettle, A. Loidl, B. Hartmann, R. Rommel, M. de Souza, C. Hotta, and J. A. Schlueter, Nature Materials 11, 755 (2012).
- Lang et al. (2014) M. Lang, P. Lunkenheimer, J. Müller, A. Loidl, B. Hartmann, N. H. Hoang, E. Gati, H. Schubert, and J. A. Schlueter, IEEE Transactions on Magnetics 50, 2700107 (2014).
- Sedlmeier et al. (2012) K. Sedlmeier, S. Elsässer, D. Neubauer, R. Beyer, D. Wu, T. Ivek, S. Tomić, J. A. Schlueter, and M. Dressel, Phys. Rev. B 86, 245103 (2012).
- Drichko et al. (2014) N. Drichko, R. Beyer, E. Rose, M. Dressel, J. A. Schlueter, S. A. Turunova, E. I. Zhilyaeva, and R. N. Lyubovskaya, Phys. Rev. B 89, 075133 (2014).
- Gehring et al. (2000) P. M. Gehring, S. E. Park, and G. Shirane, Phys. Rev. Lett. 84, 5216 (2000).
- Pintschovius et al. (1997) L. Pintschovius, H. Rietschel, T. Sasaki, H. Mori, S. Tanaka, N. Toyota, M. Lang, and F. Steglich, Europhys. Lett. 37, 627 (1997).
- Hiess et al. (2006) A. Hiess, M. Jiménez-Ruiz, P. Courtois, R. Currat, J. Kulda, and F. J. Bermejo, Physica B: Condensed Matter 385, 1077 (2006).
- Zentrum (2015) H. M.-L. Zentrum, J. Large-Scale Res. Facilities 1, A13 (2015).
- Miyagawa et al. (1995) K. Miyagawa, A. Kawamoto, Y. Nakazawa, and K. Kanoda, Phys. Rev. Lett. 75, 1174 (1995).
- Müller et al. (2002) J. Müller, M. Lang, F. Steglich, J. A. Schlueter, A. M. Kini, and T. Sasaki, Phys. Rev. B 65, 144521 (2002).
- Müller et al. (2015) J. Müller, B. Hartmann, R. Rommel, J. Brandenburg, S. M. Winter, and J. A. Schlueter, New J. Phys. 17, 083057 (2015).
- Saroun and Kulda (1997) J. Saroun and J. Kulda, Physica B: Condensed Matter 234, 1102 (1997).
- (26) See Supplemental Material [url] for the details of the dispersion, the energy width of the Bragg peak, and the neutron diffraction measurements, which includes Refs. [27-28].
- Ohhara et al. (2015) T. Ohhara, R. Kiyanagi, K. Oikawa, K. Kaneko, T. Kawasaki, I. Tamura, A. Nakao, T. Hanashima, K. Munakata, T. Moyoshi, et al., J. Appl. Crystallography 49, 120 (2015).
- Williams et al. (1990) J. M. Williams, A. M. Kini, H. H. Wang, K. D. Carlson, U. Geiser, L. K. Montgomery, G. J. Pyrka, D. M. Watkins, J. M. Kommers, and S. J. Boryschuk, Inorganic Chemistry;(USA) 29 (1990).
- Gesi et al. (1972) K. Gesi, J. D. Axe, G. Shirane, and A. Linz, Phys. Rev. B 5, 1933 (1972).
- Shirane et al. (2002) G. Shirane, S. M. Shapiro, and J. M. Tranquada, Neutron scattering with a triple-axis spectrometer: basic techniques (Cambridge University Press, 2002).
- Yamada et al. (1974) Y. Yamada, H. Takatera, and D. L. Huber, J. Phys. Soc. Jpn 36, 641 (1974).
- Geiser et al. (1991) U. Geiser, A. J. Schults, H. H. Wang, D. M. Watkins, D. L. Stupka, J. M. Williams, J. E. Schirber, D. L. Overmyer, D. Jung, and J. J. Novoa, Physica C: Superconductivity 174, 475 (1991).
- Kornelsen et al. (1992) K. Kornelsen, J. E. Eldridge, H. H. Wang, H. A. Charlier, and J. M. Williams, Sol. State Commun. 81, 343 (1992).
- Sasaki et al. (2004) T. Sasaki, I. Ito, N. Yoneyama, N. Kobayashi, N. Hanasaki, H. Tajima, T. Ito, and Y. Iwasa, Phys. Rev. B 69, 064508 (2004).
- Dressel et al. (2016) M. Dressel, P. Lazić, A. Pustogow, E. Zhukova, B. Gorshunov, J. A. Schlueter, O. Milat, B. Gumhalter, and S. Tomić, Phys. Rev. B 93, 081201(R) (2016).
- Momma and Izumi (2011) K. Momma and F. Izumi, J. Appl. Cryst. 44, 1272 (2011).