Multi-physics simulations of lightning strike on elastoplastic substrates.
Abstract
This work is concerned with the numerical simulation of elastoplastic, electromagnetic and thermal response of aerospace materials due to their interaction with a plasma arc under lightning strike conditions. Current approaches treat the interaction between these two states of matter either in a decoupled manner or through one-way coupled ‘co-simulation’. In this paper a methodology for multiphysics simulations of two-way interaction between lightning and elastoplastic materials is presented, which can inherently capture the non-linear feedback between these two states of matter. This is achieved by simultaneously solving the magnetohydrodynamic and the elastoplastic systems of equations on the same computational mesh, evolving the magnetic and electric fields dynamically. The resulting model allows for the topological evolution and movement of the arc attachment point coupled to the structural response and Joule heating of the substrate. The dynamic communication between the elastoplastic material and the plasma is facilitated by means of Riemann problem-based ghost fluid methods. This two-way coupling, to the best of the authors’ knowledge, has not been previously demonstrated. The proposed model is first validated against experimental laboratory studies, demonstrating that the growth of the plasma arc can be accurately reproduced, dependent on the electrical conductivity of the substrate. It is then subsequently evaluated in a setting where the dynamically-evolved properties within the substrate feed back into the plasma arc attachment. Results are presented for multi-layered substrates of different materials, and for a substrate with temperature-dependent electrical conductivity. It is demonstrated that these conditions generate distinct behaviour due to the interaction between the plasma arc and the substrate.
keywords:
multi-physics , plasma , lightning , elastoplastic , multi-material , ghost fluid methods50
1 Introduction
On average, every commercial airliner is struck by lightning once a year, hence all aircraft undergo rigorous testing to ensure these strikes do not lead to major in-flight damage [1]. Traditionally, most aircraft skins have been made from aluminium, which is lightweight and strong under normal in-flight conditions, but also both thermally and electrically conductive, thus it quickly dissipates the energy deposition from a lightning strike away from the impact site. Modern designs increasingly make use of carbon composite materials, which are stronger and lighter than aluminium under normal aircraft operating conditions [2]. However, they have much lower thermal and electrical conductivity, which leads to increased energy deposition at the site of a lightning strike, due to the Joule heating effect, which in turn can lead to much greater damage on an aircraft panel. In order to mitigate these effects, composite materials typically include an interwoven wire fabric, threads of high conductivity wires which dissipates current away from the initial impact site, reducing the local energy deposition. However, this increases the weight of the aircraft, negating some of the savings introduced through the lightweight composite.

Over the course of a lightning strike, the current flow consists of a long continuing current of a few hundred amperes, which can last for up to 1 s. Superimposed upon this are multiple high-current peaks, each with duration less than 0.5 ms, these are referred to as ‘strokes’, illustrated in Figure 1. This information is used to create standardised wave forms for experimental studies [4] which are designed to be representative of severe conditions and each stroke can reach maximum current input between 100,000 A and 200,000 A. Such extreme conditions are expected for less than 5% of lightning strikes. Damage due to lightning strike falls into two categories, direct and indirect effects. Direct effects are localised damage due to the arc connection, for which the individual strokes, shown in Figure 1, are the primary cause. Indirect effects involve the electrodynamic interaction of the process with the entire aircraft, and therefore consider the entire strike profile [5].
In this work, the local damage to the substrate, caused by an individual stroke, is the primary area of interest. Experimental modelling of these effects typically uses small-scale investigations [5] over the duration of a single stroke. Though at a much smaller scale than a full lightning strike, by using extreme stroke conditions, these provide a good model of lightning strike damage. The advantage of these experiments is that the impact point on the substrate can be closely controlled, allowing analysis over the entire course of the experiment. Numerical simulations can reduce the expense of repeated experiments and can complement experimental measurements during the dynamic interaction between a lightning strike and a substrate.
The interaction between the arc and the substrate is a complex, non-linear process, and thus presents challenges in capturing the full behaviour within a numerical model. Initial work in simulating the arc profile was developed from a numerical magnetohydrodynamic (MHD) description of an argon arc by Hsu et al. [6], with applications in plasma arc welding. Gliezes et al. also considered stationary arcs, and this allowed a temperature profile at the attachment point to be computed [7]. The turbulent motion of the arc channel was simulated by Chemartin et al. [8], and a smaller scale arc, with current profile given between an anode and a cathode (the substrate skin) was later developed by Chemartin et al. [9]. This model was then applied to a swept arc, with multiple attachment points [10], and a subsequent analysis of the effects this had on a material substrate was carried out.
Villa et al. [11] consider the pressure loading above a substrate using an MHD plasma model, with a prescribed current density evolution. Although pressures above the substrate are measured, the effect within the substrate itself was not investigated. The effects of the conductivity of the cathode were considered by Tholin et al. [12], and this showed how the shape of the arc attachment changes dramatically for low conductivity carbon composite materials. This work was expanded upon in the thesis of Martins [13], which focuses on experimental measurements of plasma arcs using a variety of substrates.
Typically, the effects of the arc attachment on the substrate are modelled separately. Ogasawara et al. [14], consider the damage within a carbon composite substrate, though do not model the plasma arc directly, but instead use a prescribed current input. Abdelal and Murphy [15] also take this approach, with modifications as to how the current profile is applied, as did Guo et al. [16]. Foster et al. [17] highlight the importance of movement of the attachment point through prescribed motion of the current profile. Karch et al. [18] compute damage to a carbon composite substrate through a prescribed expansion of a plasma arc expansion.
The computational models described above typically simulate the arc attachment process and the substrate response individually, rather than as a two-way interacting system, and coupling is achieved through a ‘co-simulation’ approach, modelling each system individually. The Joule heating and pressure loading effects of the arc attachment lead to damage within the substrate. However, this can both alter the shape of the substrate (either through bending or damage) and can change the properties of the substrate, such as electrical conductivity, which leads to a feed-back effect changing the arc attachment. Therefore a truly nonlinear multi-physics approach is needed to capture the two-way interaction between the two systems. The approaches described above do not capture this behaviour in a single model, and hence cannot fully replicate these non-linear effects.
In this work, a multi-physics methodology is presented which allows for the dynamic non-linear coupling of the plasma arc and the substrate. The framework developed within the Laboratory for Scientific Computing at the University of Cambridge is used [19, 20], which simultaneously solves coupled elastoplastic and fluid equations. This framework is extended to simulate the interaction between a MHD description of a plasma arc and the elastoplastic equations. Through this, the feedback between the two states of matter can be captured; the plasma arc alters the properties of the substrate, and this in turn affects the topology of the arc.
The rest of the paper is laid out as follows: In Section 2 the mathematical formulation of the model components, and the multi-material coupling, is detailed. In Section 3, validation of the plasma model used in this work is presented. In Section 4 the coupling to multi-layered substrates is demonstrated, and in Section 5 the ability for this model can capture feedback from the substrate into the plasma arc is shown. Conclusions and further work are given in Section 6.
2 Mathematical formulation
In this section, the mathematical models used to describe the interaction between a plasma arc and an elastoplastic substrate are presented. A reference configuration to describe the application of this model is considered; a plasma arc in air, generated by an electrode, and connected to a conductive elastoplastic substrate which is grounded at its outer edges. This is representative of the laboratory framework for testing the effects of lightning strike on aircraft skin configurations, such as those used in [11, 12, 13]. Within this framework, a cylindrically symmetric model is considered, with the arc connection at the centre of the domain, which is sufficient to capture the bulk behaviour of the arc-substrate interaction [13]. This configuration is illustrated in Figure 2, for which a single-material isotropic substrate is shown. A blunt electrode is placed above a grounded substrate, and sufficient current is passed through the electrode to generate a plasma arc. The voltage breakdown of the air, which occurs at timescales much shorter than the mechanical evolution of the system, is not modelled within this framework. Instead the procedure of e.g. Chemartin et al. [9], Larsson et al. [21], and Tholin et al. [12], is followed, and a thin pre-heated region of the domain is considered, representative of the initial connection resulting from voltage breakdown. This region is of sufficiently high temperature to result in ionisation and the formation of a plasma. This allows current flow from the electrode to the grounded edge of the substrate. It has been shown that the values within this preheated region do not affect the overall evolution of the plasma arc [9, 21].
When considering the MHD approach to modelling plasma, it is generally assumed that the arc is close to local thermodynamic equilibrium (LTE), i.e. the arc can be described with a single temperature. This has been shown to give good agreement with experimental studies [12, 13], and the complexity in otherwise determining transport coefficients for a non-equilibrium air plasma means the LTE approach is widely used, thus this approach is used in this work. Simulations using non-equilibrium plasmas do exist [22], but the added complexity of these models, in which detailed chemistry is required for each species modelled, means they are not generally used when the LTE approach holds.
The substrate and electrode materials are described through an elastoplastic model in the Eulerian frame [19, 20]. The domain beneath the substrate is included such that it is straightforward to incorporate the grounding of the substrate only at the outer edge. This domain is considered to be air, described through an ideal gas law, since over the timescales considered, it is not heated sufficiently for ionisation and a plasma model to be required.
2.1 The plasma model
Under the LTE assumption, the plasma arc is described through the single fluid Euler equations coupled with the Maxwell equations for electrodynamic fields. This gives three equations for the conservation of mass, momentum and energy,
| (1a) | ||||
| (1b) | ||||
| (1c) | ||||
where denotes the density, the velocity vector, the pressure and the total energy. The source term is the Lorentz force due to circulation of the electric current, where is the current density and the magnetic field. The source term is the Joule heating term due to circulation of current in resistive media, where is the resistivity, the inverse of the electrical conductivity, and is the electric field. The final source term, is a radiative transfer term and in this work, a grey body treatment is used, following Villa et al. [11]. This is a simplified, temperature dependent radiative model, though it may not be suitable for sufficiently large temperature variations. Improvements to the radiative model will be the subject of future work.
The electrodynamic source terms are calculated under the assumption that the electric field is static, depending only on the charge distribution and voltage gradient. The conservation of current density can therefore be written as
| (2) |
where is the electric potential. Note that although there is no explicit time dependence to the electric field, the electrical conductivity of the plasma is dependent on temperature (and pressure), thus does have implicit dependence. The magnetic field is computed from the current density through the Maxwell-Ampere equation
| (3) |
where is the magnetic vector potential.
In order to close the equations, an equation of state based on the work of d’Angola et al. [23] is used. This describes the composition of an air plasma considering the 19 most important components over temperatures K and pressures atm. From this, the thermodynamic and electrodynamic properties of the plasma are also given. These relationships are given as fitted functions of pressure and temperature, which are not invertible. Therefore for numerical purposes, this data has been tabulated providing an efficient means to convert between variables within the current model [24].
2.2 The elastoplastic model
The elastoplastic substrate and electrode are described using the Eulerian framework as presented by Schoch et al. [19] and Michael et al. [20], based on the formulation of Godunov and Romenskii [25]. Plasticity effects are incorporated following the work of Miller and Collela [26].
Since an Eulerian framework is used, the deformation of the solid materials cannot be described through mesh distortion. Instead this behaviour is accounted for through consideration of the deformation gradient tensor, given by
| (4) |
This allows mapping back to the original configuration, with coordinates given by to the deformed configuration, . The technique of Rice [27] is followed, in which the plastic deformation is considered separately, , which means the total deformation can be decomposed into plastic and elastic components, . The evolution of the solid materials is described by a hyperbolic system of conservation laws,
| (5) |
| (6) |
| (7) |
| (8) |
where is the stress tensor and is the scalar material history parameter which tracks work hardening of the material through plastic deformation. The density is related to the deformation gradient through
| (9) |
and the stress tensor is given by
| (10) |
where is the specific internal energy. In order to close the system, an analytic constitutive model relates the specific internal energy to the deformation gradient, entropy and material history parameter, i.e. .
The effects of the current density passing through the solid substrate can be modelled through a Joule heating term in the energy conservation law (6). As with the plasma, the electric field is assumed static in the substrate, and the relevant equations (2) and (3) apply here too.
2.3 The multimaterial approach
In this work ghost fluid methods are used, in combination with level set methods, to model the interfaces between the plasma arc, or air, and the substrate and electrode. Level set methods track the evolution of the interfaces, as they evolve over time, e.g. substrate bending under the impact loading of the plasma arc. In order to provide boundary conditions at these interfaces, the Riemann ghost fluid method is used, which solves mixed material Riemann problems to give interface states during evolution of the governing equations.
Level set methods represent the interface between a pair of materials as a signed distance function, , with the zero contour of this function being the physical location of that interface. It is assumed that there is no mass transfer between materials, and this gives an advective law for evolving the level set function,
| (12) |
where is the material velocity. This equation is evolved using a third order Hamilton-Jacobi WENO reconstruction scheme [28]. Under a non-uniform velocity field, the level set function will not remain a signed distance function without reinitialisation. Each material within the model is assigned a level set function, and a fast marching algorithm to preserve the signed distance function around the contour is used. The physical material for a given point can then be determined through identifying the single positive level set function.
The Riemann ghost fluid method, developed by Sambasivan and Udaykumar, [29], provides dynamic boundary conditions at the material interfaces, based on the original method of Fedkiw et al. [30]. To provide these conditions, following procedure is used for each material, ,
-
1.
For a cell , if and an adjacent cell , it is adjacent to the interface, the closest interfacial location is given by
-
2.
Two probes are projected into the two adjacent materials, to the points and
-
3.
States and are interpolated for each of these points from the surrounding cells
-
4.
A mixed material Riemann problem is solved to obtain the star state
-
5.
The material state in cell is replaced by
In this procedure, it is assumed, without loss of generality, that the state is the material that exists for . It is noted that once the states and are found vector quantities, and must be projected into components normal and tangential to the interface. Once all interfacial cells have been assigned a boundary value, a fast marching method is used to fill the region such that the stencil of the numerical method is always satisfied. The mixed-material Riemann problems are based on linearised solutions to the systems of equations, and are described in [20].
The electrodynamic quantities, current density and magnetic field, are assumed to be continuous across material boundaries, and thermal effects due to temperature differences in the substrate materials and the plasma arc are not modelled. The governing equations (2) and (3) are solved across the entire domain for all materials, rather than on a per-material basis.
3 Validation
Experimental validation studies for lightning strike plasma arc interaction face difficulties in capturing the arc development due to the likelihood of damage to electronic equipment from the strong current which generates the arc. By recording features of the arc at a sufficient distance can overcome these difficulties, for example, Martins [13] uses light emission from the arc, whilst Villa, Malgesini and Barbieri [11] use pressure gauges away from the arc. We can use these results to validate the current approach, and henceforth these two models shall be referred to as M16 and VMB11 respectively.
3.1 Validation of the MHD equations
The work in VMB11 allows the MHD equations (1) to be validated under a given current density profile. In Figure 3, the VMB11 configuration is shown, in which a cylindrical electrode is used to generate a plasma arc, which connects to a flat metal sheet grounded at its outer edges. Tubes are mounted to this sheet in three locations, and a pressure-recording transducer is placed at the end of these tubes. As the expanding plasma arc travels over these tubes, it generates a pressure wave which travels down the tubes, and is recorded by the transducer.
To simulate this experiment, cylindrical symmetry is used, and the electrode is placed 5 cm above a reflective boundary. The current flow through from the electrode was recorded to follow an oscillatory profile
| (13) |
Here, is the maximum current reached by the system, measured to be A, is the damping factor and is the damped frequency. These are related to the properties of the electrical circuit used to generate this current,
| (14) |
where is the undamped frequency, is the resistance, the inductance and the capacitance. These last three properties are measured as m, H and F respectively.
For this validation test, the approach of VMB11 is used and a pre-determined current density profile is provided,
| (15) |
Experimentally, the radius of the plasma arc was measured to be
between 1.5 and 2.5 cm; a constant radius cm is taken in
this work. This allows the present implementation of the MHD
formulation to be validated in isolation.
The set-up in Figure 3 is modelled as a two-dimensional cylindrical test, considering the substrate and the electrode to be purely reflective boundaries for the material properties of the plasma. The current density profile given by equation (15) is applied between the electrode and the substrate.
In Figure 4, the temperature profile is shown after 48 s, with the expansion of the arc, and the central high-temperature region clearly visible. The overall shape, especially of the reflection around the electrode, is consistent with the VMB11 results, though differences in the temperatures profile are seen, which are likely to be due to differences in the initialisation, and the numerical techniques used (both for gridding and for evolution), between the models.
In order to model the pressure wave on the transducers, the technique used in VMB11 is followed, which treats this as a separate problem to the overall evolution of the plasma arc. This avoids the need to resolve the comparatively thin tubes within the simulation domain, and preserves cylindrical symmetry. The flow down these tubes is simulated through a solution of the one-dimensional Euler equations, modified to account for frictional effects of the tube edges. These equations are
| (16) | ||||
| (17) | ||||
| (18) |
where is the friction coefficient and cm is the diameter of the tube. The boundary conditions at the top of the tube are specified by the properties of the plasma arc, and thus vary with time. These are given by
| (19) | ||||
where is the inlet pressure loss coefficient [31]. There is not substantial flow of plasma into the tube, hence this system of equations can be solved using a standard ideal gas, with .
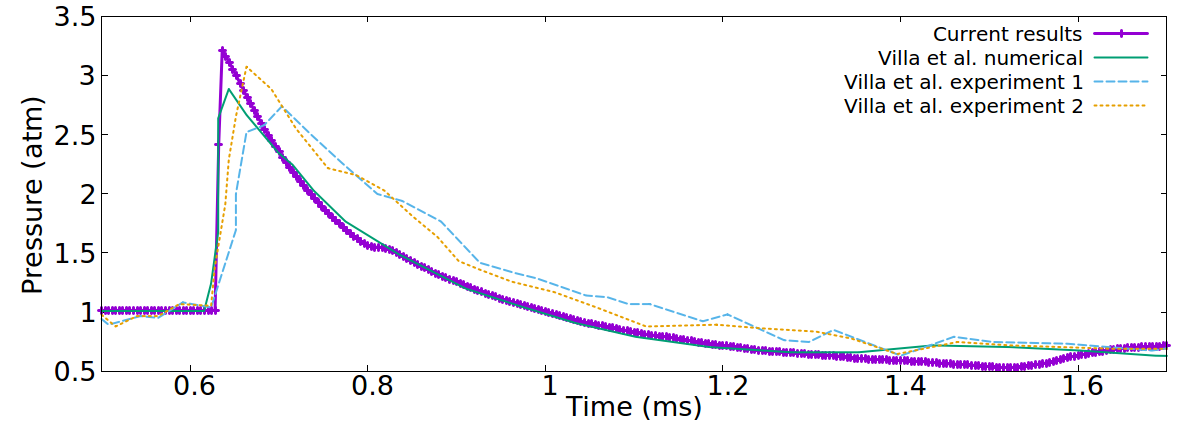
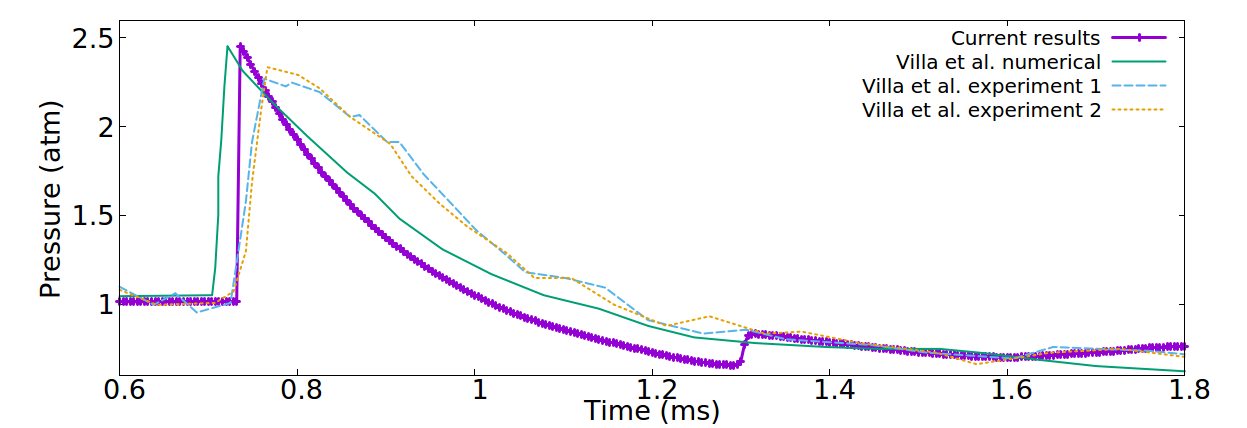
In Figure 5, the results are shown for the pressure wave travelling down the three tube mounted 5, 10 and 15 cm from the arc attachment. The present results are compared to both the VMB11 experimental and numerical results, with good comparison to both. The pressure peak is captured well, as is the rate of decay of the wave, which levels out slightly below atmospheric pressure. The simulation results typically give a slight overestimation of the pressure, due to the one-dimensional assumption used to model the tubes. As a result, any dissipation of the wave, due to interaction with the tube walls is lost.
The results shown in this section validate the present numerical implementation of the equations governing plasma dynamics. In particular, they show that the correct behaviour of the outwards moving shock wave is correctly captured.
3.2 Validation of the fully coupled system
When an elastoplastic substrate is incorporated, assumptions as to the shape of the current density profile can no longer be made. In this case, equation (2) is solved for current density across the entire domain. When solving the complete coupled system, the interaction with the substrate affects the evolution of the plasma arc. In order to validate the present model in this case, the results are compared to the experimental data of M16. Through high-speed imaging of the arc attachment and early evolution up to around 40 s, both the width of the plasma arc, and the progression of the shock wave generated by the arc formation, could be measured.
In order to validate the present implementation, two substrate configurations are considered, aluminium and an isotropic approximation to a carbon composite material (hereafter referred to as the isotropic composite). The electrical conductivity of these two materials differs substantially, aluminium has S/m whilst the carbon composite the isotropic material is based on has i S/m [12]. Experimental results show that for a material with lower conductivity material area is larger. This is due to the electrical conductivity of this material being comparable to that of the plasma, hence the extended arc connection offers a less resistive path for the current flow.
The initial data for this model uses the set-up described in Figure 2, which incorporates the electrode for current input within the domain. The initial data for this problem uses a pre-heated arc region at the centre of the domain of 8,000 K with a 2 mm diameter. For these tests, either a 1 mm (for comparison of an aluminium substrate to M16) or 2 mm (elsewhere) thick substrate is considered, located 40mm below the electrode. A direct current application through the electrode following a D-component waveform is used, as defined in the document ARP 5412B [4]. A polynomial fit is used to the current profile recorded by M16.
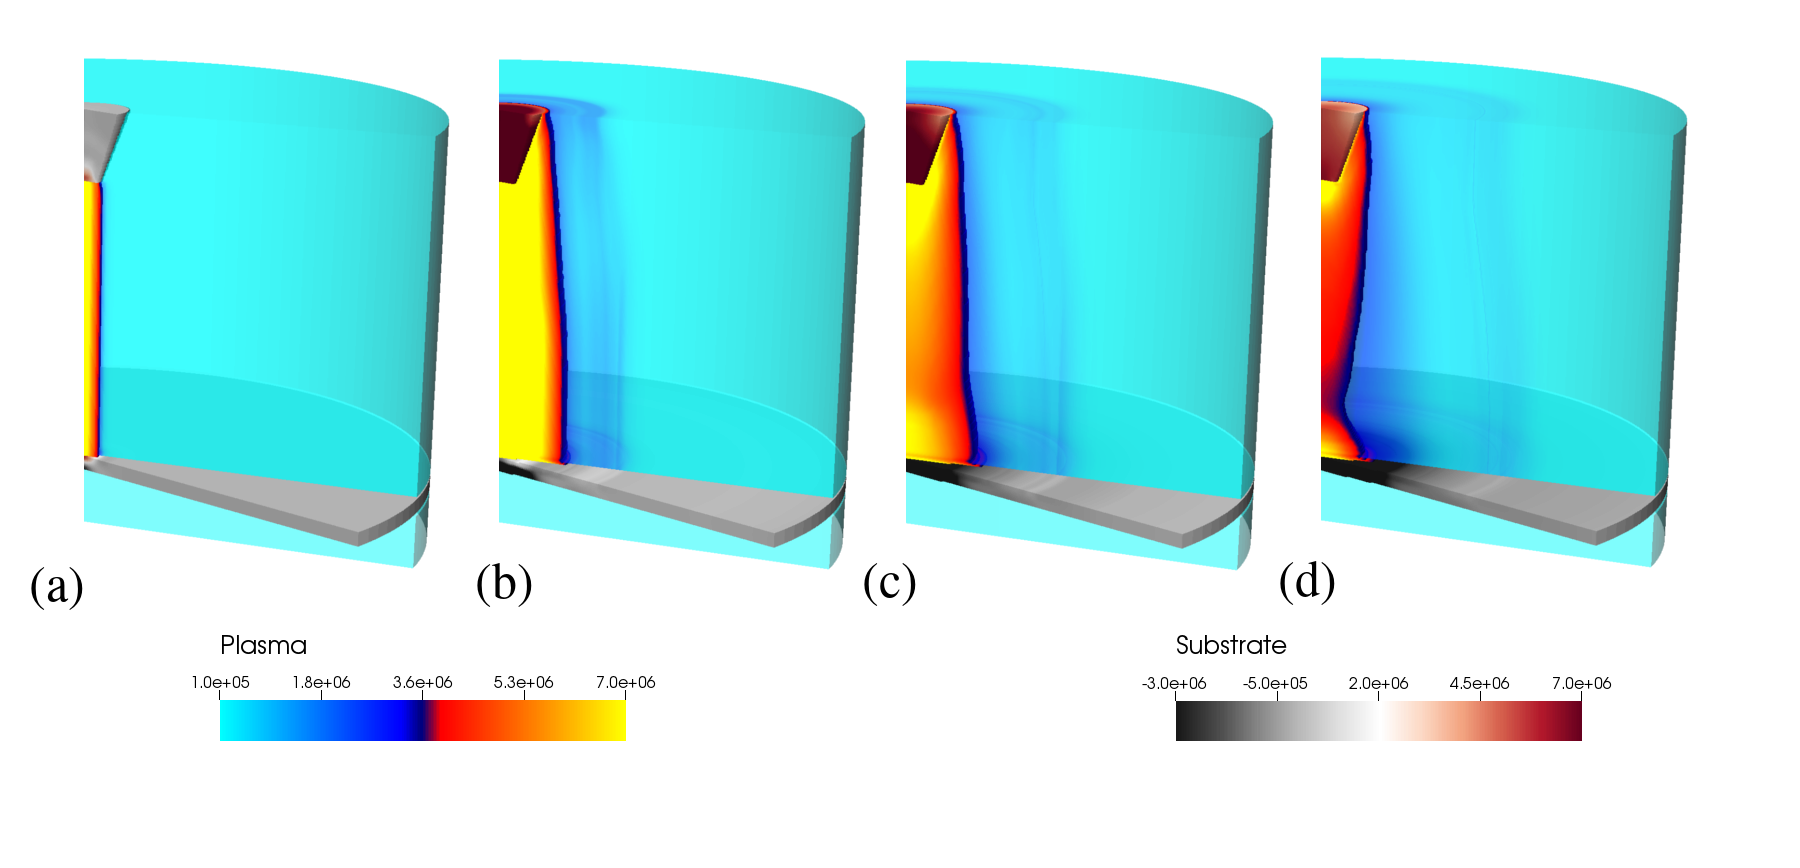
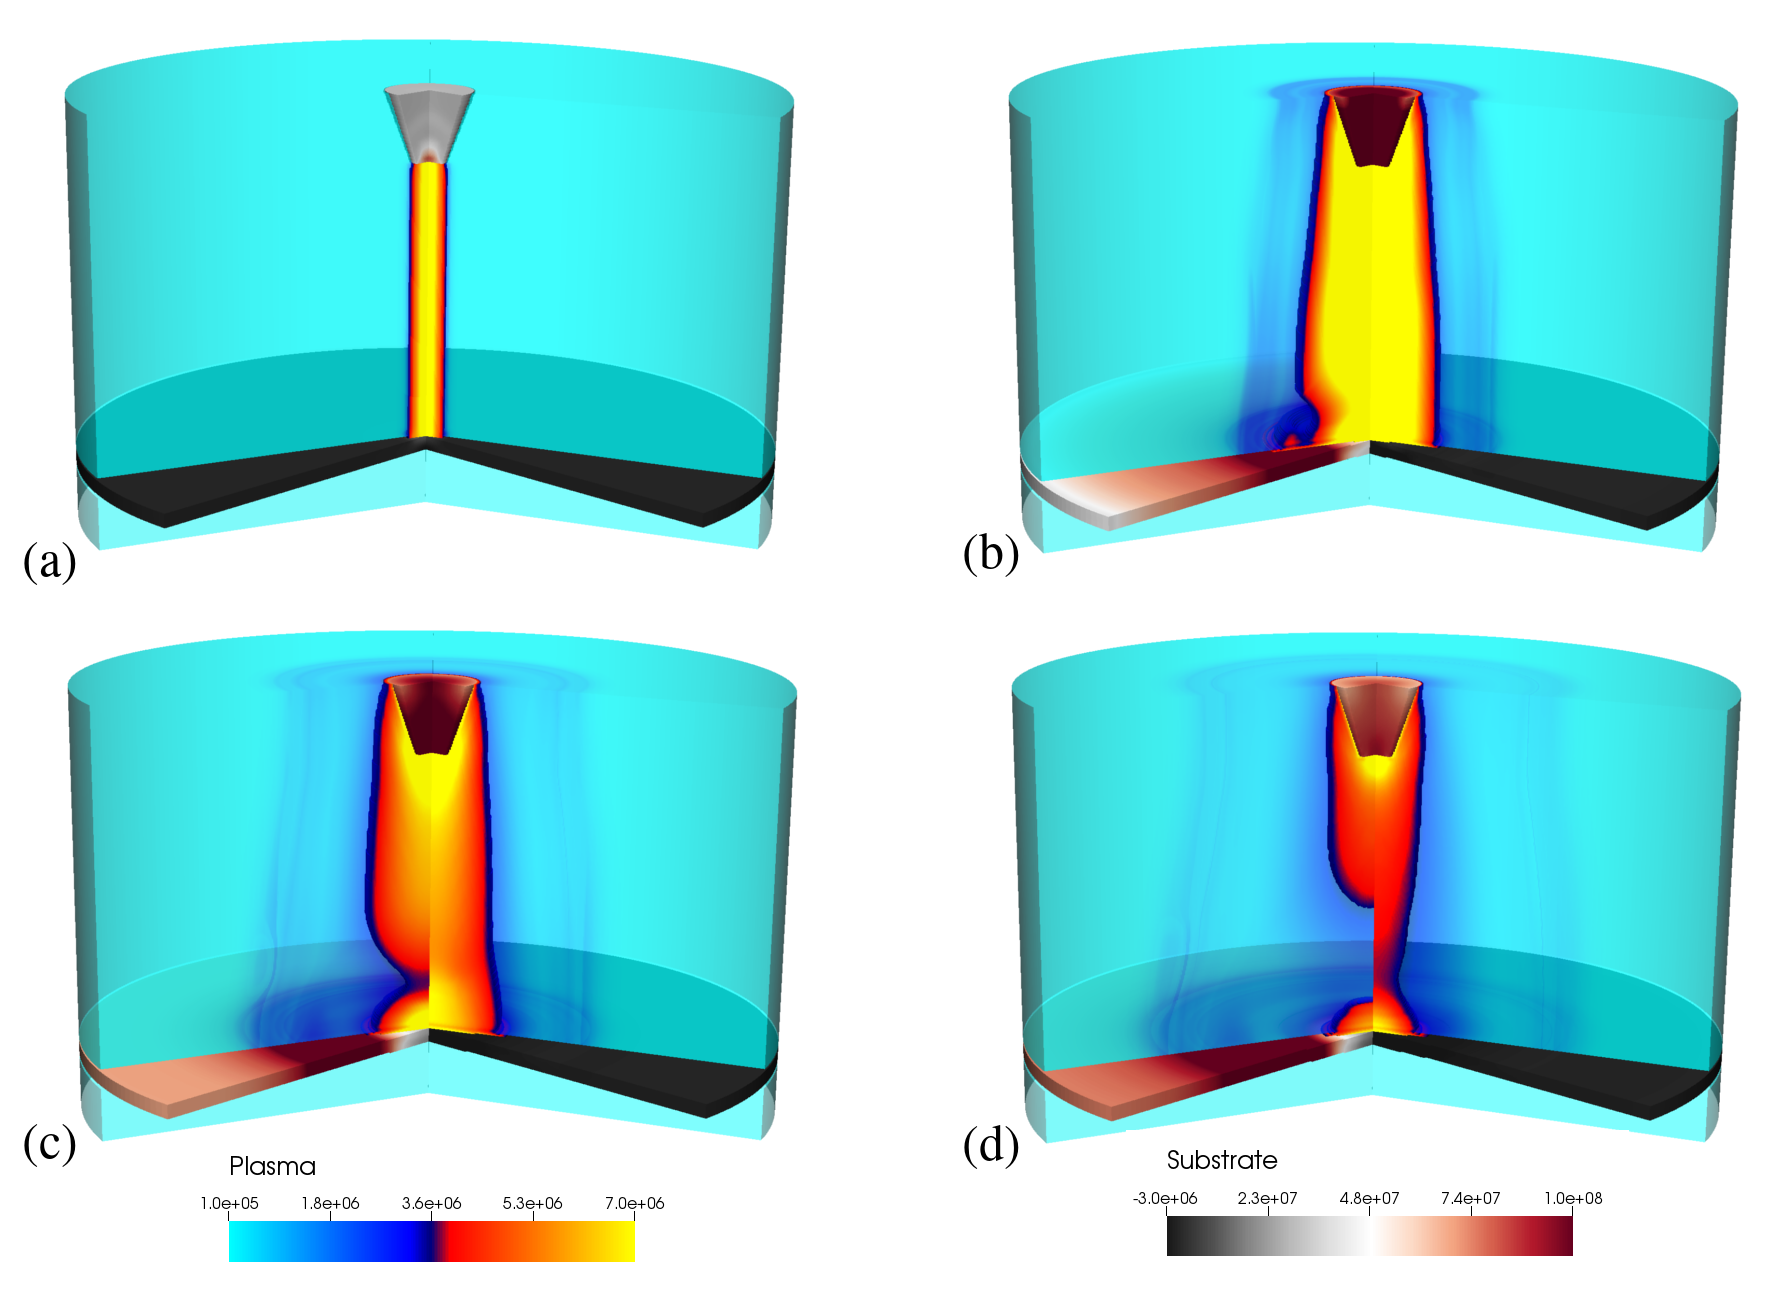
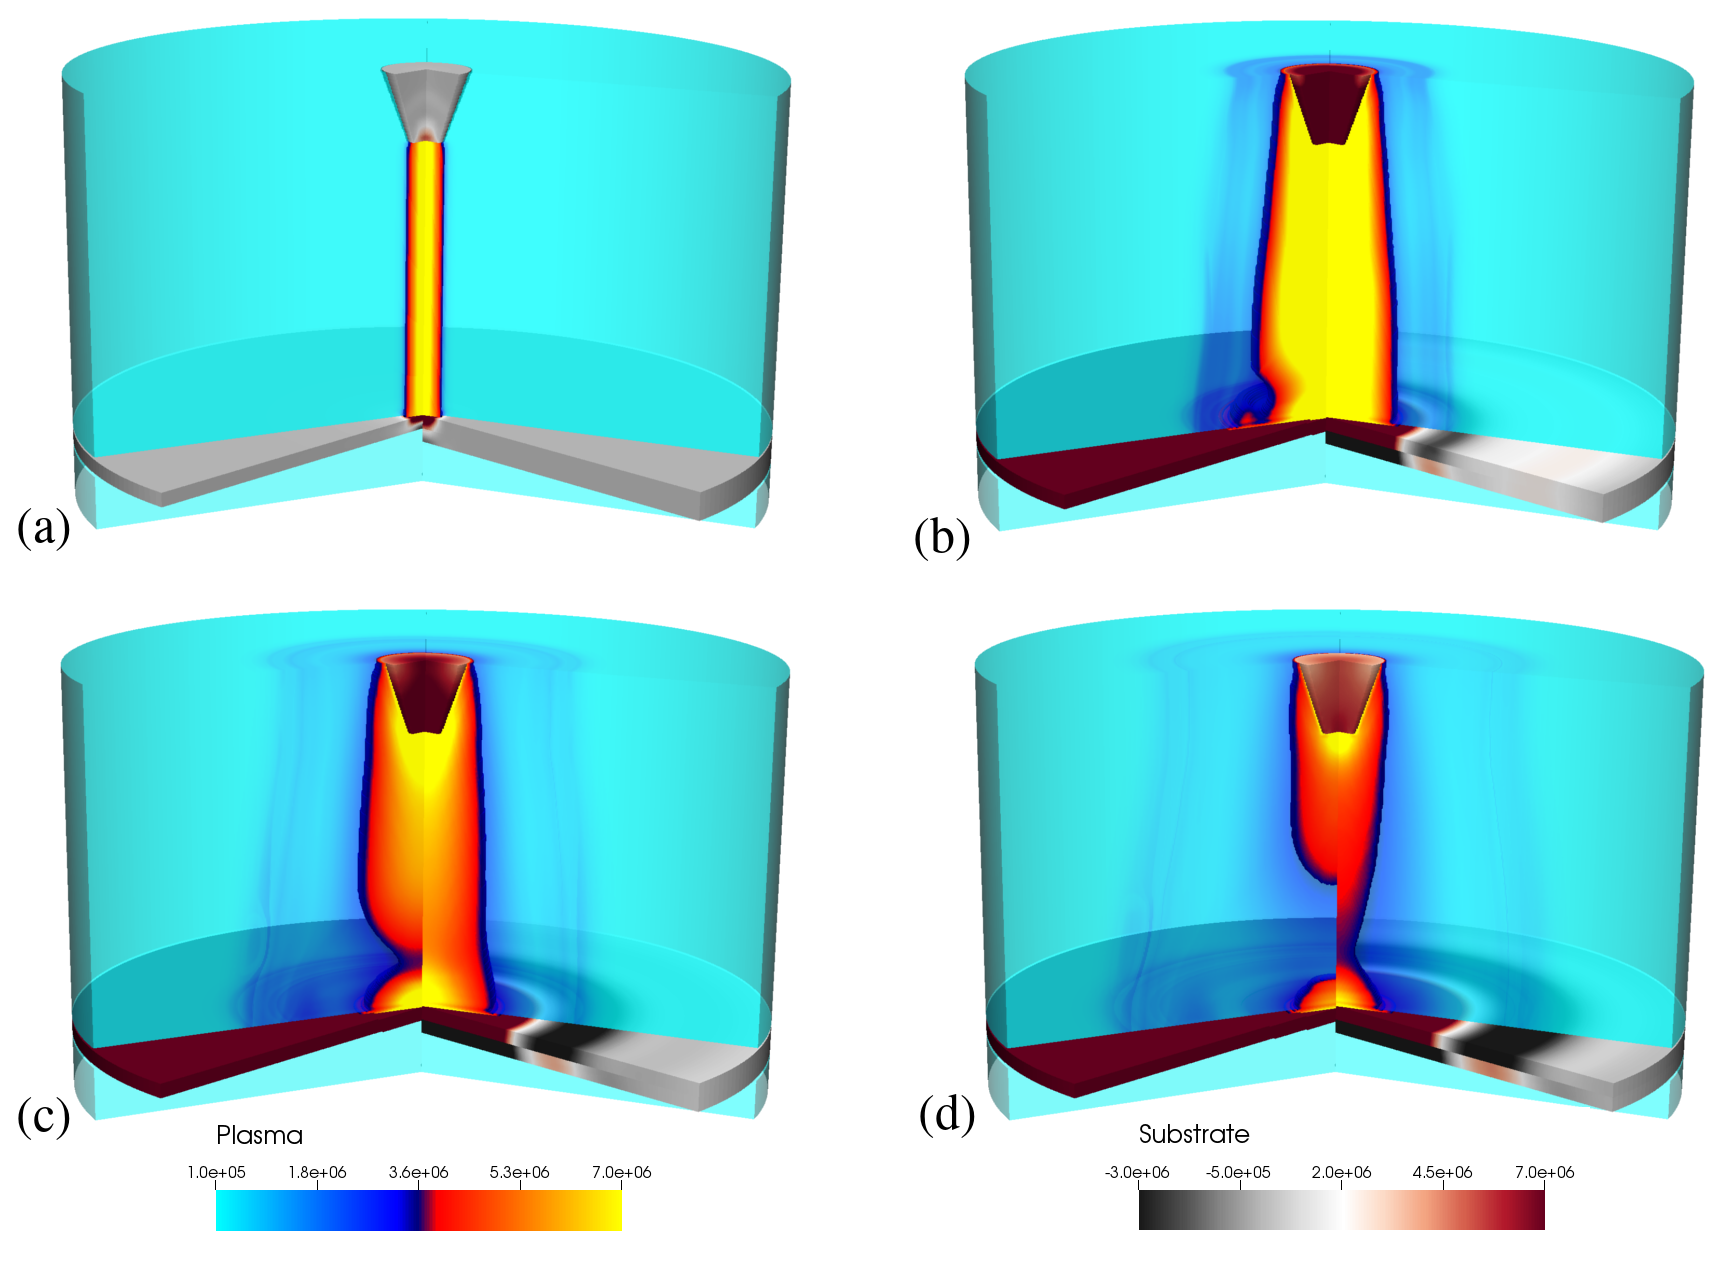
Figure 6 shows the evolution of the pressure profile in the arc and a 2 mm thick aluminium substrate. After 1s, Figure 6 (a), a pressure loading is evident on the aluminium substrate. Although the current input is still reasonably low at this early time, there is sufficient energy input such that the pressure at the centre of the arc has doubled from the initial pre-heated value. As the arc evolves over time, Figure 6 (b-d), the highest pressure remains in the centre of the arc, with the majority of the pressure loading on the substrate occurring here. Away from the centre of the arc, the higher pressure associated with the initial shock wave moving radially away from the centre of the arc is also visible as a darker blue region in the plasma. A corresponding wave moves through the substrate as the shock wave imparts a loading effect, though this is substantially lower than at the centre of the arc. Whilst the pressure within the plasma arc must strictly stay positive, it is noted that within the substrate, negative values are experienced. This is because pressure is a component of the stress tensor, and a solid material can sustain tension, as a result of rarefaction waves. When considering overall damage effects, the magnitude of the stress within the substrate is an important criterion.
The effect of the dynamic current density profile is clearly visible; the arc in Figure 6 does not maintain a cylindrical shape. Current density gradient in the -direction leads to a higher pressure directly beneath the arc, but also at the attachment point, where high pressures, due to reflected material, are seen.
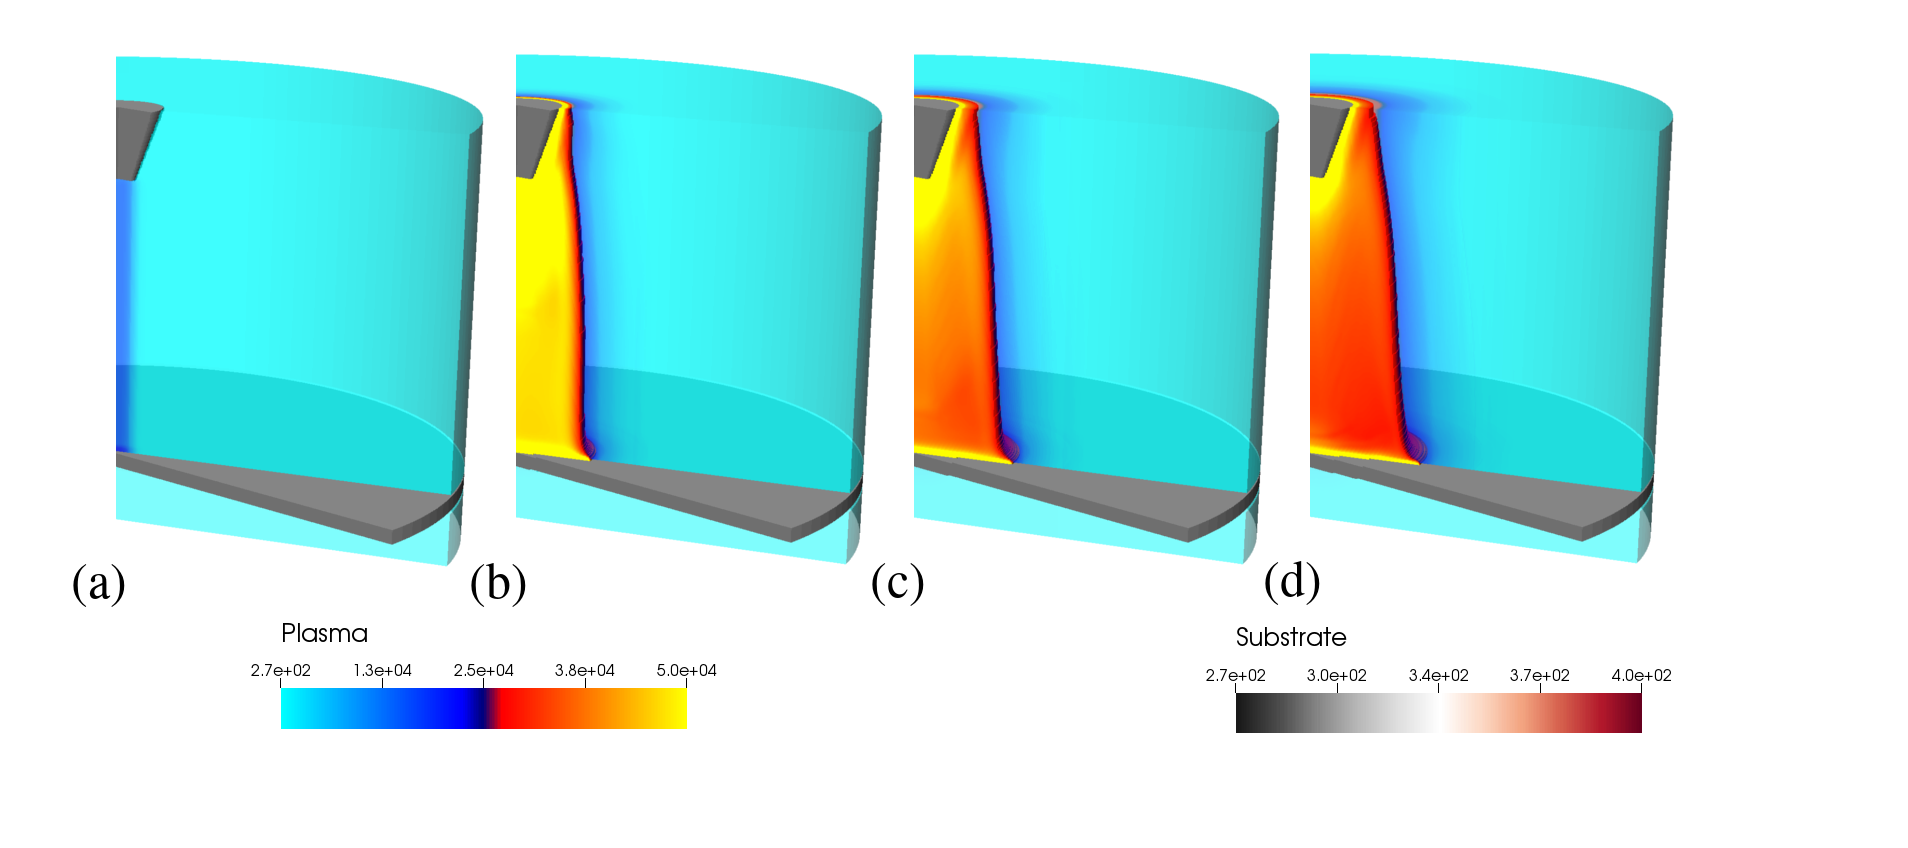
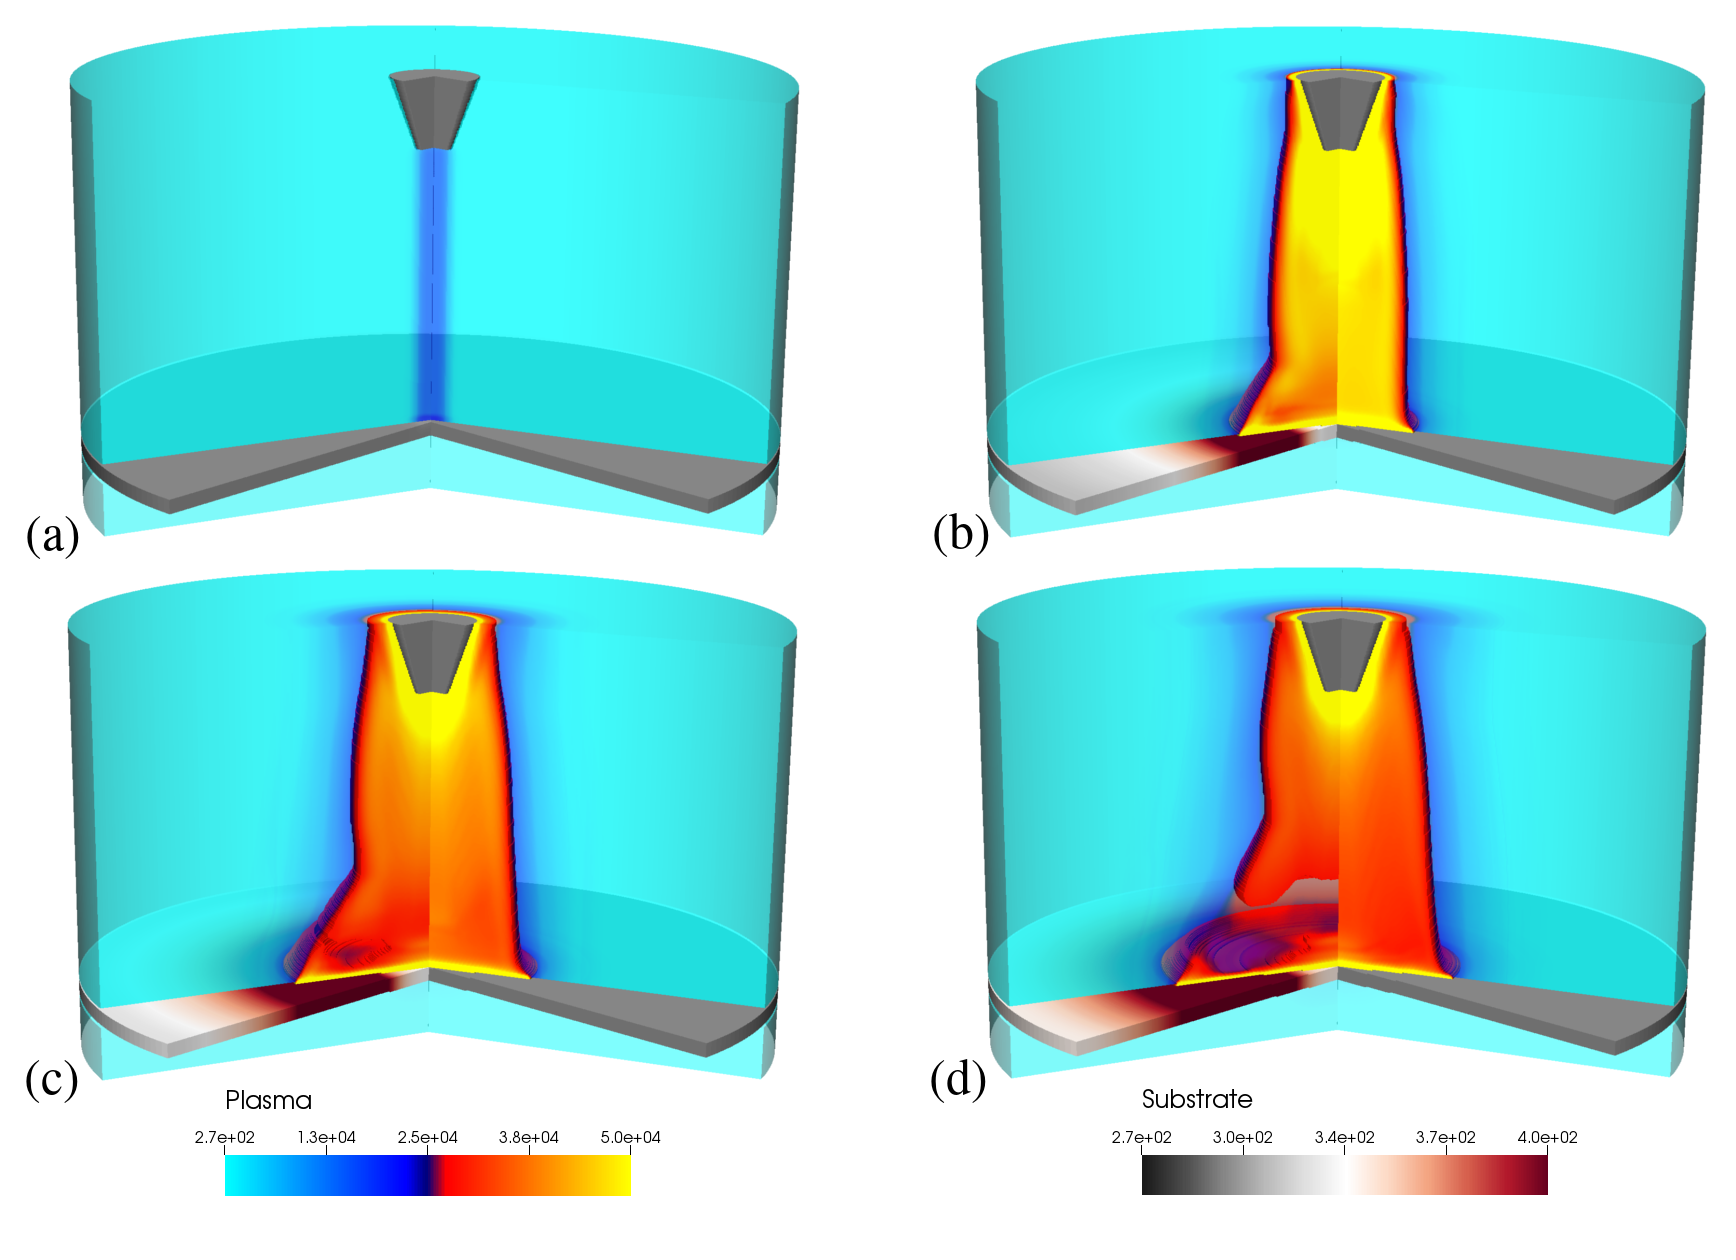
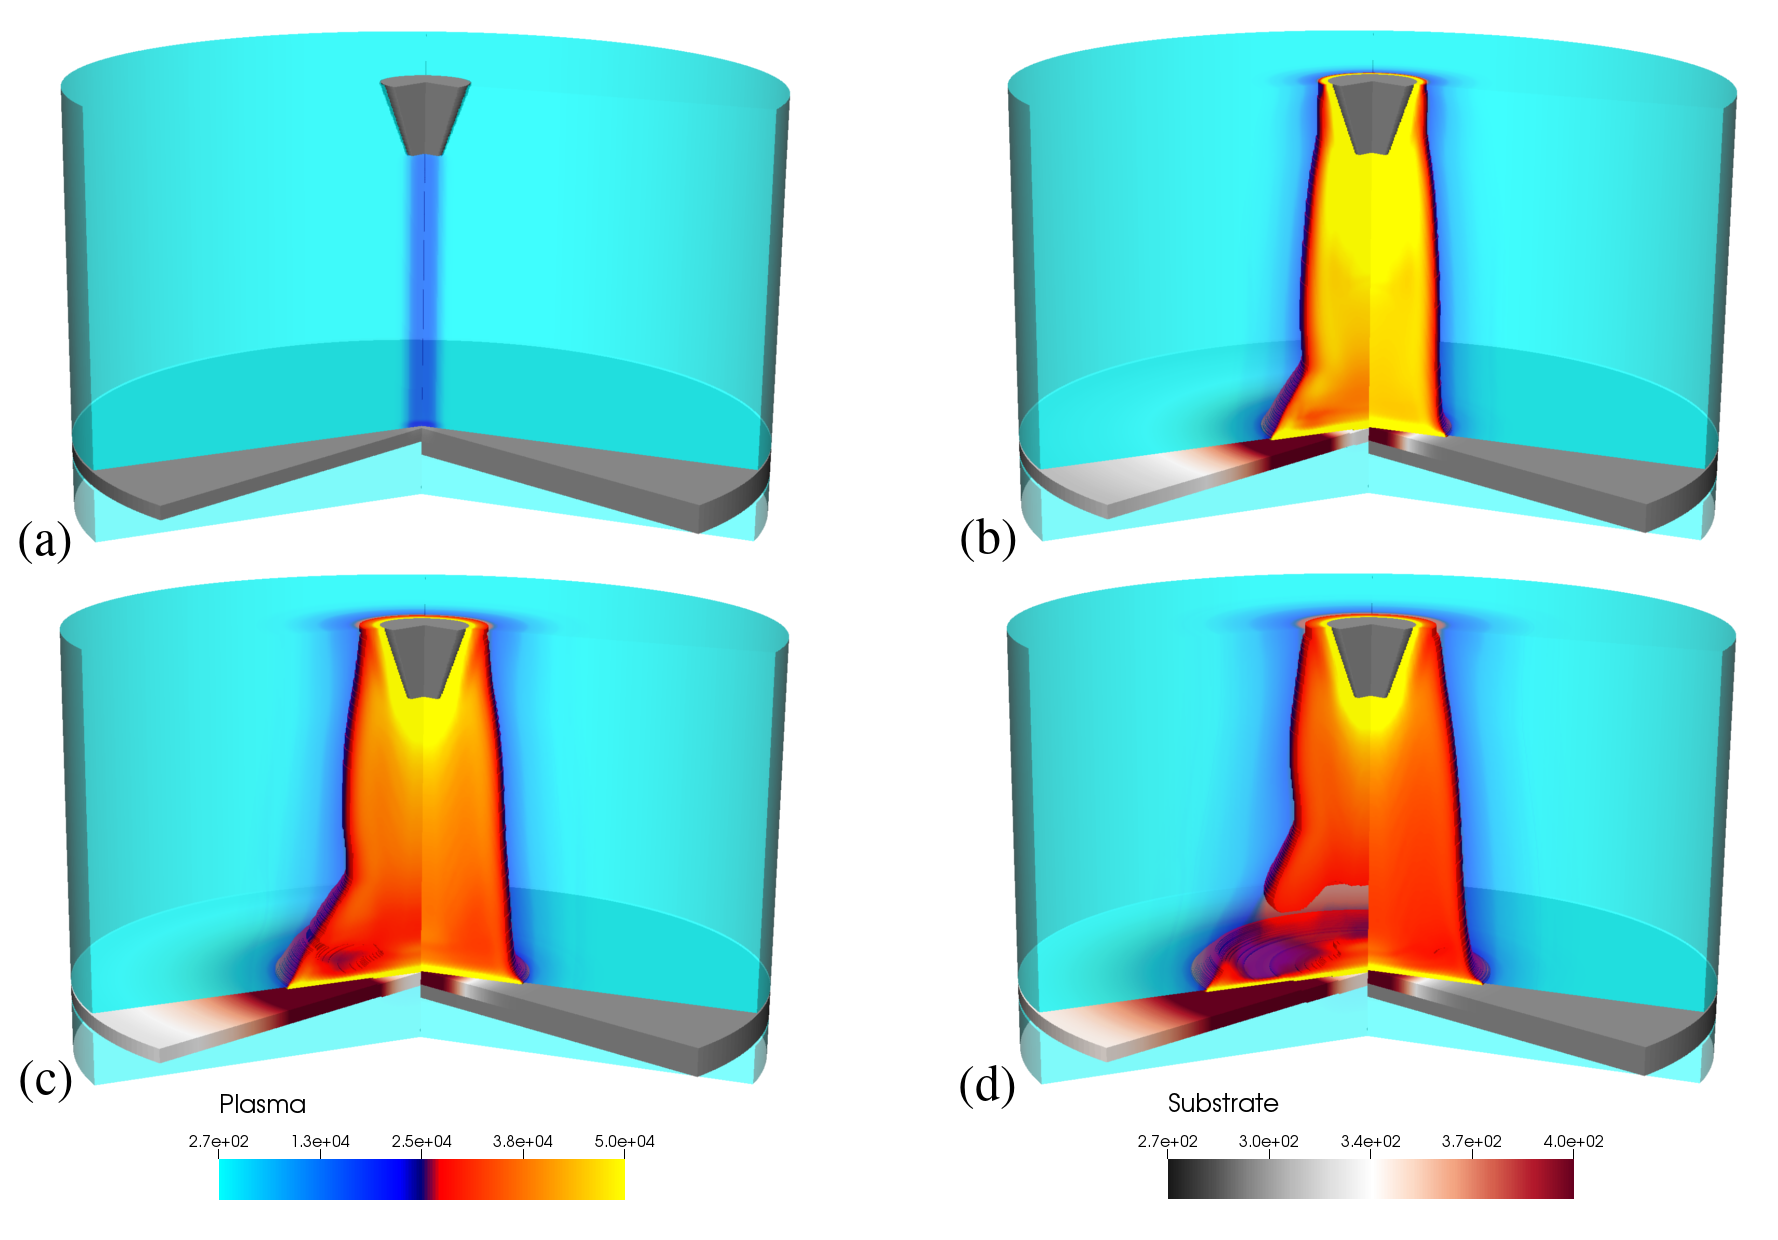
The temperature in the plasma and aluminium substrate as the arc evolves is shown in Figure 7 (a-d), at corresponding times to the pressure images in Figure 6. The hottest temperature regions remain in the centre of the domain, where conductivity, and thus Joule heating, is greatest. The temperature is also plotted in the substrate, however, due to the high conductivity of the aluminium substrate in this test, the energy density deposited in the substrate is comparatively low at this timescale. The overall rise in temperature over the timescales considered is less than 1 K. Over longer timescales ( s), temperature rise would be governed by diffusive and conductive behaviour, in addition to longer term Joule heating effects from the long continuous current, and this leads to the minor damage resulting from lightning strike.
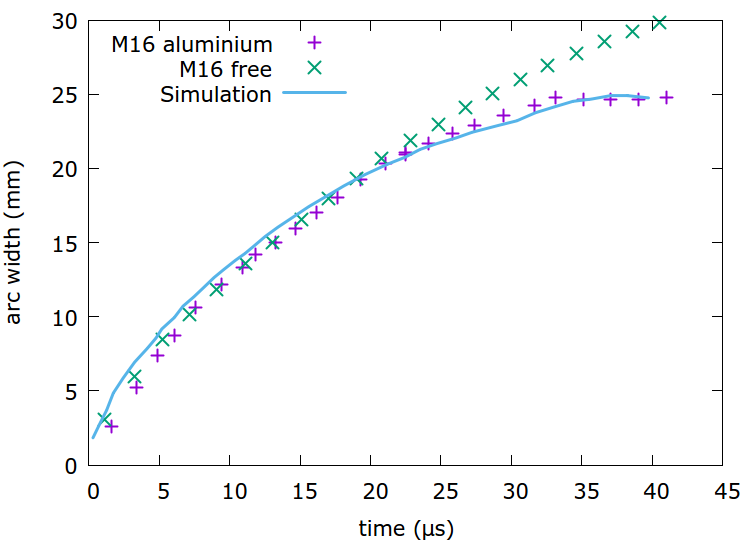
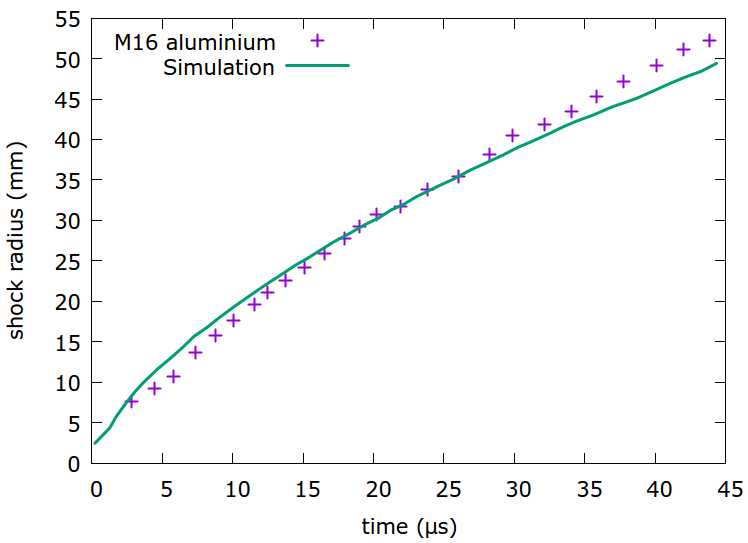
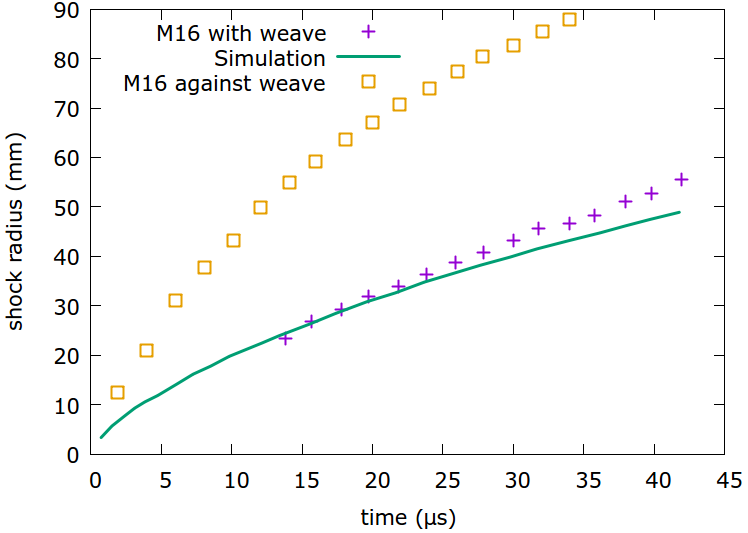
These results qualitatively compare well with the images obtained in M16. By taking measurements of the arc width and the shock progression, a quantitative comparison to the experimental results can be made. In the left half of Figure 8, the present numerical results are compared to M16 for arc attachment to a 1 mm thick sheet of aluminium. The numerical results match the experimentally measured widths, demonstrating the interaction with the substrate can be correctly captured. This is further evident since the width of an arc between two electrodes with no substrate present (sometimes referred to as a free arc) is plotted. There is significant difference in the evolution of the widths of the free arc compared to when a substrate is present after around 20 s, which is correctly captured by the present model.
The M16 experiment was also able to capture the evolution of the shock
wave generated by the plasma arc through optical changes in a
patterned background. In the right half of Figure 8 the
present numerical results for the propagation of the shock wave are
compared, and again we find good agreement between the present model
and experimental studies.
Arc attachment to the isotropic composite substrate is now considered and results are compared directly to the results shown for an aluminium substrate. The full modelling of a carbon composite material requires an anisotropic description of the alignment of the fibres comprising the substrate to be incorporated within the equation of state. This is currently beyond the capabilities of the present model, though by making an isotropic approximation to a composite material, the effect the substrate conductivity has on the arc can be considered. This isotropic model is approximately equivalent to a description of the composite material in the direction of the fibres.
The comparison between a low-conductivity substrate and aluminium are presented with both results shown on the same plot, the isotropic composite substrate plotted at the left of the central axis, and the aluminium substrate on the right. In order to visualise the differences between the simulation, the same plot ranges are always used for both materials.
In Figure 9 the evolution of the pressure for attachment to the isotropic composite substrate is shown. There are clear differences between the evolution profiles, both within the arc and the substrate, compared to attachment to aluminium. Within the arc, the behaviour local to the electrode is largely unchanged, it is clear that the differences originate due to the interaction with the substrate. In Figure 9, there is a high-pressure region close to the surface of the substrate, which then has ‘pinch’ type behaviour directly above it. This serves to exacerbate the gradient in pressure down the arc, visible in Figures 9 (c-d). Additionally, in Figure 9 (c), it is clear that the change in behaviour at the substrate surface leads to a faster shock-propagation speed, though at the top of the domain, the shock speed remains similar to the case of an aluminium substrate. Within the substrate, the pressure loading is substantially higher. This is a result of greater energy deposition in the substrate through the Joule effect in equation (6). This is further evidenced by the location of the low pressure region in the substrate beneath the arc. This region is substantially larger than that beneath the arc attachment to aluminium, and in fact, exists even where pressure loading is highest. This suggests that there are additional effects contributing to the pressure increase within the substrate, subsequent plots show that the high pressure region is correlated to high current density, and hence Joule heating.
The differences in the pressure loading of the aluminium and isotropic composite substrates are shown in the temperature field over the same time period in Figure 10. As the plasma arc develops, the radius of the plasma arc close to the top surface of the substrate is greater than that of the aluminium. Where the arc radius is large, a lower temperature region is seen, particularly on the outer edges of the arc. Such a region is visible in the optical emission results of Tholin et al. suggesting the correct coupling is captured between the isotropic composite substrate and the arc. The optical emission is closely coupled to conductivity, which is itself dependent on temperature, thus a comparison can be made between these two results.
The temperature within the substrate is also plotted, and it is clear
that there is a noticeable increase for the isotropic composite
material. Due to the energy deposition through the Joule heating
effect, there is a corresponding rise in temperature. It is clear
that there is in an increase associated with the leading edge of the
arc.
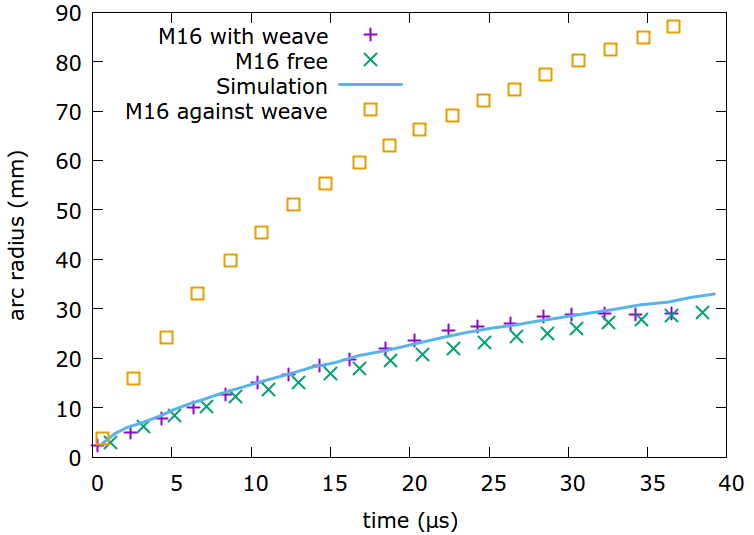
As with the arc attachment to aluminium, the M16 experimental results can be used to further validate this model. In Figure 11 the arc width obtained from both experiment and simulation is compared. There are two experimental values for arc width plotted, one in the direction aligned to the carbon weave, and one perpendicular to it. It is clear that the isotropic approximation captures the behaviour aligned to the weave well (this is the preferential direction for current to travel). Again the arc width of the free arc is plotted, and it is now clear that there is significant differences in the arc width for this low-conductivity case and the aluminium attachment shown in Figure 8.
In the right half of Figure 11 the expansion of the shock wave for the experiment and simulation is compared. As for the arc width, two experimental values are obtained, depending on the orientation of the recording equipment to the carbon weave. As before, the current isotropic model of a low-conductivity substrate is found to correspond well to the behaviour in the direction of the carbon weave.
4 Multi-layered substrates
The multimaterial nature of the present model allows for the plasma arc to interact with materials that are not necessarily on the surface of the substrate. In this section, a test case which investigates the effects of layering materials with different electrical conductivities is considered. This is constructed such that an isotropic composite substrate is placed on top of a sheet of aluminium. By placing the high-conductivity substrate as the bottom layer in this scenario, the effects of an embedded layer used within current carbon composite materials is considered; it is expected that this layer can form a preferential path for the current flow.
Each layer has a thickness of 2 mm, giving a total substrate thickness of 4 mm. To initialise the plasma, a pre-heated region directly connecting the electrode to the substrate is again included. In order to ascertain the effects of the dual layered substrate, the results are compared to that of a single-layer isotropic composite substrate. Therefore, if the results are governed only by the top material, it would be expected that there is no difference visible between these two cases.
Figure 12 shows the pressure evolution within the plasma and the substrate, compared to the situation where there is just isotropic composite present. The pressure profile in both plasma and substrate are clearly effected by the presence of the dual layering. The plasma arc does not show the ‘pinch’ feature, and subsequent expansion close to the surface, when the aluminium layer is included. The overall shape follows that of the single aluminium substrate shown in Figure 6. It is clear that this change in behaviour is also true for the expansion of the shock wave above the dual layered substrate. Additionally, the high pressure loading on the dual substrate is now confined to the area directly beneath the electrode. There is still a higher pressure within the isotropic composite substrate than for a single aluminium sheet, but the extent is confined to only a small region.
The reduction in the radial extent of the high pressure region as a result of adding an aluminium layer shown in Figure 12 may be expected to yield a reduction in substrate heating. Figure 13 shows the temperature evolution corresponding to this pressure behaviour. As expected, the temperature profile follows the general trend of the pressure profile with the high temperature region being significantly reduced in radial extent through the introduction of the aluminium layer. Once again, the shape of the temperature profile is comparable to the single aluminium layer, shown in Figure 7. As the pressure profile suggests, there is a high temperature in the dual layered substrate restricted to the initial arc attachment point. Away from this, there is no substantial increase in the temperature of the substrate, a clear contrast to the single isotropic composite substrate case. The reduction in temperature in the substrate is a consequence of less energy being deposited in this layer due to Joule heating, which suggests that the current flow is predominantly through the aluminium layer to the ground site, instead of through the low conductivity layer.
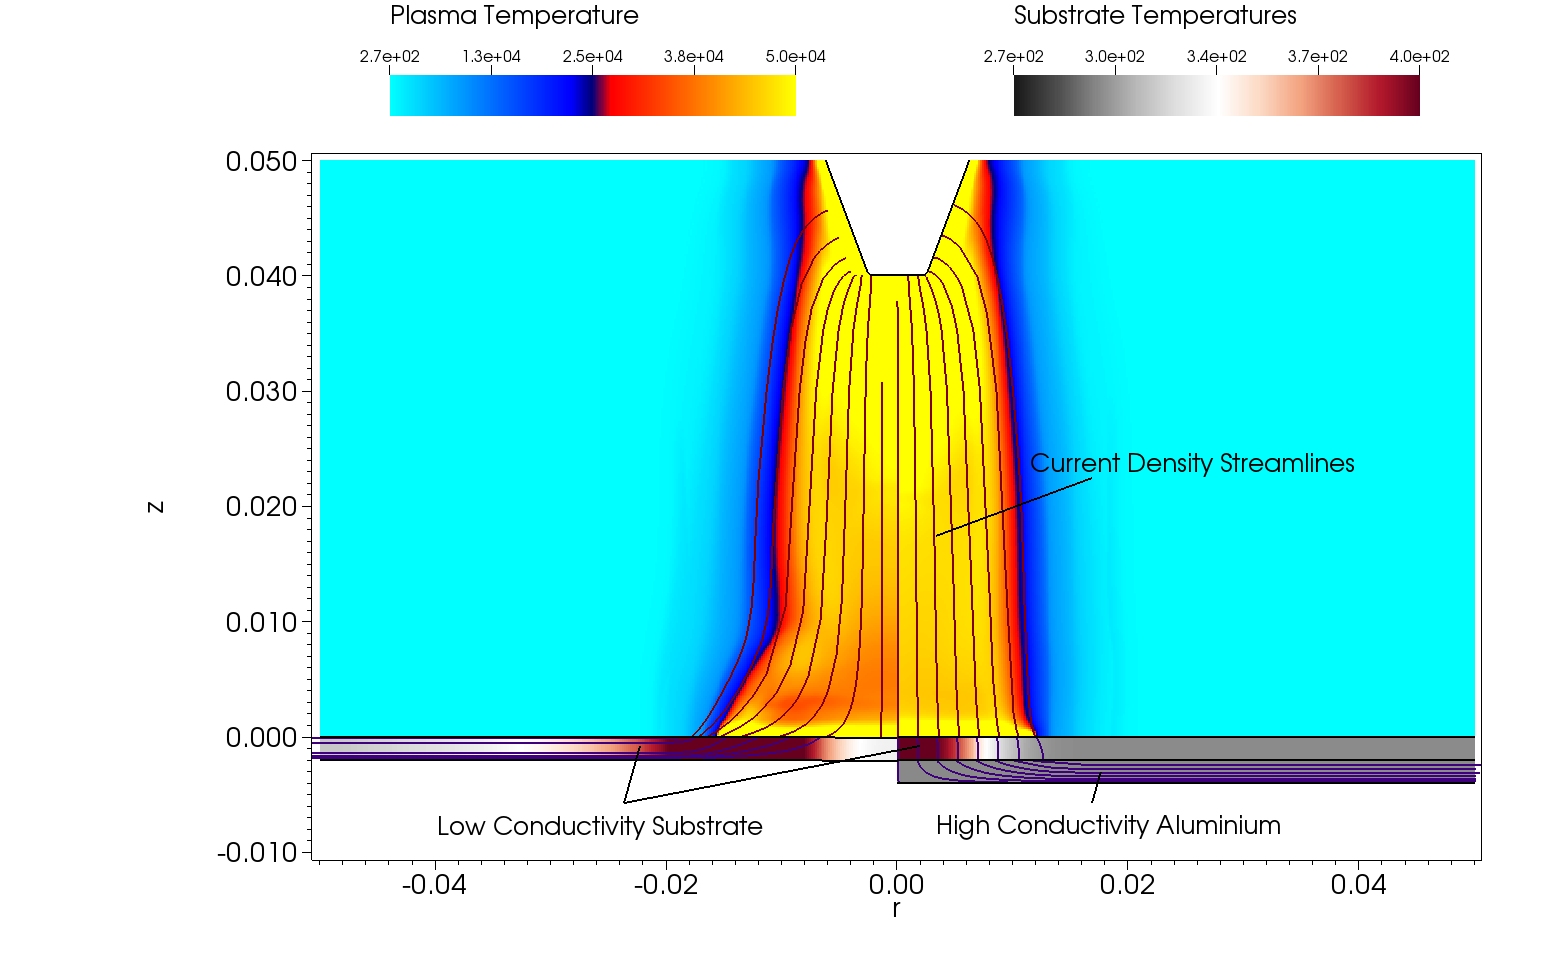
In Figure 14 the current density streamlines at s are shown, i.e. at the same time as Figure 13 (b). These are plotted over temperature field, to show the path of the current, and how other variables are follow this behaviour closely. For the isotropic composite substrate, there is a clear radial component to the streamlines within the plasma as they approach the substrate. As expected, in this case, they then attach directly to the ground site. When the aluminium layer is included, the difference in path for the streamlines is clear. They now flow much more directly into the aluminium substrate. It is at this point they turn radially towards the ground site, and remain within the aluminium layer. This explains the similarities between the results for a single aluminium substrate in Figures 6 and 7 and the dual layered results presented in this section.
The results in this section demonstrate that the model presented is capable of accurately coupling the interaction of a plasma arc with a complex arrangement of substrate layers. The complete properties of these layers will govern the behaviour of the arc attachment, and not just the properties of the top layer.
5 Temperature-dependent conductivity
The fully coupled nature of the present model means that behaviour within the substrate can alter the shape of the arc. This is most obvious when the energy input into the substrate alters the electrical conductivity of the material. For high-conductivity substrates such as aluminium, these effects are negligible over the timescales considered, since there is very little change in the temperature of the substrate. However, the significant energy deposition into a low-conductivity substrate is sufficient to alter the material properties, such as electrical conductivity, over a short timescale. It would then be expected that this will alter the interaction of the arc with the substrate, demonstrating a true two-way non-linear coupling.
A test case is considered in which a temperature-dependent electrical conductivity for a carbon composite material is taken from Guo et al. [32], and applied to the isotropic composite used in this work. The conductivity of the material decreases close to linearly with increased temperature, hence a line is fit through the experimental data according to
| (20) |
where S m-1 K-1. The reference conductivity for this material is S m-1, and thus two test cases are considered; firstly where the conductivity within the substrate is constant at the value , and secondly where it obeys equation (20).
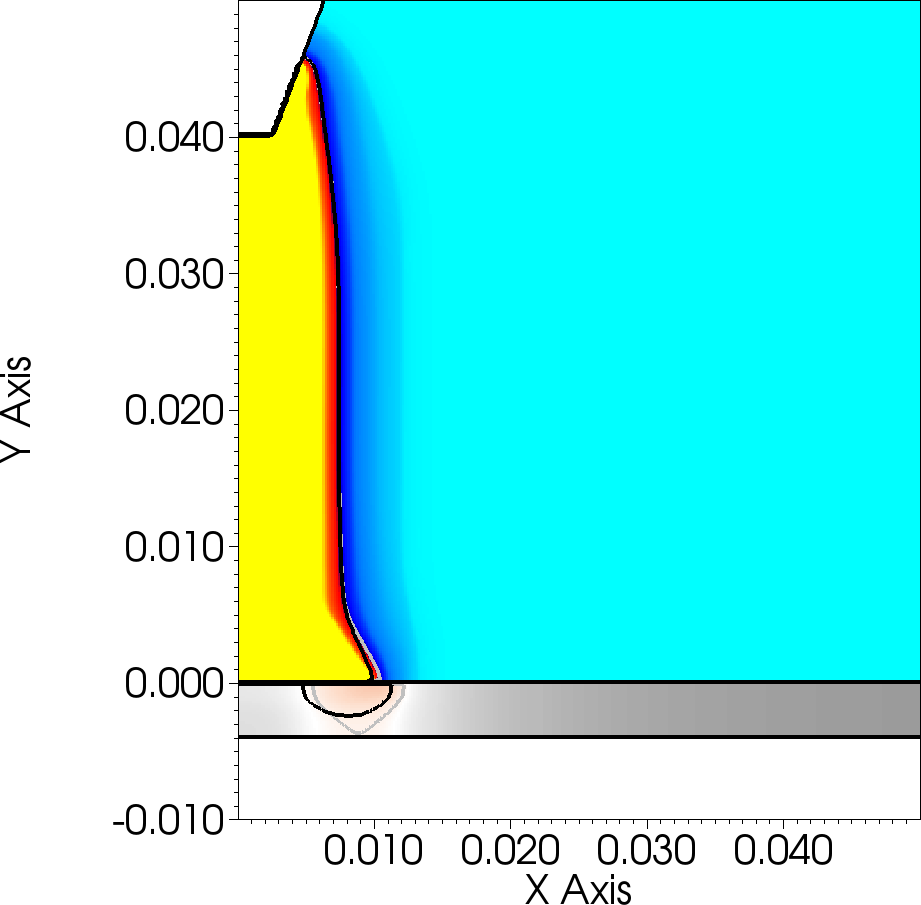
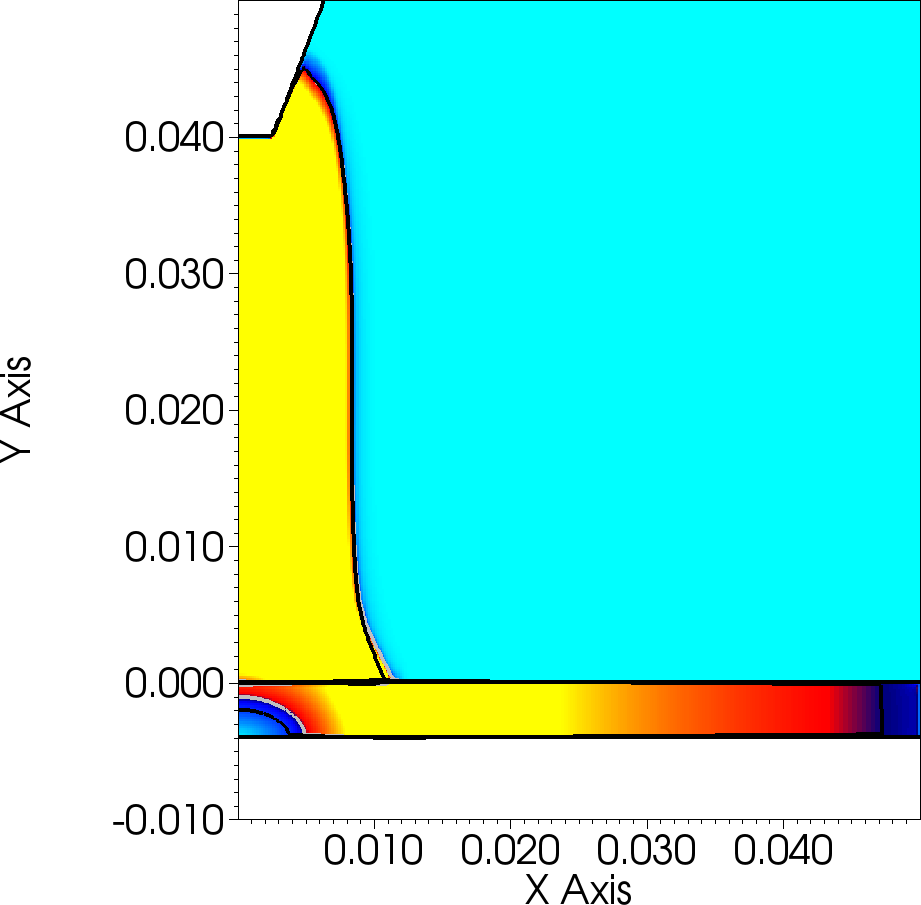
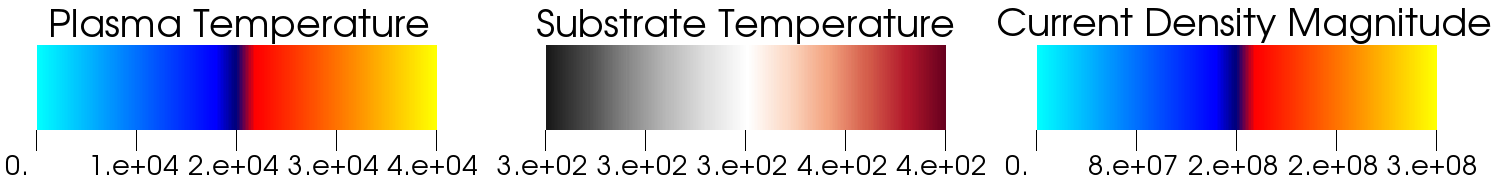
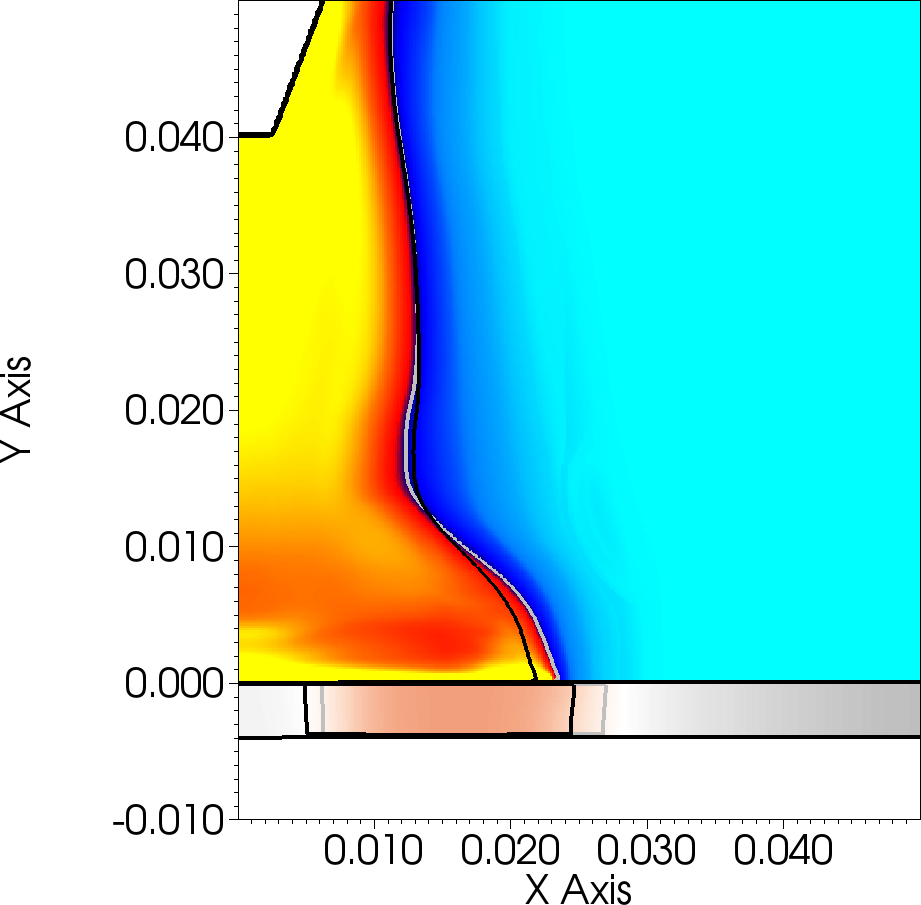
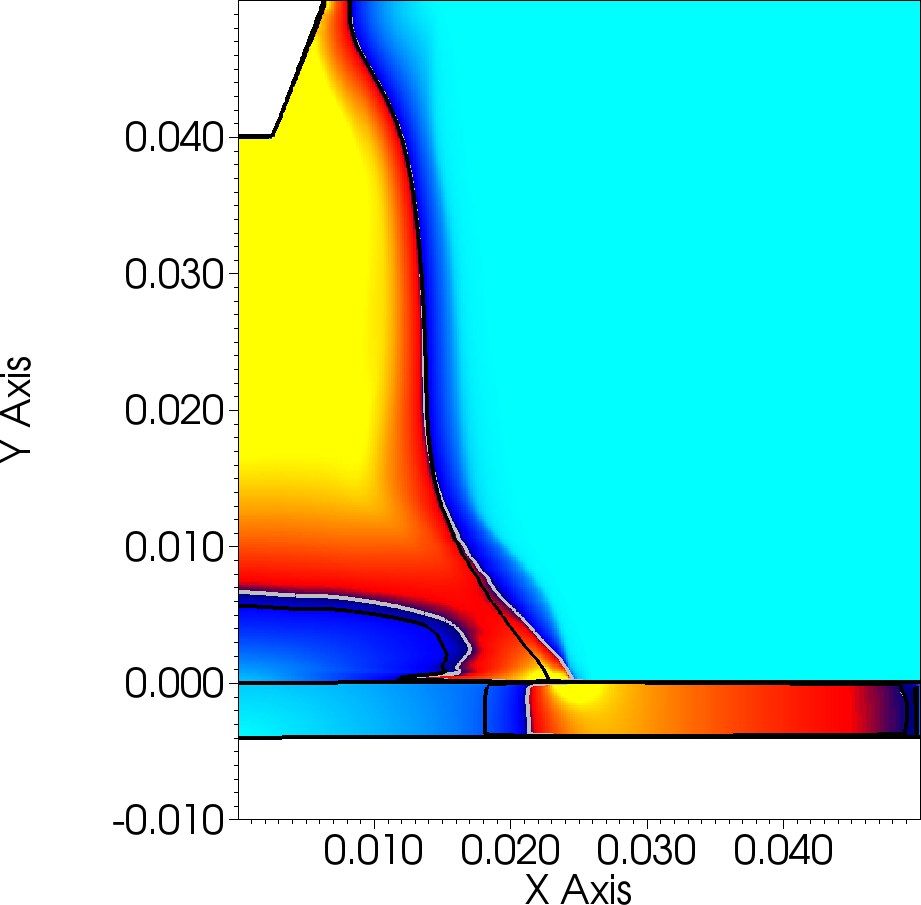

The effects of the temperature-dependent conductivity are shown after 5.4 s in Figure 15, and after 15 s in Figure 16. These plots show the effect of the temperature-dependent substrate properties, both on the temperature and current density magnitude profiles. For each figure, two contours are plotted, one for the constant conductivity model, and one for the temperature dependent conductivity. Both contours are plotted at the same value; K for temperature in the plasma arc, 340 K for the substrate and A/m-2 for the current density in both materials.
In Figure 15, the current input to the system is close to its peak value. At this stage, there is little difference in the arc profile, its evolution is being governed primarily by this current input. It is, however, slightly wider where it attaches to the substrate. The effects within the substrate itself are more noticeable, both in temperature and current density. The contour at 340 K is deeper in the case of a varying substrate conductivity, and the primary path of the current through the substrate is clearly radially further outwards. In Figure 16, the difference between the two cases are now clear in the plasma arc, as well as the substrate. The increase in width of the arc attachment is more pronounced, and this leads to a decrease in width, seen in the temperature profile midway between the substrate and the electrode. The extended path of the current through the arc, causing this greater attachment area, is visible in the current density magnitude. Within the substrate, the heated region is both wider, and radially further out. Additionally, the maximum temperature in this region is higher in the case of variable conductivity. The current density profile in the substrate again shows a greater radial distance of the attachment.
These results demonstrate successful simulation of the feedback between the plasma arc and the substrate. The Joule heating effect imparting energy into the substrate alters its properties, and hence the optimal path for current to take. As a result, the shape of the plasma arc is changed, in this case moving further outwards. In this particular case, including the temperature dependent properties of the substrate could show that greater damage occurs to the substrate than would otherwise be predicted, due to the larger area of effect, and the greater temperatures reached within the substrate.
6 Conclusions
In this work a methodology is presented for the simulation of the non-linear interaction between a plasma arc and an elastoplastic substrate. Within this model, each material (plasma, substrate(s), electrode and air) is modelled with its own set of PDEs, all of which are written in the same hyperbolic form. These are solved simultaneously, rather than by means of a coupled, ‘co-simulation’ approach. By using level set methods and the ghost fluid method, dynamic boundary conditions are provided between each material through the solution of mixed-material Riemann problems. This allows the entire system to be simulated on a single computational grid, and capture the non-linear interactions between the materials present. To the best of the authors’ knowledge, this is the first time the ability to capture the dynamic feedback of evolution within the substrate affecting the plasma arc has been demonstrated.
This approach is validated through comparison to experimental studies, where it is demonstrated that the present model can capture the correct growth of a plasma arc dependent on the composition of the substrate. The electrical conductivity of the substrate should alter the width of a plasma arc, with a lower conductivity leading to a wider attachment area; it was demonstrated that this behaviour could be replicated on aluminium, and on a low-conductivity isotropic approximation to a carbon composite. Additionally it was possible to validate the location of the shock wave generated by the arc attachment against experimental studies.
The capability of the model to deal with a substrate comprising two distinct materials was then evaluated, which is representative of the layered approached used in modern aircraft design. A trial case was considered with a layer of aluminium mounted beneath a layer of the isotropic composite substrate. In this case, it was shown that the present model could capture the current flow through the low conductivity material into the aluminium, and thus restrict the growth of the plasma arc. In practical applications, the present model would be able to capture the properties of a high-conductivity mesh, diverting current flow from a substrate primarily composed of a low-conductivity material such as CFRP.
In order to demonstrate the full non-linear behaviour of the present model, a test case where the evolution of the substrate had a feedback effect on the plasma arc was considered. A temperature-varying electrical conductivity was taken from experimental work on CFRP. In this case, as the substrate temperature increased, the electrical conductivity decreased. This study indicated that lowering the substrate conductivity caused the plasma arc to expand, local to the substrate, as would be expected for the optimal current path. Additionally, the change in electrical conductivity of the substrate lead to greater heating through the Joule effect. This two-way dynamic feedback between the arc and the substrate can be used to better identify where damage to a substrate configuration may occur.
Future development using this multi-physics framework will focus on the development of the equation of state used within the plasma arc and air, and on techniques to improve the radiative source term within the arc in a computationally efficient manner. The substrate model shall also be developed further, considering the effects of a dielectric layers such as paint, which inhibit the growth of the plasma arc, and additionally the conductive behaviour of the substrate will be altered to better model CFRP.
Acknowledgements
The authors acknowledge the funding support of Boeing Research & Technology (BR&T) through project number SSOW-BRT-L0516-0569. We would also like to thank Micah Goldade of BR&T for technical input throughout the work, and Carmen Guerra-Garcia (BR&T and currently at the Massachusetts Institute of Technology) for suggestions on how best to model behaviours of a plasma.
References
- [1] D. Morgan, C. Hardwick, S. Haigh, A. Meakins, The interaction of lightning with aircraft and the challenges of lightning testing, Aerospace Lab Journal 5 (5) (2012) 1–10.
- [2] J. A. Segui, Boeing simulates thermal expansion in composites with expanded metal foil for lightning protection of aircraft structures, COMSOL News-The Multiphysics Simulation Magazine (2014) 4–7.
- [3] P. Lalande, A. Bondiou-Clergerie, P. Laroche, Analysis of available in-flight measurements of lightning strikes to aircraft, in: SAE Technical Paper, SAE International, 1999. doi:10.4271/1999-01-2397.
- [4] ARP SAE, Aircraft Lightning Environment and Related Test Waveforms (Jan 2013). doi:https://doi.org/10.4271/ARP5412B.
- [5] ARP SAE, Aircraft Lightning Test Methods (jan 2013). doi:https://doi.org/10.4271/ARP5416A.
- [6] K. C. Hsu, K. Etemadi, E. Pfender, Study of the free-burning high-intensity argon arc, Journal of Applied Physics 54 (1983) 1293–1301. doi:10.1063/1.332195.
- [7] A. Gleizes, J. J. Gonzalez, P. Freton, Thermal plasma modelling, Journal of Physics D: Applied Physics 38 (9) (2005) R153–R183. doi:10.1088/0022-3727/38/9/r01.
- [8] L. Chemartin, P. Lalande, E. Montreuil, C. Delalondre, B. Chéron, F. Lago, Three dimensional simulation of a dc free burning arc. application to lightning physics, Atmospheric Research 91 (2) (2009) 371 – 380, 13th International Conference on Atmospheric Electricity. doi:https://doi.org/10.1016/j.atmosres.2008.07.009.
- [9] L. Chemartin, P. Lalande, C. Delalondre, B. Cheron, F. Lago, Modelling and simulation of unsteady dc electric arcs and their interactions with electrodes, Journal of Physics D Applied Physics 44 (19) (2011) 194003. doi:10.1088/0022-3727/44/19/194003.
- [10] L. Chemartin, P. Lalande, B. Peyrou, A. Chazottes, P. Elias, C. Delalondre, B. Cheron, F. Lago, Direct effects of lightning on aircraft structure: analysis of the thermal, electrical and mechanical constraints, AerospaceLab (5) (2012) p–1.
- [11] A. Villa, R. Malgesini, L. Barbieri, A multiscale technique for the validation of a numerical code for predicting the pressure field induced by a high-power spark, Journal of Physics D: Applied Physics 44 (16) (2011) 165201. doi:10.1088/0022-3727/44/16/165201.
- [12] F. Tholin, L. Chemartin, P. Lalande, Numerical investigation of the interaction of a lightning and an aeronautic skin during the pulsed arc phase, IET Conference Proceedings (2015) 39 (6 .)–39 (6 .)(1)doi:https://doi.org/10.1049/ic.2015.0186.
- [13] R. S. Martins, Étude expérimentale et théorique d’un arc de foudre et son interaction avec un matériau aéronautique, Ph.D. thesis, Université Paris-Saclay (2016).
- [14] T. Ogasawara, Y. Hirano, A. Yoshimura, Coupled thermal–electrical analysis for carbon fiber/epoxy composites exposed to simulated lightning current, Composites Part A: Applied Science and Manufacturing 41 (8) (2010) 973–981. doi:10.1016/j.compositesa.2010.04.001.
- [15] G. Abdelal, A. Murphy, Nonlinear numerical modelling of lightning strike effect on composite panels with temperature dependent material properties, Composite Structures 109 (2014) 268 – 278. doi:https://doi.org/10.1016/j.compstruct.2013.11.007.
- [16] Y. Guo, Q. Dong, J. Chen, X. Yao, X. Yi, Y. Jia, Comparison between temperature and pyrolysis dependent models to evaluate the lightning strike damage of carbon fiber composite laminates, Composites Part A: Applied Science and Manufacturing 97 (2017) 10 – 18. doi:https://doi.org/10.1016/j.compositesa.2017.02.022.
- [17] P. Foster, G. Abdelal, A. Murphy, Modelling of mechanical failure due to constrained thermal expansion at the lightning arc attachment point in carbon fibre epoxy composite material, Engineering Failure Analysis 94 (2018) 364 – 378. doi:https://doi.org/10.1016/j.engfailanal.2018.08.003.
- [18] C. Karch, R. Honke, J. Steinwandel, K. Dittrich, Contributions of lightning current pulses to mechanical damage of cfrp structures, IET Conference Proceedings (2015) 2 (8 .)–2 (8 .)(1)doi:https://doi.org/10.1049/ic.2015.0149.
- [19] S. Schoch, K. Nordin-Bates, N. Nikiforakis, An eulerian algorithm for coupled simulations of elastoplastic-solids and condensed-phase explosives, Journal of Computational Physics 252 (0) (2013) 163 – 194. doi:http://dx.doi.org/10.1016/j.jcp.2013.06.020.
- [20] L. Michael, N. Nikiforakis, A multi-physics methodology for the simulation of reactive flow and elastoplastic structural response, Journal of Computational Physics 367 (2018) 1 – 27. doi:https://doi.org/10.1016/j.jcp.2018.03.037.
- [21] A. Larsson, P. Lalande, A. Bondiou-Clergerie, P. Lalande, A. Delannoy, The lightning swept stroke along an aircraft in flight. part i: thermodynamic and electric properties of lightning arc channels, Journal of Physics D: Applied Physics 33 (15) (2000) 1866–1875. doi:10.1088/0022-3727/33/15/317.
- [22] Y. Tanaka, T. Michishita, Y. Uesugi, Hydrodynamic chemical non-equilibrium model of a pulsed arc discharge in dry air at atmospheric pressure, Plasma Sources Science and Technology 14 (1) (2005) 134–151. doi:10.1088/0963-0252/14/1/016.
-
[23]
A. D’Angola, G. Colonna, C. Gorse, M. Capitelli,
Thermodynamic and transport
propertiesin equilibrium air plasmas in a wide pressure and temperature
range, The European Physical Journal D 46 (1) (2008) 129–150.
doi:10.1140/epjd/e2007-00305-4.
URL https://doi.org/10.1140/epjd/e2007-00305-4 - [24] Träuble, Multi-physics modelling of solid-plasma interaction, Master’s thesis, University of Cambridge (2018).
- [25] S. K. Godunov, E. I. Romenskii, Nonstationary equations of nonlinear elasticity theory in eulerian coordinates, Journal of Applied Mechanics and Technical Physics 13 (6) (1972) 868–884. doi:10.1007/BF01200547.
- [26] G. Miller, P. Colella, A high-order eulerian godunov method for elastic–plastic flow in solids, Journal of Computational Physics 167 (1) (2001) 131 – 176. doi:https://doi.org/10.1006/jcph.2000.6665.
- [27] J. Rice, Inelastic constitutive relations for solids: An internal-variable theory and its application to metal plasticity, Journal of the Mechanics and Physics of Solids 19 (6) (1971) 433 – 455. doi:https://doi.org/10.1016/0022-5096(71)90010-X.
- [28] S. Osher, R. Fedkiw, Level Set Methods and Dynamic Implicit Surfaces, Vol. 153 of Applied Mathematical Sciences, Springer-Verlag, 2003.
- [29] S. K. Sambasivan, H. S. UdayKumar, Ghost Fluid Method for Strong Shock Interactions Part 1: Fluid-Fluid Interfaces, AIAA Journal 47 (2009) 2907–2922. doi:10.2514/1.43148.
- [30] R. P. Fedkiw, T. Aslam, B. Merriman, S. Osher, A non-oscillatory eulerian approach to interfaces in multimaterial flows (the ghost fluid method), Journal of Computational Physics 152 (2) (1999) 457 – 492. doi:https://doi.org/10.1006/jcph.1999.6236.
- [31] A. Kotowski, H. Szewczyk, W. Cieżak, Entrance loss coefficients in pipe hydraulic systems, Environment Protection Engineering Vol. 37, nr 4 (2011) 105–117.
- [32] Y. Guo, L. Shi, Z. Huang, S. Fu, Research on conductivity temperature dependence of cfrp, in: 2017 IEEE 5th International Symposium on Electromagnetic Compatibility (EMC-Beijing), 2017, pp. 1–3. doi:10.1109/EMC-B.2017.8260383.