Electromagnetic stress on nucleon structure
Abstract
External electromagnetic fields can provoke stress, and thus modifications of the internal structure of nucleons. Working with this hypothesis, one can derive a simple description of the charge dependence of the EMC effect. This first result is confirmed by two explicit models of the structure functions of deformed nucleons in the atomic nucleus. For large nuclei a continuous model is used. For small nuclei a discrete distribution of nuclear matter gives better results.
pacs:
04.60.Gw,03.65.PmI Introduction
Three forces influence the composition, structure, and stability of protons and neutrons (nucleons): The strong force, binding the nucleus together, the weak force, hold responsible for rare weak decays, and the electromagnetic force, typically playing a secondary role. Nucleons contain different types of particles; in particular, quarks carry charges of all three forces, and gluons propagate the strong force only.
For the following discussion, the important fact is that the quarks carry both electrical and color charges. Even though the electrical charges of some quarks repel each other, the nucleon is held together by the dominant forces of the gluon field . However, if one would expose this system for example to an external electric field , the quarks would feel this effect directly, while the gluons would feel it only indirectly, through strong interactions with those quarks.
A difference in responding to external electromagnetic forces will necessarily tend to change the spatial composition and even form of the nucleon. This mechanism will be called and abbreviated as Electro-Magnetic Stress (EMS). An estimate of this EMS effect can be obtained if one considers the interplay between the positive and the negative electrically charged constituents of a nucleon. Those constituents will be polarized in external electromagnetic fields, which is why this effect is known as “hadron polarizability”. The corresponding hadronic dipole moment is
| (1) |
For a review on this topic, see Holstein:2013kia . In experiments at very low and with isolated nucleons, the proportionality factor (not to be confused with the electromagnetic coupling ) has been measured to be of the order of Holstein:2013kia . Between two neighboring protons, this would correspond to a relative deformation of the proton radius of
| (2) |
Please check the appendix for a derivation of this estimate.
In this article, the testability of changes in the nucleon structure caused by external forces like will be explored in the context of the EMC effect. In the following section II, deep inelastic scattering will be discussed and a novel application to the puzzling EMC effect (named after the “European Muon Collaboration”) will be presented. This argument will be consolidated in section III, where the effect is shown to work with an explicit model for nuclear structure functions. Finally, in section V, a summary of the results is given.
II Expected proportionality in deep inelastic scattering
A manifestation of the electromagnetic stress on the nucleon structure can be found in the context of Deep Inelastic Scattering (DIS).
II.1 General discussion
The working hypothesis is that the neutron and proton structure is sensitive to the force produced by external electromagnetic fields in the rest frame. If the structure gets modified in one frame, it will get modified in any other frame as well. The structure functions like , are a weighted sum over the parton content . In the presence of an average external electric and magnetic forces these structure functions will get modified
| (3) |
Here, is the fraction of the nucleon momentum contributed by a parton in a collision. Please note that the parton model itself is defined for a highly boosted light cone frame but the dependence on external electromagnetic fields is for convenience calculated in the rest frame of the nucleon. Lorentz contraction might lead to different modifications in different directions when going from one frame to another. Thus one has to take the force averaged over the nucleus instead of the local directed force . The correction due to the external fields is proportional to which for small variations around a small can be approximated to . The constant summarizes other short range and surface interactions. Here, , and are the proportionality constants in this linear expansion that will have to be determined experimentally. At leading order, this modification will be reflected one to one if one compares the deep inelastic -dependent cross-sections of a neutron (proton) with and without external electromagnetic fields and surface interactions. One finds
where are constants. The first approximate proportionality in equation (II.1) comes from the fact that, at leading order in , the corresponding differential cross-section is proportional to the structure function DeRoeck:2011na . The derivative of the ratio (II.1) is
| (5) |
II.2 EMC effect
In the most simple version of an atomic nucleus model, one would expect that the DIS cross-section is given by the cross-section of a nucleon multiplied by the number of participants (neutrons+protons) in this collision
| (6) |
Thus, the DIS data for heavy nuclei should be predictable from the DIS data obtained from lighter nuclei and vice versa. In particular, the ratio
| (7) |
was expected to be constant (one) and not a function of Bjorken . The EMC effect is the famous observation that Aubert:1983xm . This observation has triggered numerous experimental tests and theoretical explanations. An incomplete list includes for example nuclear binding Akulinichev:1985ij ; Akulinichev:1986gt ; Dunne:1985cn ; Dunne:1985ks ; Bickerstaff:1989ch ; Benhar:1997vy , pion excess Ericson:1983um ; Wiringa:1984tg ; Berger:1984na ; Berger:1987er , multi-quark clustering Jaffe:1982rr ; Carlson:1983fs ; Chemtob:1983zj ; Clark:1985qu , dynamical rescaling Nachtmann:1983py ; Close:1983tn , medium modification Bentz:2001vc ; Mineo:2003vc ; Smith:2003hu ; Cloet:2006bq ; Cloet:2009qs ; Cloet:2012td and short-range correlations CiofiDegliAtti:1989eg ; Weinstein:2010rt ; Fomin:2011ng ; Arrington:2012ax ; Hen:2012fm ; Frankfurt:2012qs ; Hen:2013oha . For a review see, for example Malace:2014uea ; Geesaman:1995yd .
Since the shadowing and anti-shadowing effects of the EMC effect at low
are well understood, we will first focus on the linear intermediate regime .
In particular, it was noted that
the size of the EMC effect depends on the charge of the atomic nuclei Gomez:1993ri .
Below, this effect will be studied in the light of our hypothesis of electromagnetic stress acting on nucleons,
a perspective which we have not found in the literature.
Let’s return to the most simple version of an atomic nucleus model but allowing for contributions of electromagnetic stress. Larger atomic nuclei will have larger charge and thus accumulate larger average electric fields of the surrounding protons. Therefore, one has to correct the relation (6) by
| (8) |
In this straightforward model, one can compare the normalized DIS -dependent cross-section of large nuclei with the DIS cross-section of small nuclei
where the expansion point was chosen to be the point for which this ratio crosses the value of one with a negative slope. For a given isotope, this linear dependence reads . It can be obtained by fitting the experimental data for (II.2), as shown in figure 1 for the case of an aluminum isotope.
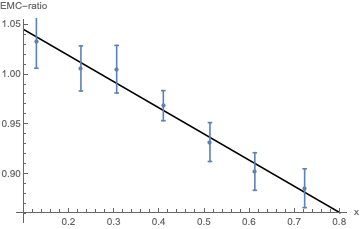
This fit was repeated for the elements , using data from Gomez:1993ri and the digitalization tool WebDigit . For other recent findings on nuclear dependence of the EMC effect see Seely:2009gt ; Fomin:2011ng ; Arrington:2012ax . One finds for example that .
Even more interesting information can be obtained from the slope, because it will allow relating to . Deriving (II.2), with respect to , gives
| (10) |
The magnetic field within the nucleus will be produced by the surrounding spin protons and neutrons. However, those are oriented randomly Ma:1997gy and thus, one can expect the -dependence of in (10) to be subdominant in comparison with . The same holds for the short-range contributions . Let’s now estimate the average electric force as a function of nucleon charge by assuming a constant average charge density . The total charge of such a spherical nucleus is
| (11) |
which can be solved for the nucleon radius. The radial electric field which is produced by the surrounding protons of a nucleon within the same nucleus is obtained from Gauss law
| (12) |
The average value of this field is
| (13) | |||||
Note that the field (13), produced by the neighboring protons, is the most dominant one. All other contributions, like the field produced by the eventually surrounding electrons or any other external field of the experimental apparatus can be neglected.
Inserting (13) into (10) one obtains a prediction of the charge dependence of the slope data
| (14) |
The constant is expected to originate for example from the largely -independent average magnetic field , or other mean-field and boundary effects. Note that usually the ratio (14) is plotted as a function of atomic number and not as a function of charge . However, this distinction is a subleading effect since and are proportional within the precision of the slopes given here.
The EMC-type ratio has been measured and fitted like in figure 1 for eight different atomic nuclei , which allows extracting the observed data for the predicted charge dependence (14). As shown in figure 2, one gets a good match between (14) and the data obtained from the slope fitting like the one plotted in figure 1.
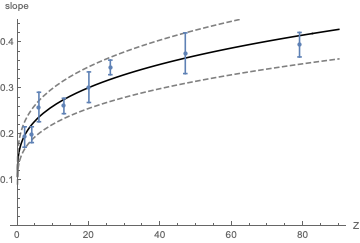
Given the simplicity of the underlying idea and model, the good agreement between the model (14) and the data in figure 2 is remarkable.
Note that usually the slope graph 2 is shown as a function of atomic number and not of atomic charge, but since both quantities are proportional up to , there is no substantial difference between both plots.
III An explicit model of deformed nucleons in the atomic nucleus
III.1 Distribution of deformations in the nucleus
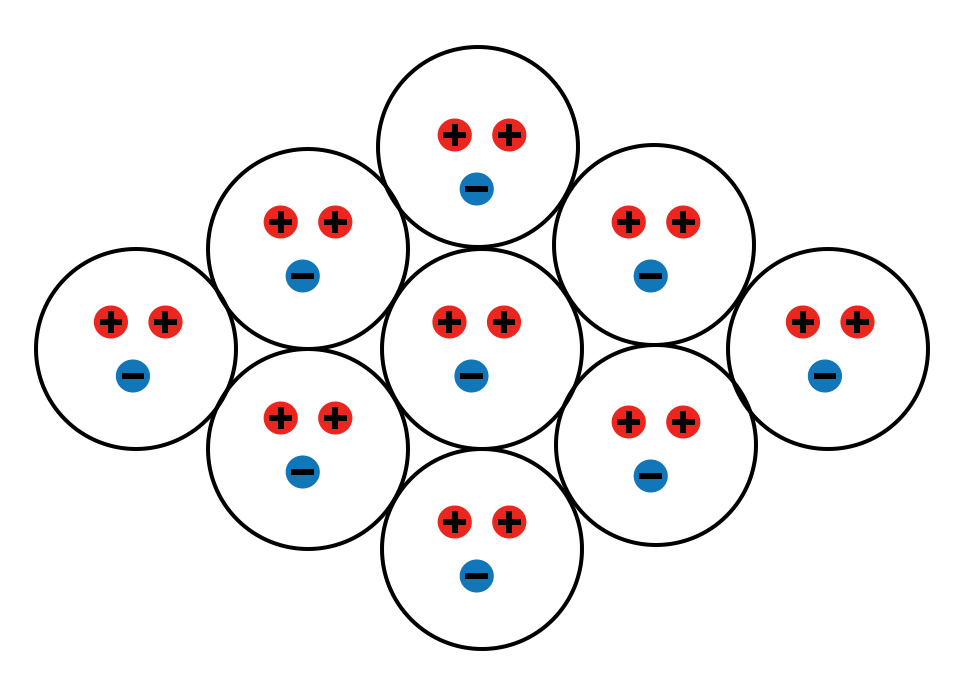
The difference between stress and “no-stress” can be easily visualized graphically for a toy example. In this example, the toy nucleons within a nucleus all have charge one and are composed of two partons with charge , one parton with charge , and the electrically neutral but strongly interacting rest, which is confining the nucleon. When neglecting the EM stress, all nucleons shall be described by identical spheres independent of their position within the nucleus, as shown on the left-hand side of figure 3.
This changes when one takes into account the stress felt by the charged partons of an individual nucleon, which is produced due to the ’‘external” electric field of the surrounding nucleons. This stress will tend to pull the negative partons towards the center of the nucleus and push the positive partons towards the outer border of the nucleus and thus deform the nucleon, as shown on the right-hand side of figure 3.
.
Please note that the toy-structure shown in figure 3 is only chosen for illustrative purposes, in order to visualize the EMS mechanism.
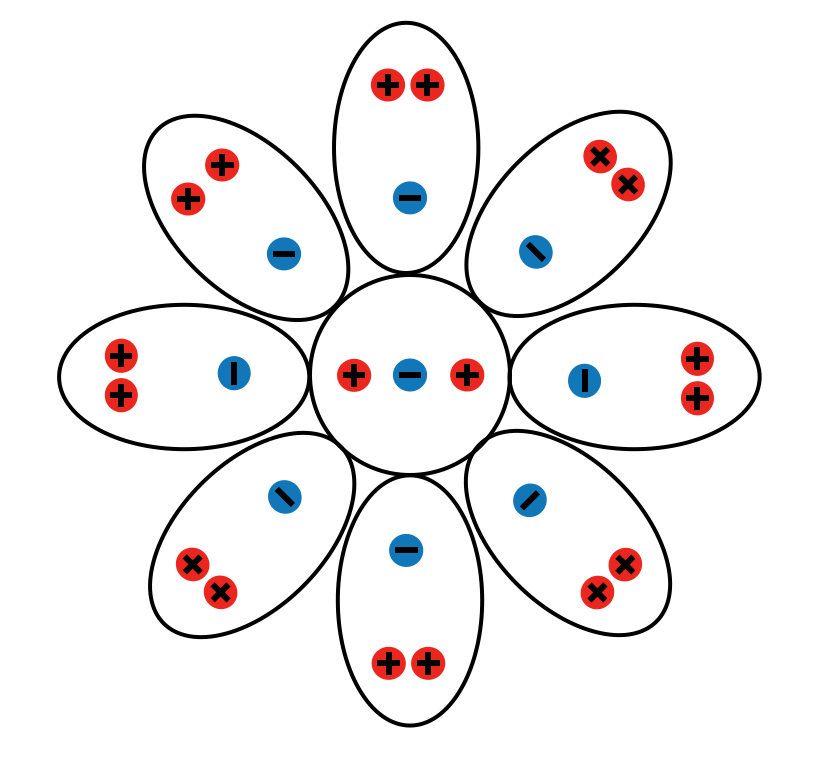
The physically relevant question is, whether this electromagnetic stress which was estimated in (2) is strong enough to be observable in deep inelastic scattering. Apart from the pure size of the deformation, there is an additional effect. In large nuclei, the amount and direction of this deformation will depend on the position of the nucleon within the nucleus, as shown on the right side of figure 3. This dependence, which goes beyond a mean-field approximation, will be considered now.
One expects that the EMS generated deformation is directed radially outward and that its amount increases with distance from the center of the nucleus. For example, the electric field of a spherically symmetric distribution of constant charge density scales as (12)
Concerning this, one can distinguish three different regions of deformation within a large nucleus, as shown in figure 4.

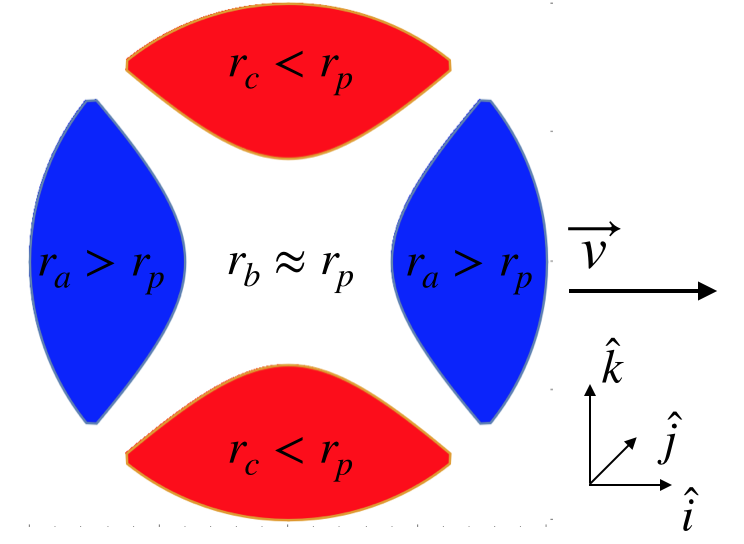
Left: Toy nucleus with EM stress.
Right: Nucleon distribution in an atomic nucleus. Nucleons stretched in -direction are indicated with blue, nucleons squeezed in -direction with red, and nucleons with negligible deformation in with white. When integrating the colored volumes in the right figure, one finds that red, white, and blue occupy 54%, 27%, and 19% of the volume. Note that this integration has a rotational symmetry with respect to the direction.
-
a)
In the front and back of the nucleus moving with velocity , the thickness in direction is larger than the radius of an undeformed nucleon . This is indicated by the blue region on the right-hand side of figure 4.
-
b)
Nucleons in the central part of the nucleus will have negligible stress. The outer nucleons in the diagonal region (e.g. ) will be deformed, but their thickness projected on the direction will be approximately the same as the radius of an undeformed nucleon . Those cases with are indicated by the white region on the right side of figure 4.
-
c)
Nucleons in the lateral belt will be thinner in direction than undeformed nucleons . This is indicated by the red region on the right side of figure 4.
The fraction of nucleons in each of those categories will be labeled . If the scattering particle interacts with a long-range interaction, which means it sees the entire nucleus, one expects that . Further, for a sizable polarization, one expects the three fractions to be of comparable size, like in figure 4.
III.2 Edin model for the nucleon
The implications of EMS, which were given above, are intuitive in physical position space. However, structure functions, relevant for DIS observables, are given in terms of the parton momentum fraction . To be able to make quantitative predictions about the impact of EMS on DIS one needs a model which describes this transition from position to “x” space. For this purpose, we will utilize a description relying on the structure of the Edin model proposed and described in Edin:1998dz ; Edin:1999ep . In this model the dominant contribution to the structure function of Deuterium will be taken as a one to one mix of a proton and a neutron. We define thus . By using this definition, one neglects the possible EMS effects of Deuterium. However, for Deuterium the EMS effects should be the smallest ones available as one can see for example from figure 2. This structure function takes the form
| (15) |
where the dimensionless parameter is given in terms of the proton mass and the proton (neutron) radius measured in the rest frame of the proton (neutron)
| (16) |
Fitting only one parameter, namely the normalization , one obtains a good fit of the proton structure function, in the -range, which is relevant for our study, as shown in figure 5.
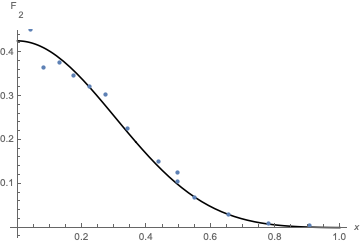
In the following subsections the model (15) will be used to estimate the EMS effects on a nucleus composed of deformed nucleons. In a deformed nucleon, the radius becomes dependent on the direction it is measured. In this case, will refer to the radial direction parallel to the motion of the nucleon as seen from the center of mass frame of the collision measuring this nucleon. The reason for this is that the fractional momentum is defined in the same direction.
III.3 EMC fit with EMS
In this subsection, the EMS idea will be implemented in the Edin model (15). This will allow to fit EMC data from DIS with Iron nuclei. Iron is chosen because it has a very good data quality for large momentum fraction “x”.
The EMC effect is typically expressed in terms of a normalized ratio. Let us consider Iron ( and ) and Deuteron ( and )
| (17) |
Since at very low , the EMC effect is dominated by the well understood parton shadowing and the anti-shadowing of the pion cloud and since for very high , correlations and multiple scatterings become dominant Hen:2016kwk and error bars become large, the following analysis will be restricted to the range .
As a first quantitative approach to this idea, lets stick to the regions shown in figure 4 and assume that each of them has nucleons with a constant deformation. According to the EMS effect described above, the iron nucleus is composed of a fraction of stretched, undeformed, and squeezed nucleons, giving a combined structure function
| (18) |
The difference between the three contributions (a, b, c) is that they have different proton thickness in direction : . According to (16) this corresponds to different . For a comparable width and length deformation, this means
| (19) | |||||
Please note that even though the EMS can deform the radius it does not change the nucleon mass, which will remain constant in equation (16). According to the model (15), for each radius one expects a slightly deformed structure function as shown in figure 6.
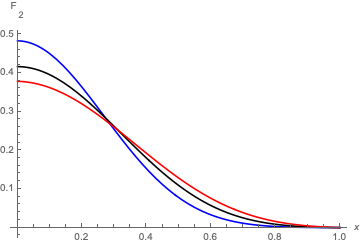
Those different structure functions can be combined in (18) and subsequently used to form the EMC ratio (17) which then reads
| (20) |
This is the EMS model of the EMC effect. The parameters are , and . For scattering processes with long range interactions, one has further the constraint . Taking a relative deformation of one can fit the iron EMC data, as shown in figure 7.
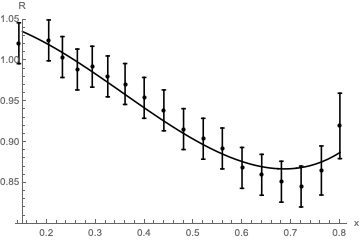
One realizes that the parameters
| (21) | |||||
give a good fit of the EMC effect, not only showing the downhill slope at , but also reproducing the inversion and depth at . This fitting procedure was repeated, varying the parameters subject to the constraint, and the numerical given values turned out to give the best result. As a sanity check, one further realizes that the values in (21) are pretty close to the values that arose from the illustration example in figure 4. A sanity check for will be discussed in subsection III.7.
III.4 Charge dependence
At first sight, the distribution (21) should be independent of the number of protons and neutrons in a given nucleus as long as the ratio between proton and neutrons does not vary too much. The well-measured dependence on the atomic number enters indirectly through the average deformation . The main increase of the deformation in (19) would be due to larger average electric fields produced by a larger total charge (13) which is proportional to the total number of nucleons
| (22) |
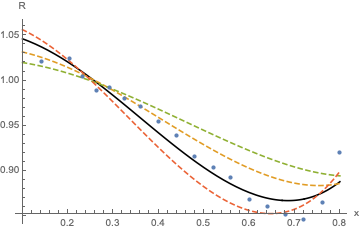
Figure 8 shows how the ratio (20) changes for different choices of .
.
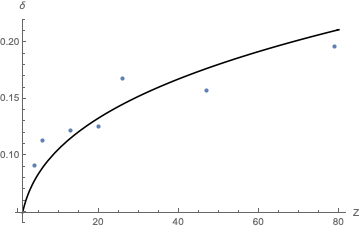
One notes clearly that a larger produces a steeper ratio (17), while a smaller produces a flater ratio. Plotting the , necessary to fit the experimental results for the ratio (20) for different nuclei ( all with fixed (21)) one obtains a beautiful confirmation of the dependence (22), expected from the above model of the EMS effect. The best fit of the is obtained for
| (23) |
which is shown in figure 9.
.
III.5 Scale dependence for
An essential feature of the EMC effect is that the ratio (17) is very robust under changes of Eskola:1998df . It was, for example, observed that changes of the EMC slope when going from to are compatible with zero.
Since the above explanation of the EMC effect uses deformed structure functions, and since those structure functions have a strong -dependence, it is at first puzzling, how -robustness could arise from such a model. However, as it will be shown below, it turns out that in practice, the cancels out almost entirely from the electromagnetic stress model. There are two main reasons for this.
-
i)
The -dependence of the structure functions is most important for , while for larger there is only a few percent change when going from to Lai:1999wy . Since the slope of the EMC effect only relies on data, the -dependency of this slope should also be reduced to this order of magnitude.
-
ii)
Within the simple implementation in the Edin model (20), the EMC effect is a ratio of deformed structure functions, all evaluated at the same fraction . At a given value of , induced changes will apply almost multiplicatively in both, the structure functions of the numerator and of the denominator. Those effects tend to cancel each other, and the ratio remains almost invariant under changes of .
In order to exemplify this argument quantitatively, one can consider the ratio (20), with the parameters (21) at an initial scale . The -dependence of each of the structure functions is given by the DGLAP evolution equations Altarelli:1977zs ; Lai:1999wy
| (24) |
where , and where is a weighted average of the splitting functions , whose detailed form does not affect the following discussion. By integrating (24), one obtains a structure function at large from an initial structure function at . Figure 10 shows the deformation of the structure function when going from to .
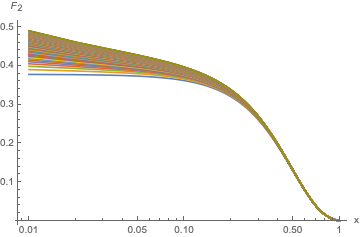
One notes that changes are much stronger for as anticipated in , but still at a ten percent change is perceivable. This shows that the argument is insufficient to explain the observed robustness of under substantial changes in .
One can evolve all the structure functions in (20) and thus calculate the ratio . The result of this procedure is shown in figure 11.
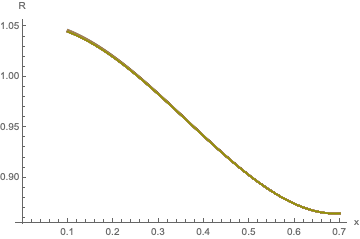
One notes that the different structure functions of figure 10, are now compressed to a single, almost indistinguishable, bundle of curves in figure 11. This compression is a result of the cancellation effect, anticipated in argument and it translates into a -independence of the ratio . Fitting the slope of the curves in figure 11 between and gives the slope as a function of . The result of this procedure is shown in figure 12.
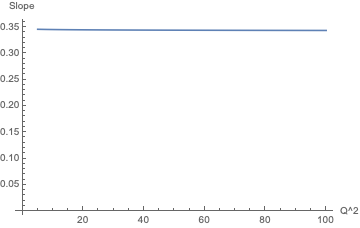
Clearly the -dependence of the EMC slope turns out to be negligible, due to the cancellation effect described in ii).
III.6 Scale dependence for
In the introduction, the theoretical estimate (2) for the relative deformation of a nucleon in a tiny nucleus was given to be of the order of . This seems to be in tension with the we found from explaining the EMC effect with EMS deformations (23). In order to understand this difference, one has to keep two effects in mind.
-
•
Basically, all nucleon properties are affected by the surrounding nuclear medium. For the case of polarizability, this means that strong and mesonic interactions with the surrounding nuclear matter, can “soften the skin” of an individual nucleon. This would make the nucleon much more susceptive to electromagnetic stress. This enhancement might explain the relatively large deformations in the EMS-EMC explanation (23).
-
•
Both and are -dependent quantities. For , it was shown above that there is a cancellation of effects when calculating . However, for smaller and for the polarizability underlying the estimate (2) there is no reason to expect such a cancellation. For example, in Holstein:2013kia the generalized spin-independent polarizability of a proton was given as
(25) The estimate (2) was derived from measurements at , while the EMC effect is measured at . Even though the approximation underlying the calculation of (25) collapses for larger , it is clear from (25) that a relative increase of by a factor of 50 is certainly possible when going from to .
III.7 Deformation estimate in a bag model
The preceding sections give on the one hand an estimate of the deformation between two neighboring protons at very small (2) and on the other hand the amount of deformation needed to explain the EMC result at larger (23). In this subsection, a simple order of magnitude estimate will be given, which will show that both results are compatible.
The nucleon is held together by the strong interaction
with the coupling constant .
This confining interaction can be expected to resist deformations.
The EMS effects, in contrast, are caused by electromagnetic interactions with the coupling
constant . If this coupling
would be zero or extremely small, even the strongest external electric field could
not deform a nucleus.
Thus, one can expect that the dimensionless deformability
increases with growing , but decreases with growing .
This suggests at leading order in and for comparable electric and strong
charge number
| (26) |
However, both couplings are scale-dependent, in particular, can change significantly with . Therefore, the ratio inherits the dependence from the couplings
| (27) |
One can also deduce (27) from a more fundamental model. A good candidate for this procedure is the MIT bag model. The input of this model is the shape and strength of the confining strong potential (which is proportional to ). In order to do this calculation directly, one needs, however, the analytic form of the bound state solutions. There are few analytical solutions for quantum mechanical potentials known. For simplicity, the harmonic oscillator in three dimensions will be used. Given the distance between two nuclei and the electric polarizability one can estimate the deformation due to a charged neighbor (see 2)
| (28) |
For a given model of the nucleus, the polarizability can be calculated from Hecking:1981fsu
| (29) |
where are the excited eigenfunctions of a given quantum mechanical potential, which will depend on . For the purpose of finding a ratio of couplings, like the one in (27), one has to keep track of the coupling constants when computing (29). One can exemplify this for the 3-D harmonic oscillator with the potential
| (30) |
The eigenfunctions of this problem are products of spherical harmonics and generalized Laguerre polynomials Messiah:1979eg . With these, the non-vanishing integrals of the numerator of (29) behave as
| (31) |
The energy differences in the denominator behave as
| (32) |
Inserting (31 and 32) in (29) one finds that the polarizability scales with the couplings as
| (33) |
Next, one takes a fixed distance between two nuclei (meaning that is not scaling with ). This is a reasonable assumption since in the suggested model, the deep inelastic scattering simply probes the internal structure of the individual nucleons. One finds
| (34) |
Thus, the ad-hoc relation (27) can be justified from a more fundamental point of view.
Let’s shortly explore the consistency of this relation at different scales
-
•
:
For very high energy processes , it is well known that and thus . This means that small external electromagnetic fields can produce large changes in the shape of the nucleus. The nucleon is extremely “soft”, meaning that the constituents are not confined anymore. This effect is famously known as asymptotic freedom Gross:1973id ; Politzer:1973fx .
Thus, the ratio (27) reflects our intuitive understanding of confinement and strong interactions at large . -
•
:
If to the contrary, the strong coupling dominates the electromagnetic coupling, all corrections to the form of the nucleon should get suppressed. At very small , close to the energy scale of QCD , one expects and Deur:2005rp . Thus, the deformation gives(35) as an order of magnitude estimate. This result has to be compared to the obtained from the low energy polarizability (2) which only differs by a factor of two. This is a compelling agreement for this type of estimate.
-
•
Intermediate :
The EMC effect is measured at intermediate scales energy scales of about . In order to estimate the dependence of (27) one can solve the beta function of QCD and QED subject to the initial conditions and giving(36) where . This gives for the aforementioned energy range
(37)
Relation (37) is the order of magnitude estimate for in the context of the EMC experiment. This quantity should be compared to (see relation 3.9), and (see Fig.2) obtained from assuming that the EMC effect can be explained from the hypothesis of an EMS mechanism. Clearly, these quantities lie closely in the same ballpark, justifying the consideration of the EMS mechanism in the first place.
IV Small atomic nuclei
For small atomic nuclei, the addition of every single nucleon will change the geometry of the nucleus. Thus, the homogeneity assumptions of the previous two sections are doomed to fail. This can be seen already from the fact that for , the EMC slope must be zero by construction. The model (14) does not have this feature because it is constructed for large nuclei. If one tries to include this initial condition in an analogous model
| (38) |
one realizes that, for small nuclei, this model is far off from the data Seely:2009gt . A simple reason for this failure is that, the estimate for the average electric field (13) is not applicable to small nuclei. In the following subsection, a discrete model for calculating this average electric field is presented.
IV.1 A simple discrete model
Given the difficulties of the continuous model, when it comes to small nuclei, one can try to describe these nuclei with the polar opposite simplification, a rigid discrete model. In this model, protons are assumed to be point charges inside of a sphere of radius , while neutrons are assumed to be neutral spheres of approximately the same radius. In stable nuclei and are bound together, putting their spheres in contact, while experience an interplay between atomic attraction and electromagnetic repulsion, resulting in a distance between the centers both nuclei. Following these simple construction rules, one can build a rigid discrete charge distribution for the light isotopes , , , , and , whose EMC slope is given in Seely:2009gt . For the geometric configuration is trivial, and for and the configuration is shown in figure 13.
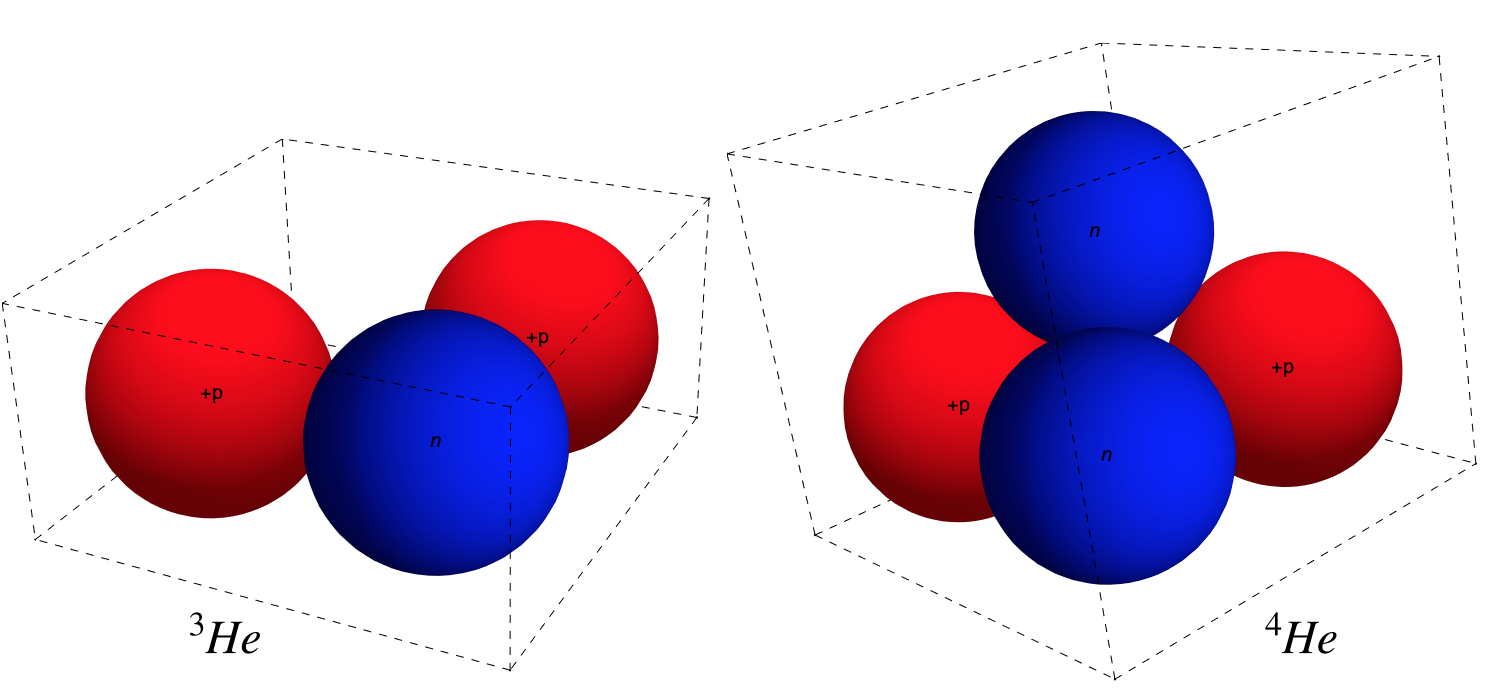
Geometric configuration of the , nuclei. The blue spheres indicate the relative positions of neutrons and the red spheres indicate the relative positions of protons. For simplicity, the opening angle of the triangle was chosen to be .
One realizes that the best configurations (according to the above rules) for and are the ones given in figure 14.
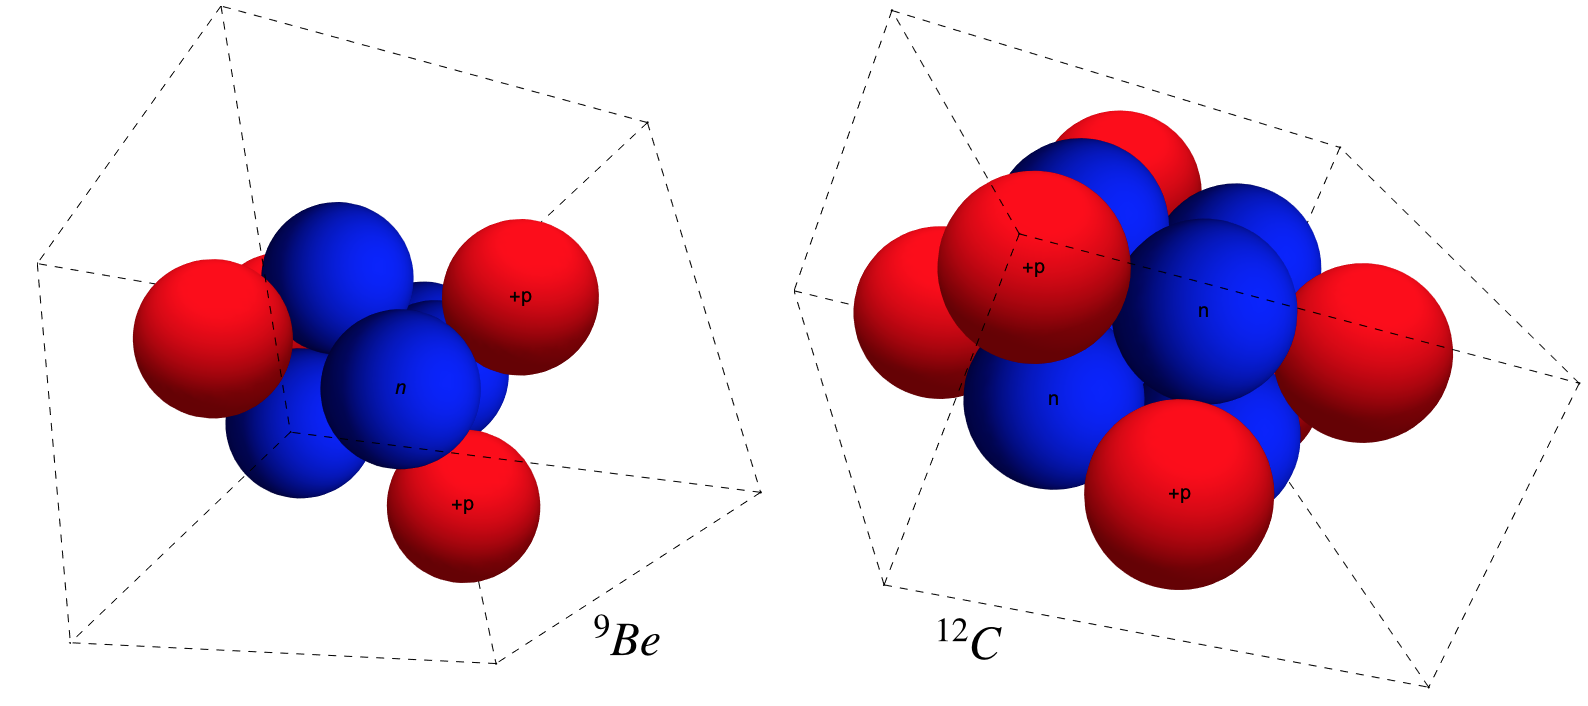
Geometric configuration of the , nuclei. The blue spheres indicate the relative positions of neutrons and the red spheres indicate the relative positions of protons. For simplicity, the opening angle of the triangle was chosen to be .
One notes that is composed of two and is made of three . In both cases electric repulsion lets the electrically charged protons accommodate oriented outwards. The nucleus contains one additional , which breaks the discrete symmetry of , by aligning outside of this configuration.
IV.2 EMS and EMC for small nuclei
Given the geometric configurations 13, or 14, it is straight forward to calculate the external electrical field at the nucleon position , produced by all the surrounding protons
| (39) |
The average of the absolute values of these external electromagnetic fields is
| (40) |
This field can now be taken as source for the electromagnetic stress (10) acting in the nucleons of small nuclei. In analogy to (14) one expects the EMC slope to be
| (41) |
where is calculated from (39). Here, the average electric field has to be subtracted, since the EMC ratio is measured with respect to . Just like in the continuous model (14), the universal proportionality constant has to be determined by fitting the data.
In figure 15, the result of (41) is compared to the fit using the continuous model (38) and to the data points given in Seely:2009gt .
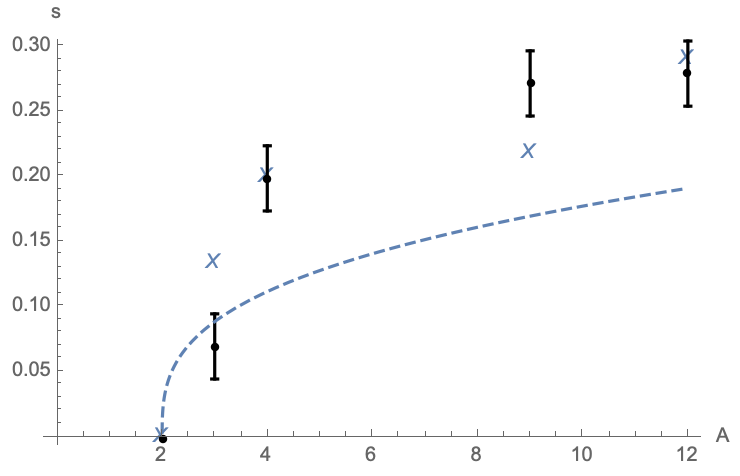
One notes that the dashed line of the continuous model (38) is not able to fit the data in this range, while the discrete EMS model (41) is doing a better job of fitting the EMC data for small nuclei.
However, one has to keep in mind that the continuous model is, by construction, meant to work for large nuclei, while the discrete model has not been tested for nuclei larger than . The construction of these larger nuclei is left for future work. Further effects, which will be considered in future investigations, are those related to additional degrees of freedom, such as magnetic fields, rotation, or vibration (note, that even the nuclear shell model has problems with explaining observed nuclear densities when applied to smaller nuclei Nortershauser:2008vp ; Krieger:2012jx ). The purpose of this section was not to come up with such a model, but to show that the EMS effect has a good potential of explaining the local nature of the EMC effect, which becomes prominent when one deals with small atomic nuclei.
V Summary and Outlook
V.1 Summary
This article explored the impact of electromagnetic stress on the nucleon structure. As a possible manifestation of this effect, the dependence of nuclear structure functions on external electromagnetic forces was studied. Simple and straight forward assumptions lead to a remarkably good description of the charge dependence of the EMC effect. This was first shown assuming a linear stress dependence of the nuclear structure functions (14) and then confirmed in an explicit model (20). The explicit model further captures the minimum and the rise of the EMC effect at larger . In subsection III.6 it is shown how the -independence of the EMC effect arises naturally within this model for . Finally, it is noted that the continuous models have to fail when applied to small nuclei and that this can be fixed by studying the electromagnetic stress in a more appropriate approximation. For example, as shown in the previous section, even a straight forward discrete, and in many ways naive implementation gives promising results with this respect.
The strength of the EMS idea is that it uses a very well known effect in nuclear physics, namely polarizability, in order to give a description for different aspects of the EMC effect. This explanation is, of course, not exclusive. Different effects can add up and influence each other. For example, in Weiner:1985ih , it was shown that pionic effects could contribute significantly to the polarizability of nuclei. Thus, one should also expect an important modification of the polarization from the pion excess Ericson:1983um ; Wiringa:1984tg ; Berger:1984na ; Berger:1987er , which is one of the suggested explanations of the EMC effect. Thus, it is probably a long way to go until the true origin of the EMC effect is known with certainty. Still, the EMS explanation is worth to be considered. It is actually very conservative since it does not need to invoke new intermediate states or otherwise unobserved effects.
V.2 Future directions
An interesting test which will be left for future investigation is that one can calculate the EMS effect with other nucleus and nucleon models Baranger:1960qge ; Jaffe:1978bu ; Brown:1979ui ; Brodsky:1982nx ; Brodsky:2000ii ; Gutsche:2016gcd ; DiPiazza:2011tq , which are different from the continuous fit (14), the Edin nucleon model with the “three regions nucleus” (20), and the discrete model form small nuclei (41) used here. In particular, for smaller nuclei, short-range correlations revealed important information CiofiDegliAtti:1989eg ; Weinstein:2010rt ; Fomin:2011ng ; Arrington:2012ax ; Hen:2012fm ; Frankfurt:2012qs ; Hen:2013oha , which points towards local effects that go beyond a mean-field explanation. The first step into this direction will be to generalize the approach (20), which was used for continuous distributions with probability fractions . In this generalization, the probabilities would be replaced by a sum of structure functions, one for each individual nucleon. Since our model is also based on local modifications of structure functions, it would be very interesting to explore such correlations. Once a more realistic and more precise model is implemented, the systematic error bars of this study will reduce. Thus one has to pay more attention to the experimental error bars and their interpretation. In particular, considering the isoscalar corrections of the SLAC data will then be important.
However, these and other improvements go beyond the scope of this paper.
V.3 Acknowledgements
Thanks to Marcelo Loewe Lobo and Matt Sievert for valuable comments and suggestions and Ina Gruber for thorough proofreading. Also thanks to Giorgio Torrieri for critical remarks. This work was supported by Fondecyt 1181694.
Appendix
The picture behind relation (2) is Figure 3 where one compares one of the nucleons on the left-hand side with one of the deformed nucleons on the right-hand side. The change in radius of one of the nucleons defining
| (42) |
Since the extremes of the deformed nucleon are relatively small regions, they can be assumed to good approximation to be homogenously charged. Thus, is proportional to the amount of displaced charge , which implies
| (43) |
The dipole moment of the deformed nucleon is . The same dipole moment is also given in terms of the polarizability through Holstein:2013kia , where the electric field of the neighboring nucleon is . Inserting these relations into (43) one arrives at
| (44) |
which is the relation used in (2)
References
- (1) D. J. Gross and F. Wilczek, Phys. Rev. Lett. 30, 1343 (1973). doi:10.1103/PhysRevLett.30.1343
- (2) H. D. Politzer, Phys. Rev. Lett. 30, 1346 (1973). doi:10.1103/PhysRevLett.30.1346
- (3) A. Deur, doi:10.1142/9789812774132 0007 hep-ph/0509188.
- (4) B. R. Holstein and S. Scherer, Ann. Rev. Nucl. Part. Sci. 64, 51 (2014) doi:10.1146/annurev-nucl-102313-025555 [arXiv:1401.0140 [hep-ph]].
- (5) A. De Roeck and R. S. Thorne, Prog. Part. Nucl. Phys. 66, 727 (2011) doi:10.1016/j.ppnp.2011.06.001 [arXiv:1103.0555 [hep-ph]].
- (6) J. J. Aubert et al. [European Muon Collaboration], Phys. Lett. 123B, 275 (1983). doi:10.1016/0370-2693(83)90437-9
- (7) S. V. Akulinichev, S. A. Kulagin and G. M. Vagradov, Phys. Lett. 158B, 485 (1985). doi:10.1016/0370-2693(85)90799-3
- (8) S. V. Akulinichev, G. M. Vagradov and S. A. Kulagin, JETP Lett. 42, 127 (1985) [Pisma Zh. Eksp. Teor. Fiz. 42, 105 (1985)].
- (9) G. V. Dunne and A. W. Thomas, Nucl. Phys. A 455, 701 (1986). doi:10.1016/0375-9474(86)90458-6
- (10) G. V. Dunne and A. W. Thomas, Phys. Rev. D 33, 2061 (1986). doi:10.1103/PhysRevD.33.2061
- (11) R. P. Bickerstaff and A. W. Thomas, J. Phys. G 15, 1523 (1989). doi:10.1088/0954-3899/15/10/006
- (12) O. Benhar, V. R. Pandharipande and I. Sick, Phys. Lett. B 410, 79 (1997). doi:10.1016/S0370-2693(97)00943-X
- (13) M. Ericson and A. W. Thomas, Phys. Lett. 128B, 112 (1983). doi:10.1016/0370-2693(83)90085-0
- (14) R. B. Wiringa, R. A. Smith and T. L. Ainsworth, Phys. Rev. C 29, 1207 (1984). doi:10.1103/PhysRevC.29.1207
- (15) E. L. Berger and F. Coester, Phys. Rev. D 32, 1071 (1985). doi:10.1103/PhysRevD.32.1071
- (16) E. L. Berger and F. Coester, Ann. Rev. Nucl. Part. Sci. 37, 463 (1987). doi:10.1146/annurev.ns.37.120187.002335
- (17) D. F. Geesaman, K. Saito and A. W. Thomas, Ann. Rev. Nucl. Part. Sci. 45, 337 (1995). doi:10.1146/annurev.ns.45.120195.002005
- (18) R. L. Jaffe, Phys. Rev. Lett. 50, 228 (1983). doi:10.1103/PhysRevLett.50.228
- (19) C. E. Carlson and T. J. Havens, Phys. Rev. Lett. 51, 261 (1983). doi:10.1103/PhysRevLett.51.261
- (20) M. Chemtob and R. B. Peschanski, J. Phys. G 10, 599 (1984). doi:10.1088/0305-4616/10/5/005
- (21) B. C. Clark, S. Hama, B. Mulligan and K. Tanaka, Phys. Rev. D 31, 617 (1985). doi:10.1103/PhysRevD.31.617
- (22) O. Nachtmann and H. J. Pirner, Z. Phys. C 21, 277 (1984). doi:10.1007/BF01577042
- (23) F. E. Close, R. G. Roberts and G. G. Ross, Phys. Lett. 129B, 346 (1983). doi:10.1016/0370-2693(83)90679-2
- (24) W. Bentz and A. W. Thomas, Nucl. Phys. A 696, 138 (2001) doi:10.1016/S0375-9474(01)01119-8 [nucl-th/0105022].
- (25) H. Mineo, W. Bentz, N. Ishii, A. W. Thomas and K. Yazaki, Nucl. Phys. A 735, 482 (2004) doi:10.1016/j.nuclphysa.2004.02.011 [nucl-th/0312097].
- (26) J. R. Smith and G. A. Miller, Phys. Rev. Lett. 91, 212301 (2003) Erratum: [Phys. Rev. Lett. 98, 099902 (2007)] doi:10.1103/PhysRevLett.91.212301, 10.1103/PhysRevLett.98.099902 [nucl-th/0308048].
- (27) I. C. Cloet, W. Bentz and A. W. Thomas, Phys. Lett. B 642, 210 (2006) doi:10.1016/j.physletb.2006.08.076 [nucl-th/0605061].
- (28) I. C. Cloet, W. Bentz and A. W. Thomas, Phys. Rev. Lett. 102, 252301 (2009) doi:10.1103/PhysRevLett.102.252301 [arXiv:0901.3559 [nucl-th]].
- (29) I. C. Cloet, W. Bentz and A. W. Thomas, Phys. Rev. Lett. 109, 182301 (2012) doi:10.1103/PhysRevLett.109.182301 [arXiv:1202.6401 [nucl-th]].
- (30) C. Ciofi Degli Atti and S. Liuti, Phys. Lett. B 225, 215 (1989). doi:10.1016/0370-2693(89)90808-3
- (31) L. B. Weinstein, E. Piasetzky, D. W. Higinbotham, J. Gomez, O. Hen and R. Shneor, Phys. Rev. Lett. 106, 052301 (2011) doi:10.1103/PhysRevLett.106.052301 [arXiv:1009.5666 [hep-ph]].
- (32) N. Fomin et al., Phys. Rev. Lett. 108, 092502 (2012) doi:10.1103/PhysRevLett.108.092502 [arXiv:1107.3583 [nucl-ex]].
- (33) J. Arrington, A. Daniel, D. Day, N. Fomin, D. Gaskell and P. Solvignon, Phys. Rev. C 86, 065204 (2012) doi:10.1103/PhysRevC.86.065204 [arXiv:1206.6343 [nucl-ex]].
- (34) O. Hen, E. Piasetzky and L. B. Weinstein, Phys. Rev. C 85, 047301 (2012) doi:10.1103/PhysRevC.85.047301 [arXiv:1202.3452 [nucl-ex]].
- (35) L. Frankfurt and M. Strikman, Int. J. Mod. Phys. E 21, 1230002 (2012) doi:10.1142/S0218301312300020 [arXiv:1203.5278 [hep-ph]].
- (36) O. Hen, D. W. Higinbotham, G. A. Miller, E. Piasetzky and L. B. Weinstein, Int. J. Mod. Phys. E 22, 1330017 (2013) doi:10.1142/S0218301313300178 [arXiv:1304.2813 [nucl-th]].
- (37) S. Malace, D. Gaskell, D. W. Higinbotham and I. Cloet, Int. J. Mod. Phys. E 23, no. 08, 1430013 (2014) doi:10.1142/S0218301314300136 [arXiv:1405.1270 [nucl-ex]].
- (38) J. Gomez et al., Phys. Rev. D 49, 4348 (1994). doi:10.1103/PhysRevD.49.4348
- (39) Ankit Rohatgi; https://automeris.io/WebPlotDigitizer.
- (40) J. Seely et al., Phys. Rev. Lett. 103, 202301 (2009) doi:10.1103/PhysRevLett.103.202301 [arXiv:0904.4448 [nucl-ex]].
- (41) B. Q. Ma, I. Schmidt and J. Soffer, Phys. Lett. B 441, 461 (1998) doi:10.1016/S0370-2693(98)01158-7 [hep-ph/9710247].
- (42) A. Edin and G. Ingelman, Phys. Lett. B 432, 402 (1998) doi:10.1016/S0370-2693(98)00659-5 [hep-ph/9803496].
- (43) A. Edin and G. Ingelman, Nucl. Phys. Proc. Suppl. 79B, 189 (1999) doi:10.1016/S0920-5632(99)00671-4 [hep-ph/9912536].
- (44) M. Tanabashi et al. [Particle Data Group], Phys. Rev. D 98, no. 3, 030001 (2018). doi:10.1103/PhysRevD.98.030001
- (45) O. Hen, G. A. Miller, E. Piasetzky and L. B. Weinstein, Rev. Mod. Phys. 89, no. 4, 045002 (2017) doi:10.1103/RevModPhys.89.045002 [arXiv:1611.09748 [nucl-ex]].
- (46) A. Bodek et al., Phys. Rev. Lett. 50, 1431 (1983). doi:10.1103/PhysRevLett.50.1431
- (47) G. Bari et al. [BCDMS Collaboration], Phys. Lett. 163B, 282 (1985). doi:10.1016/0370-2693(85)90238-2
- (48) A. C. Benvenuti et al. [BCDMS Collaboration], Phys. Lett. B 189, 483 (1987). doi:10.1016/0370-2693(87)90664-2
- (49) S. Dasu et al., Phys. Rev. D 49, 5641 (1994). doi:10.1103/PhysRevD.49.5641
- (50) I. Schienbein, J. Y. Yu, K. Kovarik, C. Keppel, J. G. Morfin, F. Olness and J. F. Owens, Phys. Rev. D 80, 094004 (2009) doi:10.1103/PhysRevD.80.094004 [arXiv:0907.2357 [hep-ph]].
- (51) K. J. Eskola, V. J. Kolhinen and C. A. Salgado, Eur. Phys. J. C 9, 61 (1999) doi:10.1007/s100520050513, 10.1007/s100529900005 [hep-ph/9807297].
- (52) G. Altarelli and G. Parisi, Nucl. Phys. B 126, 298 (1977). doi:10.1016/0550-3213(77)90384-4
- (53) H. L. Lai et al. [CTEQ Collaboration], Eur. Phys. J. C 12, 375 (2000) doi:10.1007/s100529900196 [hep-ph/9903282].
- (54) P. Hecking and G. Bertsch, Phys. Lett. B 99, 237-239 (1981) doi:10.1016/0370-2693(81)91116-3
- (55) A. Messiah, De Gruyter/berlin 1979, 585p
- (56) W. Nortershauser et al., Phys. Rev. Lett. 102, 062503 (2009) doi:10.1103/PhysRevLett.102.062503 [arXiv:0809.2607 [nucl-ex]].
- (57) A. Krieger et al., Phys. Rev. Lett. 108, 142501 (2012) doi:10.1103/PhysRevLett.108.142501 [arXiv:1202.4873 [physics.atom-ph]].
- (58) R. Weiner and W. Weise, Phys. Lett. 159B, 85 (1985). doi:10.1016/0370-2693(85)90861-5
- (59) M. Baranger, Phys. Rev. 120, no. 3, 957 (1960). doi:10.1103/PhysRev.120.957
- (60) R. L. Jaffe and F. E. Low, Phys. Rev. D 19, 2105 (1979). doi:10.1103/PhysRevD.19.2105
- (61) G. E. Brown and M. Rho, Phys. Lett. 82B, 177 (1979). doi:10.1016/0370-2693(79)90729-9
- (62) S. J. Brodsky, T. Huang and G. P. Lepage, Springer Tracts Mod. Phys. 100, 81 (1982).
- (63) S. J. Brodsky, D. S. Hwang, B. Q. Ma and I. Schmidt, Nucl. Phys. B 593, 311 (2001) doi:10.1016/S0550-3213(00)00626-X [hep-th/0003082].
- (64) T. Gutsche, V. E. Lyubovitskij and I. Schmidt, Eur. Phys. J. C 77, no. 2, 86 (2017) doi:10.1140/epjc/s10052-017-4648-5 [arXiv:1610.03526 [hep-ph]].
- (65) A. Di Piazza, C. Muller, K. Z. Hatsagortsyan and C. H. Keitel, Rev. Mod. Phys. 84, 1177 (2012) doi:10.1103/RevModPhys.84.1177 [arXiv:1111.3886 [hep-ph]].