A Tool to Estimate Roaming Behavior in Wireless Architectures
Abstract
This paper describes a software-based tool that tracks mobile node roaming and infers the time-to-handover as well as the preferential handover target, based on behavior inference solely derived from regular usage data captured in visited wireless networks. The paper presents the tool architecture; computational background for mobility estimation; operational guidelines concerning how the tool is being used to track several aspects of roaming behavior in the context of wireless networks. Target selection accuracy is validated having as baseline traces obtained in realistic scenarios.
Keywords: mobility tracking; social mobility behavior; user-centric networks.
1 Introduction
The introduction of new, cooperative technologies and in particular of low-cost wireless access, allowed the regular citizen to profit from the Internet as a commodity. Such pervasive Internet access is giving rise to networking architectures that seem to spread in a self-organizing manner, User-centric Networks (UCNs) [1, 2]. UCNs rely on an Internet end-user that exhibits frequent roaming patterns, and that owns/carries one or more portable devices with a good multimedia support. Hence, the majority of today’s mobile devices, which have been considered, up until recently, plain consumer devices, are now also networking nodes. As a consequence, the movement that these devices exhibit impact the underlying Internet connectivity models and the overall network operation. Hence, being able to capture such movement and also to estimate some features is highly relevant to optimize different aspects of network operation e.g. resource management, or routing.
Movement estimation has been a research field for long, with the aim of improving network operation. For instance, in cellular networks, several attempts have been provided to estimate movement as explained in section 2. Fast handing over based on movement anticipation techniques (e.g. tunneling) has been a topic extensively addressed, e.g., within the context of the Internet Engineering Task Force (IETF).
Estimating roaming behavior is therefore becoming more relevant, and today, due to an extensive effort derived from several initiatives as well as from extensive and wide traces collections [3], it is globally accepted that there is a relation between social behavior and the user’s roaming behavior [4]. It is the social behavior that assists in defining user movement patterns, both from an individual perspective, and from a group perspective [5]. Being capable of estimating such behavior is therefore relevant to optimize network operation, be it from a mobility management perspective (e.g., handover optimization), from a resource management perspective (e.g. performing a more intelligent load-balancing), or from a routing perspective (e.g. making routing more stable by selecting a priori paths that have a chance to be more stable in the light of node movement).
This paper is dedicated to the topic of mobility prediction in wireless
networks. We provide a debate on notions related to social interaction
analysis and mobile networks as well as a debate on guidelines to
better address mobility prediction. Our work proposes a non-intrusive
wireless sensing tool, the MTracker111Software is available as a beta version available directly via Google
Apps, https://play.google.com/store/apps/details?id=eu.uloop.mobilitytracker,
via http://copelabs.ulusofona.pt/~uloop/ or at
http://copelabs.ulusofona.pt/scicommons/index.php/publications/show/489., which provides a way to track properties of a user’s visit to preferred
networks, and to estimate a potential move towards a more preferred
network, based on the learnt history of the user’s roaming behavior.
2 Related Work
Within the context of cellular works, there are several studies dedicated to movement prediction. First attempts related with prediction based on Signal-to-Noise (SNR) ratio levels [6], being the main purpose to anticipate a potential handover and not to predict such handover in terms, e.g., of preferential target. Improvements to this line of research have been considered, for instance, via probabilistic selection based on user Global Positioning System (GPS) coordinates. Such related work fell short in terms of adequately estimating movement, partially due to the fact that at the time there was not a solid understanding on users’ roaming behavior.
The current availability of large-scale data sets, such as mobile-phone records and GPS data, allows researchers from multiple scientific fields to gain access to detailed patterns of human roaming behavior, greatly enhancing our understanding of human mobility. The extensive traces that are available today lead to a better understanding of social movement, having given rise to a few mobility models with roots on social network theory [7, 8].
In terms of human movement, Barabási et al. have been active in giving insight into human movement patterns [9]. As follow-up of their research, Song et al. research showed that human movement behavior is not compatible with Brownian approaches and showing also some level of predictability in such movement [10]. By measuring the entropy of each individual’s trajectory, they have found that there is a 93% predictable behavior across the studied universe.
Noulas et al. have analyzed roaming behavior features exploiting information on transitions between types of places, mobility flows between venues, and spatio-temporal characteristics of user check-in patterns, showing that supervised models based on the combination of multiple features assist in reaching high prediction accuracy [11]. Their analysis is focused on mobility prediction targetting location-based services. Our work has in common with the latter the intention to consider social behavior aspects that can be extracted from visits to networks, to improve mobility prediction. We do not, however, consider location-based services as the target to address. Instead, our perspective is derived from data captured passively by the user device only, in a non-intrusive way.
3 A Tool to Estimate Movement in Wireless Networks
The MTracker solution is a proof-of-concept software-based mechanism that intends to optimize wireless networking in the following aspects: i) handover optimization by improving resulting end-to-end delay (and node reachability time), as well as by reducing signaling overhead associated to handovers; ii) optimize resource management by estimating potential attachment points, and assisting the network in self-organizing, thus providing stations with the optimal wireless base stations.
3.1 Functional Aspects
There are three main tasks that the MTracker performs [12]. The first is Data Capture, namely, non-intrusive data capture based on visited and surrounding wireless networks. The second is Target Handover Selection, i.e., preferential target selection based on a seamless ranking of all wireless networks on a device’s list. The third one, Time-to-Handover, concerns estimating the time for the next handover to occur, based on the learnt roaming behavior of the device.
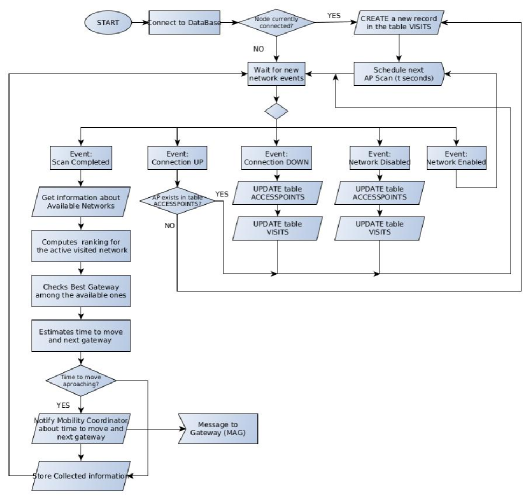
Fig. 1 provides a flow-chart for the MTracker operation. Its main three tasks are explained next.
3.1.1 Data Capture
Once the MTracker is activated, it relies on the usual 802.11 MAC Layer scanning mechanism to periodically obtain data concerning the list of networks in range, as illustrated in Fig. 1.
The MTracker list of visited networks is kept locally on the device. The tool devised is capable of periodically provides output to a local system (e.g. local database); or to external entities that reside on the network, e.g. a mobility management solution that has the responsibility to decide based on other external conditions whether or not a move should be anticipated.
The MTracker captures parameters via the Wi-Fi interface that are either overheard or that can be computed based on overhead data - it does not perform intrusive probing. The initial set of parameters considered in the MTracker are described in Table 1222The MTracker as proof-of-concept has already given rise to the tool WiRank (https://play.google.com/store/apps/details?id=eu.uloop.wirank), intended to improve Android connectivity and to integrate some aspects of prediction with other features, such as context-awareness based on location..
| Parameter | Name | Definition |
|---|---|---|
| visit | A visit from node i to node j implies that node i is authorized (by j) to use its networking resources. | |
| Total visits | Number of visits that node i does to node j. | |
| Visit duration | Time interval (seconds) since node is authorized by node j to be attached, until node i deattaches. | |
| average duration of a visit | Time interval (seconds) that node i is in average attached to node j, based on nan exponential moving average formula. | |
| visited network attractiveness | A parameter that a user sets by hand (e.g. gives more preference to using network1 than network2) or it can be passively collected via, e.g., distributed trust schemes that are present in the network (e.g. provided by the operator). | |
| Rejected visits | Number of times a node i is not authorized by node j to access its resources. | |
| Visit gap | Time gap (in seconds) since the last visit from node i to a specific visited network j. |
The mentioned parameters are here provided as a potential example of the type of parameters that can be used to characterize a user’s roaming behavior in terms of preferred networks without recurring to probing or to explicit location tracking. These parameters are used to compute the visited networks’ rank, as explained next.
3.1.2 Target Handover Selection, Ranking Visited Networks
The MTracker tool has been designed to integrate any utility function to rank visited networks. In this paper we consider a potential equation, Eq. 1, where corresponds to the ranking (cost) that node computes towards the network controlled by node . The rationale for such equation is that the longer and the more often a node visits a specific network, the higher the preference of that network to the node, provided that such visits are recent. Hence, the function described in Eq. 1 has enough sensitivity to distinguish between targets that seem to be preferential (for instance, high and long ) but that have actually been heavily visited a long time ago (long ). The function also takes into consideration the number of rejected connections against the total number of visits .
The rank provided by is computed from the perspective of node towards a potential visited network identified by node (e.g. an AP) based on parameters passively collected over time, by relying on the exponential moving average function of Eq. 2, where corresponds to the last computed value for and stands for the instant computation of By tuning one shall be providing more weight to more recent or to older instances of .
| (1) |
| (2) |
3.1.3 Time-to-Handover Estimate
Estimating a potential move is a task processed by a node in background and has as motivation to provide an estimate of time, as well as a target identifier for the next handover to be performed by the node. We highlight that the MTracker only notifies an entity (a user, some entity on the network, or even some other process in the local device) that a potential move may occur, so that a decision may assist the device in reaching some form of reliability in terms of active communication flow. For instance, it is still up to a mobility management solution to perform such a move, or not, based on the information provided by the MTracker.
To compute the estimate for a potential move, the MTracker periodically checks its list of ranked visited networks. Based on the computed average visit time of the active network as well as on the error time gap derived from prior learning about roaming habits of the node, the MTracker verifies which network(s) attain the best ranking in comparison to the active network.
The time to handover, TTH, estimated during an active connection of node to node is based on Eq. 3. The equation takes into consideration the average visit duration to the network controlled by node , as well as the time gap .
| (3) |
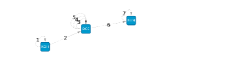
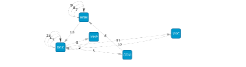
3.2 Operational Example
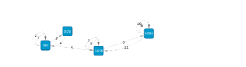
Fig. 2 illustrates a wireless scenario where three wireless visited networks are respectively served by AP1, AP2, and AP3. The application MTracker resides on the Mobile Node (MN), which periodically visits the three networks. Moreover, each visited network is served by a specific Mobility Anchor Point (MAP) agent which can be co-located to the AP, or placed somewhere else on the network, as occurs today.
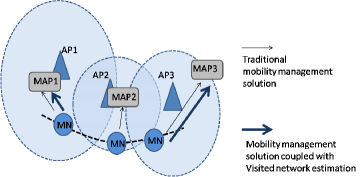
MN exhibits a regular trajectory e.g. during a day, where it crosses the three different visited networks. Following the regular IEEE 802.11 operation MN is set to perform passive scanning, i.e., while roaming it passively receives Beacon frames sent by the surrounding APs. It can therefore get a list not only of APs that it regularly attaches to, but also of neighboring APs that it did not visit. We highlight that there is no relation whatsoever with GPS location or tracking of the nodes; the MTracker simply captures data that is already provided by today’s devices, and has the capability to infer roaming behavior in terms of characteristics for the next handover.
In this operational example, intended to illustrate the benefits of prediction in mobility management, MN also integrates a mobility management solution, e.g. Mobile IPv6 (MIPv6) or Proxy Mobile IPv6 (PMIPv6). On its list of visited locations, it keeps track of multiple parameters such as the ones described in Table 1.
For instance, MN has recorded an average visit duration () of 15 minutes to AP1. On the current visit, 6 minutes have elapsed. Periodically, MN analysis its list of visited networks and checks whether or not the average duration visit is being reached. From a computational perspective, this means that MN integrates a time-window based mechanism to reach and eventually send a notification to an entity in the current visited network (e.g., AP, MAP, etc), e.g. every minute.
In our example, after 6 minutes, MN realizes that there is still a gap of 9 minutes and therefore does not send any information. When MN1 realizes that the current visit has reached 14 minutes, it sends a notification about the best possible visited network which, in our example, is the visited network served by AP3. In that notification, it therefore sends information to MAP1 about the best next MAP – MAP3, and also about how much time in average is left for a move. MN does not perform, however, any decision concerning moving (handover).
This outcome can then be fed to a mobility management process, which can then decide whether or not to activate a handover, as we have addressed in prior work [2]. However, this outcome can also be fed into other control-based processes as a way to estimate aspects of roaming behavior.
4 Target Selection Accuracy Validation
In this section we provide input concerning the performance of mobility prediction based on an analysis performed by considering realistic traces. The validation contemplates the accuracy of the tool in terms of adequately ranking preferencial networks. The traces selected are from University of South Carolina and available via the CRAWDAD repository [3]. The full set of USC traces 333http://uk.crawdad.org/usc/mobilib/. comprise 150 nodes which have been tracked over several months across different visited networks. Extracted traces provide information such as identifier of each visited network; duration of each visit; timestamp for the visit start. As there are no traces that consider rejection rates as well as attractiveness level, we have considered attractiveness to be similar to the number of visits and did not assess the impact of rejected visits in our experiments.
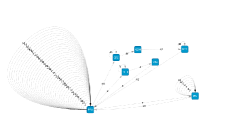
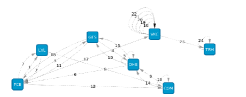
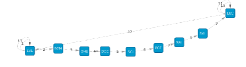
Out of the available traces, we have categorized nodes in terms of trajectory, namely: trajectory duration (short; long); number of visited APs (small number, large number); number of waypoints (high or low number of waypoints in the trajectory). Then, for the different categories, we have randomly selected again nine representative node trajectories. These nodes, numbered respectively as MN45, MN36, MN28, MN90, MN14, MN21, MN29, MN34, have their trajectories represented in Fig. 3.
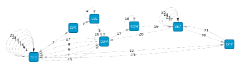
The ranking accuracy has been validated by computing the ranking of each visited AP over time and then selecting the AP with the highest rank, among all possible APs.
Table 2 provides results for the set of selected nodes. The first column represents the selected nodes. The second column contains the total of visited networks for that node during a single trajectory, while the third column provides the total number of visits across different networks. The fourth column provides details concerning the roaming paths extracted of the traces for each node, while the fifth and six columns provide details concerning the average visit duration (seconds and minutes) and total duration of the traces (seconds and days), respectively. The relative error percentage is provided in column seven.
| MN | Number of visited APs | Total waypoints | Roaming path main features | Average visit duration (seconds/minutes) | Total roaming duration (s/days) | Ranking accuracy error margin (%) |
|---|---|---|---|---|---|---|
| MN45 | 7 | 55 | 1 AP heavily visited; remainder APs visited in average 3 times | 2793 / 46 | 621978/7 | 20 |
| MN36 | 6 | 12 | Most APs visited once; 2 visited more than twice | 2112/35 | 1656107/19 | 25 |
| MN35 | 3 | 8 | 2 APs visited twice; 1 visited 4 times | 162757/2712 | 1303008/15 | 38 |
| MN28 | 5 | 14 | 3 APs visited once only | 8336/139 | 3334673/38 | 43 |
| MN90 | 7 | 29 | All APs visited at least twice; Most APs visited frequently for a specific timeslot, but not revisited | 1908/31 | 1295067/15 | 54 |
| MN14 | 6 | 41 | 1 AP accounts for circa 50% of visits; all APs revisited | 9250 / 154 | 1346709 / 16 | 29 |
| MN21 | 4 | 12 | 1 AP visited only once; all APs revisited at least 3 times sequentially | 5803 / 98 | 366220 / 4 | 33 |
| MN29 | 7 | 24 | Most APs visited twice only; 1 AP visited often | 3819 / 64 | 1225566 / 14 | 28% |
| MN34 | 9 | 14 | 7 APs visited only once | 1993 / 33 | 949480 / 11 | 7.14 |
MN45 stands for an example of a node that exhibits a long trajectory with a high number of waypoints, across a small number of visited networks (7). MN45 exhibits frequent visits to two different visited networks, represented as FSA and IRC. These are regular visits over time. In this case, the ranking capability provides an error estimate of around 20%, which is quite relevant given the fact that the other visited networks are in average visited only 3 times, are not necessarily visited sequentially.
MN36 stands for an example of a node that shares a similar trajectory in terms of time and visited networks, with the difference that its trajectory holds less waypoints in comparison to MN45 - 12 instead of 55. For this case, the accuracy is similar, as even though the visited networks have in average been less visited. The reason for this is that visits have been in average longer, which compensates for the lack of visit frequency.
MN28 and MN90 are worst-cases in terms of predicting next handover targets, as the MTracker has reached respectively an error rate of 43% and 54%. The reason relates to the fact that only two networks are visited more than once, with short visits.
MN34 stands for the best-case in terms of target accuracy (7% of error margin), being the reason the fact that only the first and the last networks of the trajectory have been frequently and sequentially visited. These networks also exhibit in average longer visits than the others.
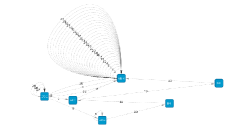
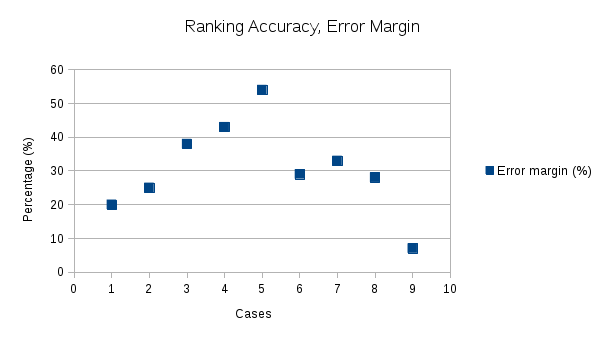
The results obtained show that the MTracker can predict with reasonable accuracy future handover targets, as the error margin stands between 20% and 30%.
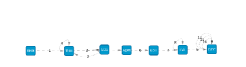
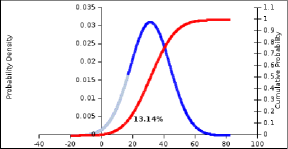
The error margins obtained accross all cases are provided in Fig.4a and Fig. 4b (Cumulative Density and Probabilistic Density Functions).
5 Summary and Conclusions
This paper contributes to the debate concerning the validity of mobility estimation as an operational improvement to networks, and one that can be easily implemented. It goes over the main concepts concerning movement estimation for portable devices, in particular in UCNs, where the end-user device often assumes the role of a network device.
The work describes the tool MTracker explaining how it can be used to assist in predicting roaming behavior in terms of handover target and time to handover.
We have validated the tool against traces obtained from devices realistic environments, showing that without considering GPS, MTracker is capable of predicting with reasonable accuracy future targets (20-30% error margin for most cases).
As current work, our mobility estimation framework is being validated in the context of IP mobility management solutions. It is also being extended to capture additional parameters that may assist other aspects of the network operation, e.g., routing. Traces are starting to be collected and will be provided to the global community. Last, but not the least, mobility estimation aspects are also being used to feed visualizing tools online, as a way to further analyze mobility behavior of Internet users, in a seamless, anonymous and yet pervasive way.
Acknowledgments
This work has been developed within the EU IST FP7 project ULOOP - User-centric Wireless Local Loop (grant number 247158). The author thanks Jonnahtan Saltarin for the implementation of the second version of the proof-of-concept software MTracker.
References
- [1] R. Sofia, P. Mendes, User-provided networks: consumer as provider, Communications Magazine, IEEE 46 (12) (2008) 86 –91.
- [2] A. Aldini, A. Bogliolo, User-Centric Networking - Future Perspectives, Lecture Notes in Social Networking, ISBN 978-3-319-05218-2, Springer, 2014.
- [3] D. Kotz, T. Henderson, I. Abyzov, Crawdad trace dartmouth, Available at http://crawdad.cs.dartmouth.edu (2005).
- [4] M. C. Gonzalez, C. A. Hidalgo, A.-L. Barabasi, Understanding individual human mobility patterns, Nature 453 (7196) (2008) 779–782.
- [5] I. Rhee, M. Shin, S. Hong, K. Lee, S. J. Kim, S. Chong, On the levy-walk nature of human mobility, IEEE/ACM Transactions on Networking (TON) 19 (3) (2011) 630–643.
- [6] M. K. Denko, Mobility prediction schemes in wireless ad hoc networks, in: B. Furht, T. A. Wysocki, A. Dadej, B. J. Wysocki (Eds.), Advanced Wired and Wireless Networks, Vol. 26 of Multimedia Systems and Applications, Springer US, 2005, pp. 171–186.
- [7] M. Musolesi, C. Mascolo, Designing mobility models based on social network theory, SIGMOBILE Mob. Comput. Commun. Rev. 11 (3) (2007) 59–70.
- [8] A. Ribeiro, R. C. Sofia, A survey on mobility models for wireless networks, Tech. Rep. SITI-TR-11-01, SITI, University Lusófona (Feb. 2011).
- [9] M. C. Gonzalez, C. A. Hidalgo, A.-L. Barabasi, Understanding individual human mobility patterns, Nature 453 (7196) (2008) 779–782.
- [10] B. C. Song, N. Z. Qu, A.-L. Barabasi, Limits of predictability in human mobility, Nature 327 (5968) (2010) 1018 – 1021.
- [11] A. Noulas, S. Scellato, N. Lathia, C. Mascolo, Mining user mobility features for next place prediction in location-based services, in: ICDM’12, 2012, pp. 1038–1043.
- [12] R. Sofia, Mobility management method and apparatus, EP 13186562.9, Method and Apparatus for Ranking Visited Networks (2013).