Generalizing Critical Path Analysis on Mobile Traffic
Abstract.
Critical Path Analysis (CPA) studies the delivery of webpages to identify page resources, their interrelations, as well as their impact on the page loading latency. Despite CPA being a generic methodology, its mechanisms have been applied only to browsers and web traffic, but those do not directly apply to study generic mobile apps. Likewise, web browsing represents only a small fraction of the overall mobile traffic. In this paper, we take a first step towards filling this gap by exploring how CPA can be performed for generic mobile applications. We propose Mobile Critical Path Analysis (MCPA), a methodology based on passive and active network measurements that is applicable to a broad set of apps to expose a fine-grained view of their traffic dynamics. We validate MCPA on popular apps across different categories and usage scenarios. We show that MCPA can identify user interactions with mobile apps only based on traffic monitoring, and the relevant network activities that are bottlenecks. Overall, we observe that apps spend 60% of time and 84% of bytes on critical traffic on average, corresponding to +22% time and +13% bytes than what observed for browsing.
1. Introduction
Web browsing has been at the core of Internet services since its early days. Significant attention has been devoted to define metrics (Bocchi et al., 2016; Hoßfeld et al., 2018; W3C, 2012; Brutlag et al., 2011) and methodologies (Wang et al., 2013; da Hora et al., 2018; Hoßfeld et al., 2018; Goel et al., 2016) to unveil web pages content delivery dynamics, and systems to optimize content delivery (Wang et al., 2016a; Kelton et al., 2017; Li et al., 2010; Butkiewicz et al., 2015). These efforts are justified to improve end-users quality of experience (QoE), while service providers are incentivized to optimize their systems as their revenues are linked to users QoE (Eaton, 2015).
However, web browsing is not at the center of user activities on mobile devices anymore. Recent reports (Colwyn, 2014; Blog, 2017) show that users spend less than 10% of their time browsing, and more than 35% on apps different than Facebook, streaming, gaming, and instant messaging. Such a trend is challenging also ads platforms where browsing on mobile devices generates half the conversion rate than desktop (Collins, 2017; Monetate, 2018).
This progressive change in user interests and usage patterns is creating a gap in the literature. State of the art metrics and methodologies have been forged in the context of web browsing, but they do not necessarily apply to generic mobile traffic. This is due to two main factors. First, there is the need to define a delivery deadline capturing how long it takes to obtain some content. The most popular example is the page load time (PLT), which measures the time elapsed between a user clicking a URL and the browser firing the onLoad event indicating that the page has been loaded. Given the definition, such metric exists only for browsers. A more generalized delivery deadline is the Speed Index (SI), which measures the average time at which the visible parts of the page are displayed (Google, 2008). By focusing on the rendering process, SI is generic enough to be applied to services other than browsing, but it is an invasive technique as requires video screen recording, so it is not suitable to be deployed at-scale. Overall, the literature offers a flourished set of metrics (Yslow, Object Index, DOMLoad, etc.) (Bocchi et al., 2016) but they all suffer from the lack of generalization or instrumentation complexity. Hence, the first challenge we identify is how can we define a delivery deadline that is generic enough and applicable to monitor generic mobile traffic?
Second, web pages structure is commonly leveraged to investigate content delivery performance. For instance, critical path analysis (CPA) aims to identify which objects download impact a defined delivery deadline (e.g., PLT), hence unveiling possible bottlenecks (Wang et al., 2013; Google, 2017; Butkiewicz et al., 2015). This analysis is possible because web page object relationships are easy to extract (e.g., inspecting source files, or the Document Object Model - DOM). Unfortunately, mobile content is not necessarily delivered in the form of a web page. Even if dependencies between objects are expected to be present, their identification is not trivial. Hence, the second challenge is how can we identify which flows carry critical content for QoE, and how they relate to each other?
In this paper we present MCPA, a methodology that generalises CPA for mobile traffic. MCPA brings fine-grained visibility into any mobile app traffic, and further highlights which components are critical. To do so, the traffic is processed in three phases. First, the traffic aggregate is split into activity windows, each (possibly) corresponding to different user interactions with an app. Second, within the activity windows, a download waterfall is constructed to capture traffic dynamics over time, different metrics related to L4 and L7 dynamics are collected, and a delivery deadline is established. Finally, within each waterfall we identify which activities impact performance.
We validate our methodology on 18 popular apps and web browsing as well, generating traffic from an instrumented Android phone. We show that using a purely based traffic monitoring methodology, MCPA is sufficient to capture fine-grained traffic dynamics. Specifically, we can split aggregate traffic into windows each associated to a different user action with more than 84% accuracy (section 5). We define two traffic metrics based on monitoring the volume of bytes exchanged, and show that they well resemble the more complex state of the art AFT and SI (section 6). Finally, we perform CPA by mean of active experiments. When considering browsing, MCPA output is a superset of the critical traffic identified by state of the art Google Lighthouse (Google, 2017). As for mobile applications, the time spent on the critical path is 55% in average, significantly larger than browsing where the time spent on critical path is 38%. We observe this time is mostly related to application control logic. MCPA source code and experimental datasets are publicly available.111https://github.com/finale80/mcpa
2. Related Work and MCPA challenges
Mobile traffic has mostly been studied at an aggregated level (per-connection latency, throughput, etc.) (Falaki et al., 2010; Le et al., 2015; Naboulsi et al., 2015; Rula and Bustamante, 2014), or focusing on specific protocols (e.g., DNS (Almeida et al., 2017), SPDY (Erman et al., 2013), MPTCP (Han et al., 2015; Han et al., [n. d.])). Exceptionally, a few studies take a step further. For instance, Panappticon (Zhang et al., 2013) and AppInsight (Ravindranath et al., 2012) enable fine-grained view on users engagement with apps by respectively tapping into Android components and studying app binary files; QoE Doctor (Chen et al., 2014) focuses on performance issues (e.g., high latency) by measuring radio resource allocation and user interface interactions; Prometheus (Aggarwal et al., 2014) tries to bridge network metrics with user experience via machine learning.
Despite their merits, these tools focus on system information (e.g., radio resources, operating system calls, multi-threading) rather than digging into the role of content download and network protocols dynamics. Conversely, studies focusing on web traffic, despite being limited to this traffic class only, represent the state of the art regarding how to dissect traffic dynamics. In the remainder of this section we review this literature, and we highlight the challenges in applying currently available methodologies to study generic mobile traffic.
2.1. Performance metrics and delivery deadlines
Beside generic metrics such as latency and throughput, most of the metrics in literature are defined in the context of web traffic. We can split those into two classes: objective metrics are delivery deadlines quantifying the time needed to obtain some content (Agababov et al., 2015; Erman et al., 2013; Falaki et al., 2010; Ma et al., 2015; Qian et al., 2014); subjective metrics are defined considering direct feedback from end-users (e.g., mean opinion score - MOS) and can include factors beyond content delivery (Bocchi et al., 2016; Gao et al., 2017; Kelton et al., 2017; Varvello et al., 2016). For the purpose of this work, we focus only on objective metrics, which we can further split into time instant and time integral metrics.
Time instant metrics capture specific instants across the whole events timeline of the content delivery. The most accurate instant metric is Google’s AFT which measures the time at which the content shown in the visible part of a webpage is completely rendered (Brutlag et al., 2011). This definition is not web traffic specific, although the metric has been applied only to browsing traffic. AFT computation requires a video screen capture, and accurate video post-processing as the presence of dynamic elements, such as animations and roll ads, can introduce biases (Varvello et al., 2016). These costs limit the use of AFT for small scale studies on instrumented devices. A recent work shows that AFT could be approximated leveraging information about objects position in a webpage, but this technique is complex to be applied outside browsers (da Hora et al., 2018). Despite being less accurate, PLT is the most widely adopted metric. Other known deadlines are the Time To First Byte (TTFB), the Time To First Pixel (TTFP), the time at which the parsing of the Document Object Model (DOM) is completed. W3C has also defined the navigation timing guidelines (W3C, 2018), a series of specific events happening during a webpage rendering, but their implementation may differ across browsers.
Time integral metrics capture the cumulative effect of events until a specific point in the timeline is reached. The most popular example is Google’s SI (Google, 2008), which is obtained by integrating over time the residual rendering left to reach the AFT. Given the definition, SI suffers from the same limitations AFT does. ObjectIndex and ByteIndex are two alternative integral metrics that respectively capture the evolution of objects and bytes delivery until the PLT (Bocchi et al., 2016).
Challenges: Metrics like PLT, which are based on internal application “hooks”, cannot be applied to generic mobile apps as there are no standard APIs, neither at app nor at operating system level, to expose these information. Differently, we argue that AFT and SI are valid delivery deadline for generic mobile apps, as they capture the actual screen rendering and do not depend on app internals (section 3). However, their measurement cost is a barrier for their adoption. To enable at-scale measurement, a cheaper alternative is to opt for metrics based on passive traffic measurement to compute either on-device (e.g., via VPN solution which avoid rooting devices) or in-network (e.g., monitoring middle-boxes are very common in mobile networks). We are therefore interested in understanding what passive metrics are available, when they can be applied, and what bias they introduce with respect to AFT and SI.
2.2. Critical Path Analysis - CPA
CPA allows to dissect traffic dynamics within the boundaries of a delivery deadline. It has been successfully applied to understand web traffic, but methodologies and terminology can vary. To the best of our knowledge, the first tool leveraging CPA is WProf (Wang et al., 2013) (and its follow ups Shandian (Wang et al., 2016b), and WProfX (wprofxWWW16)), a system that requires augmenting the browser with a profiling engine to capture the dependency graph for any given webpage. Such graph structures the activities related to both rendering as well as content dependencies as visible in the webpage DOM. Given a graph, WProf defines the critical path as the longest path of activities such that reducing the duration of any activity not on the critical path does not impact the webpage PLT.
Recently, Google added Lighthouse (Google, 2017) to the Chrome devtools suite to automate webpages auditing. Lighthouse offers a richer output than WProf, including different deadlines (First Meaningful Painting, First CPU idle, SpeedIndex, etc.), as well as a report on resources that can block the rendering. To some extent, Lighthouse output is an evolution of a webpage download waterfall, i.e., a gantt chart picturing the evolution of the network communications triggered during a webpage load. All modern browsers allow to dissect traffic dynamics via a waterfall, and systems like KLOTSKI (Butkiewicz et al., 2015) further build on waterfalls to find activity patterns invariant to PLT performance.
Challenge: All these tools have slightly different critical path definitions. They also heavily rely on “hooks” specific to browsers internals, so they are unappealing to study mobile apps. At the core of CPA there is the need to identify dependencies between activities, and this is particularly challenging to do only based on passive measurements. Hence, we want to understand if active experiments, such as traffic throttling, can complement passive measurements to create a more effective methodology to spot traffic impacting the delivery deadline.
3. MCPA Overview
In this section, we introduce MCPA, our methodology to perform CPA on generic mobile apps. First, MCPA identifies activity windows, i.e., user interactions with apps. Each activity window is profiled to extract network activities, measure the delivery deadline, and finally extract the critical traffic.
Activity windows (section 5). In the context of web traffic, CPA is performed for every webpage retrieval. This includes all activities in response to directly typing a URL, refreshing or aborting the load of a webpage, clicking a link within a page, etc. For webpages, those activities can be easily identified using APIs provided by browsers. However, such mechanisms are not available to study generic mobile apps, so alternative approaches need to be considered. One option is to log user clicks, scrolls, currently displayed apps, and use such detailed information to partition the traffic based on user engagement. However, in an at-scale scenario, i.e., without full control on the devices, logging actual user interactions is almost impossible. Another option available is to apply “cheaper” passive traffic analysis heuristics. In fact, mobile traffic is bursty in nature (Falaki et al., 2010; Stöber et al., 2013), i.e., the traffic presents activity windows when the user is interacting with the phone, interleaved by “idle” periods. An optimal split associates a different user action to each window, but depending on traffic conditions and apps characteristics this might not always be possible. In section 5 we discuss heuristics for partitioning the traffic based on passive measurements and we evaluate their accuracy.
Download waterfall and performance metrics (section 6). For each activity window we need to define a set of metrics and identify the activities involved in the delivery of contents. CPA for webpages requires to instrument the browser to extract all activities participating to both the download and rendering tasks. However, to do the same for generic mobile apps would require to either reverse engineer every app, or to instrument their source code or the operative system (Ravindranath et al., 2012; Zhang et al., 2013). The approach of MCPA is to focus only on network activities and to report per-flow metrics for both transport (TCP, UDP, QUIC) and application (DNS, HTTP, HTTPS/TLS, Facebook Zero - FB0) protocols. These activities are visually represented in the form of a download waterfall.
Once the different activities are identified, a delivery deadline should be set to capture the quality of experience perceived by users. In a fully controlled environment, the best available option is to apply AFT and SI (section 2). We argue they are still valid to study generic mobile traffic, but we are not aware of any work in the literature proving this. Indeed, the end of a user action on an app is generally marked by visual changes, and this applies to apps wrapping browser(-like) functionalities (e.g., social, news, e-commerce), as well as to more interactive apps such as messaging ones (e.g., the end of a message delivery triggers a check mark on screen). However, both AFT and SI capture events related to rendering. In an at-scale scenario screen recording is not possible, so rather than looking for exact estimates of user experience, we are interested in defining a proxy for AFT/SI, yet sufficient to identify critical activities, based on passive measurements. In section 6 we discuss how MCPA creates waterfalls, we introduce our delivery deadlines, and we compare them against AFT/SI.
Critical Path (section 7). Finally, MCPA identifies which activities of a waterfall constitute the critical path. To do so, we rely on active experiments, i.e., we observe how the delivery deadline changes when throttling the traffic on a per-domain basis. In other words, if a macroscopic delay is observed on the overall delivery when delaying some traffic, we can conclude that a domain, and the related traffic, is critical. The same principle also applies to discover relationships among domains.
MCPA is built upon pcap2har, a Python open source tool transforming pcap files into webpages HAR files,222https://github.com/andrewf/pcap2har which we modified and extended to handle generic mobile traffic (including TLS/HTTPS, QUIC, FB0).
4. Dataset
Mobile Apps. We select 18 popular apps across 7 categories: Social (Twitter, Facebook, Instagram), Messaging (WhatsApp, SnapChat, Messenger), News (CNN, BBC, Newsbreak), Geo-based (Google Maps, Uber), Shopping (Letgo, Amazon), E-mail (Microsoft Outlook, Gmail), and Streaming (Youtube, Spotify, Soundcloud). We intentionally left out Games and Productivity apps as they are known to generate little network traffic, which is likely related to ads (Almeida et al., 2018). Conversely, we focus on very popular apps according to both vendors (Sandvine, 2018), and 3rd party333https://www.androidrank.org rankings, to create a set of apps sufficiently diversified to assess if there is a case to use passive and active analysis to perform CPA. We further consider web browsing by studying the top-100 Alexa websites (alexa-T100).
Traffic Scenarios. We consider two traffic scenarios: app-startup and app-click. The former considers the traffic generated in the first 60s after the app is launched.444This time is more than double the maximum startup time observed in our experiments. In the latter, relevant user interaction sequences are emulated based on common behaviors with the apps, such as select a video/song, a news, scroll an email, send a chat message, etc. To this end, we define ad-hoc patterns, each with multiple input tap events uniformly distributed within [0,10s]. For example, for the Letgo shopping app, the sequence is: search by category; show top results; select random item; show price and geographical location (all sequences listed in Table 2).
Data collections. Our experiments are performed on a Nexus 5 running Android 6.0.1, and using a SIM of a European mobile carrier. For each app and scenario we ran 10 experiments, with the device instrumented to collect pcap files (via tcpdump) as well as the video screen record (via Android screenrecord utility555https://developer.android.com/studio/command-line/adb). For alexa-T100 dataset, we also use WProfX, Google Lighthouse and Chrome’s devtools to extract performance indicators and critical path information. In regards to video recording, as shown in (Bocchi et al., 2016) the additional computation can bias the experiments, artificially slowing the rendering. We verified that this effect is not present in our results (section 6).
5. Activity Windows
Mobile devices are constantly connected to the network, so they generate a continuous stream of connections. Conversely, user engagement is occasional, hence the connections stream has to be processed in order to identify those time intervals where users interact with the device. Ideally, the traffic stream should be split so that each partition corresponds to a relevant QoE-related user interaction. We call these partitions activity windows. Such windows can be obtained using granular device-screen logs reporting on clicks, scrolls, etc., at the cost of running tests only on a limited set of instrumented phones.
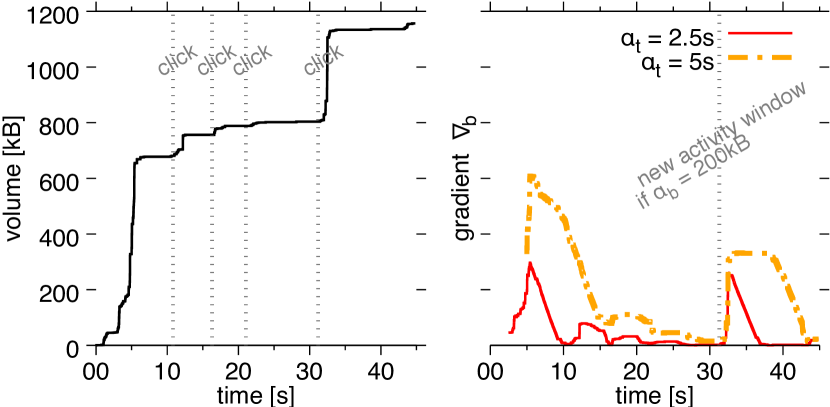
To enable large scale analysis built on network measurements, the same split should be performed by looking at traffic characteristics only. To this end, we can exploit the bursty nature of mobile traffic, where bursts of bytes are likely to correspond to user engagement with an app. For instance, consider Fig 1(left) showing the cumulative traffic observed when a user interacts with the CNN app. Notice how volume abruptly increases in response to users actions. In this section we investigate how and to what extent traffic bursts and idle periods can be used to identify activity windows.
5.1. Partitioning policies.
We consider two possible policies to partition the traffic generated by a mobile device.
Naïve. The first policy relies on a single threshold to identify “long” idle periods. That is, a connection is associated to a new window if its traffic starts after an idle period longer than , otherwise it belongs to the current window.
Gradient. A more refined policy creates a new window if a “large” burst happens after a “long” idle period. To do so, we combine two thresholds: and . We use to define a sliding window where we monitor the gradient of the volume. For instance, consider = 5s. All traffic in the first 5s is accumulated. Then, we progress the sliding window, accumulating the traffic entering, and removing the one falling outside the window. In this way has a positive slope when traffic is exchanged, and negative (or no) slope for idle times. Fig. 1(right) reports for = 2.5s and = 5s. Using the gradient, we define a new activity window if we observe at least bytes exchanged after an idle period of . For instance, considering = 200kB, in Fig. 1(right) reaches the threshold at 5.2s and 32s. However, we identify an activity windows only at 32s as it is preceded by an idle larger than = 2.5s (no windows found for = 5s).
5.2. Validation and sensitivity analysis
Our dataset contains detailed logs of the users click times, each click corresponding to the beginning of a new activity window. As such, for a given combination of thresholds, we can quantify the accuracy of the partitioning by measuring the Precision as the fraction of partitions detected by our policies actually matching a click, and the Recall as the fraction of clicks that are identified as activity windows by our policies. For instance, in Fig. 1 Precision = 1.0 and Recall = 0.25.
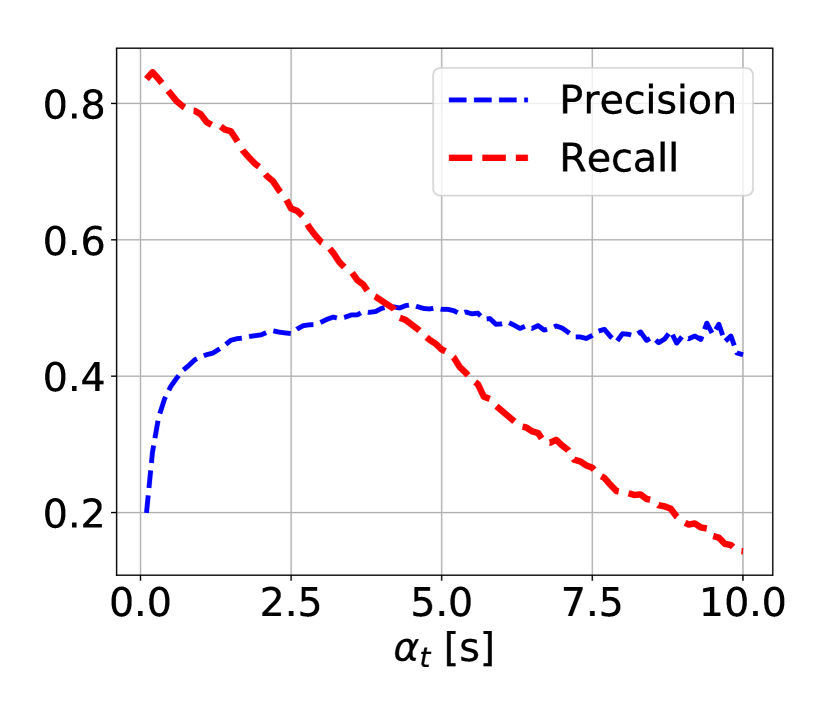
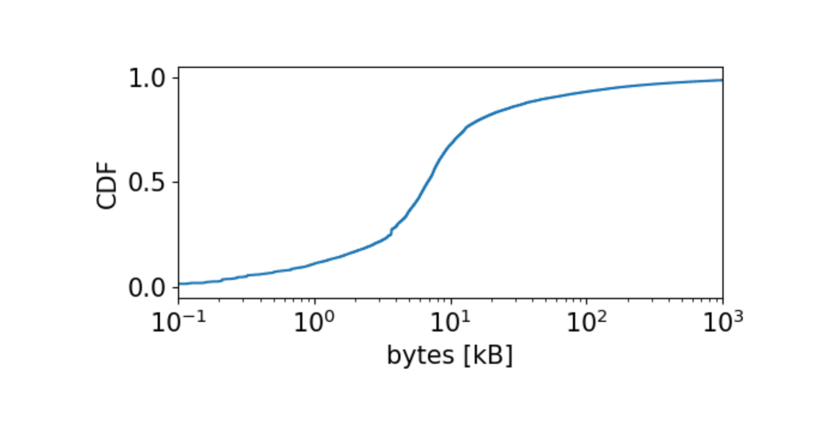
Best policy. We find the naïve policy being ineffective. Fig. 2 report Precision and Recall for different values of . A small threshold ( 1s) leads to over-splitting (high Recall, but low Precision), while for larger values Recall and Precision do not go above 50%. Compared to naïve, the gradient policy, which considers bursts registered after idle periods, significantly reduces the over-splitting. By selecting = 5kB and = 1s, both Recall and Precision are kept above 70%. We choose to be the median size of a individual transaction as observed in logs from a large European mobile operator. Results are reported in Fig. 3, and are consistent with our datasets. Instead, = 1s is considered as a minimum response time of a user engaging with mobile apps.
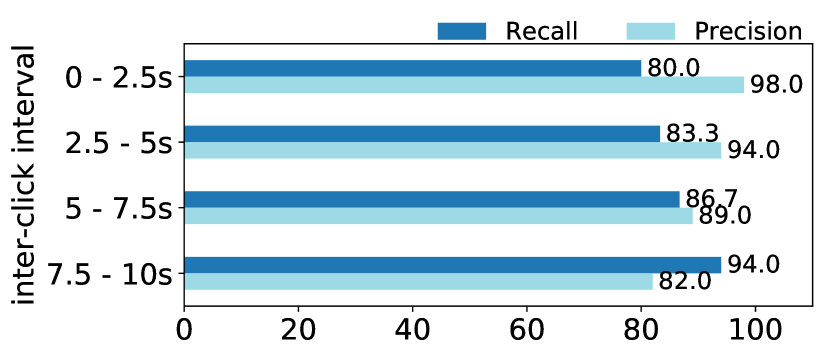
Interactivity. We also investigate whether our policy is sensible to clicks frequency. Fig. 4 reports Precision and Recall across all apps when varying the frequency of clicks. Both metrics are above 80% in all scenarions, but there are two evident trends: Precision decreases when clicks are more sparse, while opposite is true for Recall.
Further improvements. Performing a grid search to find thresholds better than the ones selected based on our intuition did not help. However, we found most of the misclassification are due to chat apps. Intuitively, as those apps typically exchange small messages (unless they are video/audio messages, or images), = 5kB is too large. Indeed, applying = 0.25kB only for this app category leads to Recall = 85% and Precision = 88% across all apps. Although these fine-grained optimizations could be done on a per-app basis, we argue this is unnecessary, and would be also challenging considering the large numbers of apps currently available. In fact, even if our analysis is not exhaustive, two pairs of thresholds cover a very diversified set of apps. In order to select which pairs of thresholds to use, we found that basic traffic classification techniques, based on port numbers, IP addresses, or domain names, are sufficient. For instance, chat applications use very few (and specific) domains and/or ports (section 7).
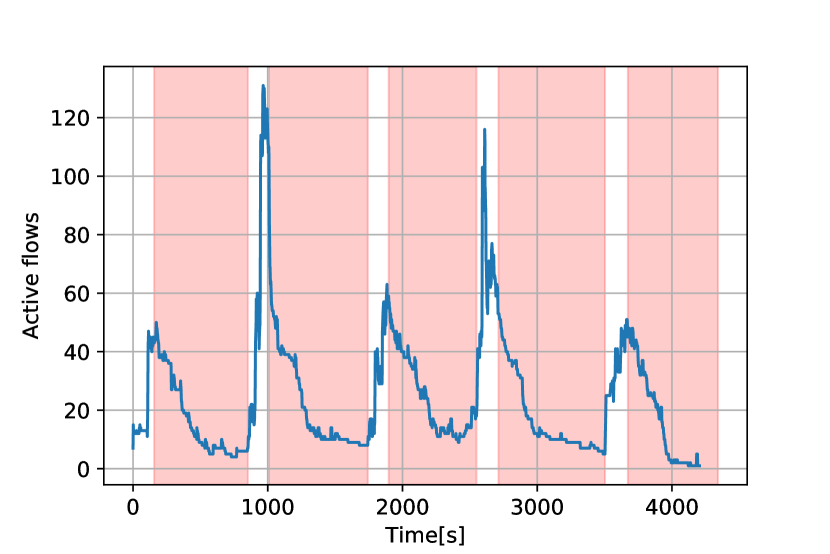
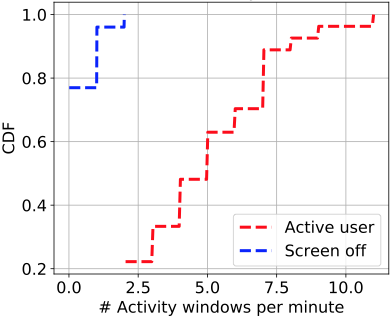
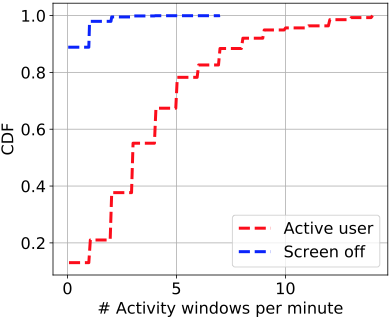
Background traffic. One last aspect to consider is the impact of “background” traffic (notifications, emails fetch, etc.) on the windows partitioning accuracy. We collected several 1-day long traces, mixing periods of activity with silence. Fig. 5 details one of those examples, showing the number of active flows highlighting periods where the screen was on (white background) and off (shaded background). Notice how when the screen is on, i.e., the user is engaging with the phone, the number of flows increases, while when the screen is off flows are progressively closed. Given the tendency to use persistent connections, flows are closed at a lower pace with respect to when they are opened. We observe that, while the gradient policy is still sensible to background traffic, those intervals (i.e., with no user interaction) can be filtered out by looking at the pace at which activity windows are generated. Intuitively, when the user is active, multiple partitions are expected to be generated in a short time, while this effect is significantly reduced when only background traffic is present. Fig. 6 shows this effect for both artificial clicks (monkey - left plot) and a real user (right plot). Notice how the distribution of rate at which the windows are created is macroscopically separated between periods when the screen is on and off.
Summary. Our results support the idea of identifying activity windows via passive measurements. We stress that the gradient policy is a heuristic, so not meant to be perfect. Its function is to enable us to focus on traffic dynamics and CPA knowing that the portion of the traffic under analysis is likely related to user engagement, hence meaningful to be dissected.
6. Network Waterfall and Metrics
For each identified activity window, MCPA creates a download waterfall detailing traffic dynamics and performance.
Network waterfall. MCPA extracts transport (L4) and application (L7) per-flow metrics. At L4, it computes aggregated statistics (e.g., total duration, bytes, RTT), as well as protocol specific information (e.g., TCP, QUIC, FB0 handshake duration, IP addresses, ports). At L7, MCPA reports on HTTP transactions (e.g., metadata from request and response headers), TLS handshake (e.g., duration, if the handshake is full or fast, SNI, ALP protocols), DNS (e.g., domain name, CNAMEs, query resoution time). Moreover, each flow is split into bursts by grouping packets when interleaved by more than 2 RTTs. All the metrics are then represented as a download waterfall, a relevant visual aid to CPA (section 7).
Performance metrics. As discussed in section 2, we consider AFT and SI suitable to study mobile apps traffic. However, we consider them only as baseline as we aim to avoid on-device screen recording. We are instead interested in studying the reliability of objective metrics based on passive traffic measurements. We define the instant metric Transport Delivery Time (TDT) as the time between the beginning of an activity window and the 95th percentile of the whole volume exchanged in the window. We experimented with other percentiles too (see paragraph below), but the 95th resulted the more robust to long tail effect (e.g., keep alive). We also define the equivalent integral metric Transport Delivery Index (TDI) as , where is the percentage of total volume exchanged in the window up to time . We highlight that TDI is similar to the Object Index introduced in (Bocchi et al., 2016) using TDT instead of PLT (recall that PLT does not apply for generic mobile apps section 2). In the remainder of the section we investigate the penalties TDT and TDI introduce against the respective baselines AFT and SI. We consider also PLT as reference for browsing performance.
6.1. Evaluation
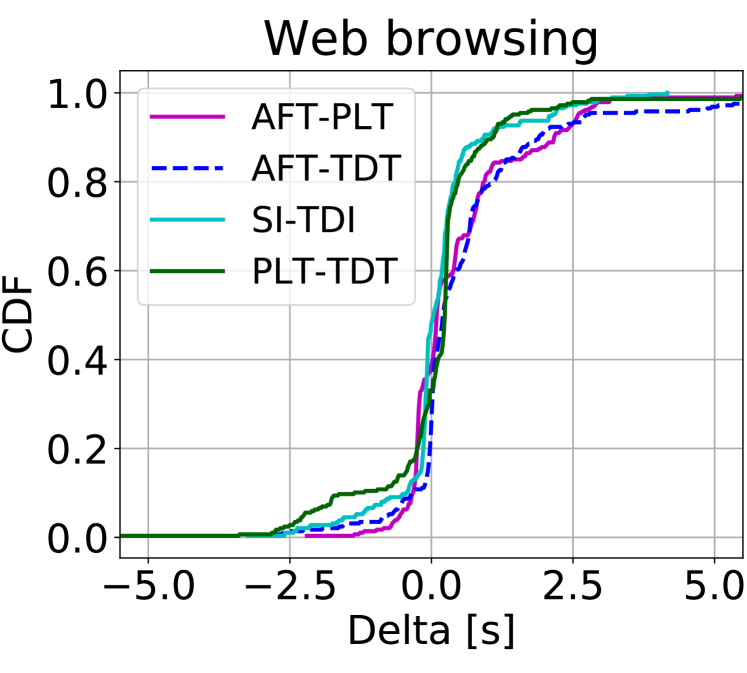
Web Browsing. Fig. 7(left) reports the Cumulative Distribution Function (CDF) of the deltas AFT-TDT and SI-TDI for alexa-T100 dataset. Both are well centered around zero, but TDI is a better proxy of SI than TDT is for AFT. Notice however that AFT-PLT presents a similar distribution as AFT-TDT. In other words, if PLT is the most popular metric to measure web performance, TDT is at least comparable. This is further corroborated considering PLT-TDT which presents a distribution well centered around zero.
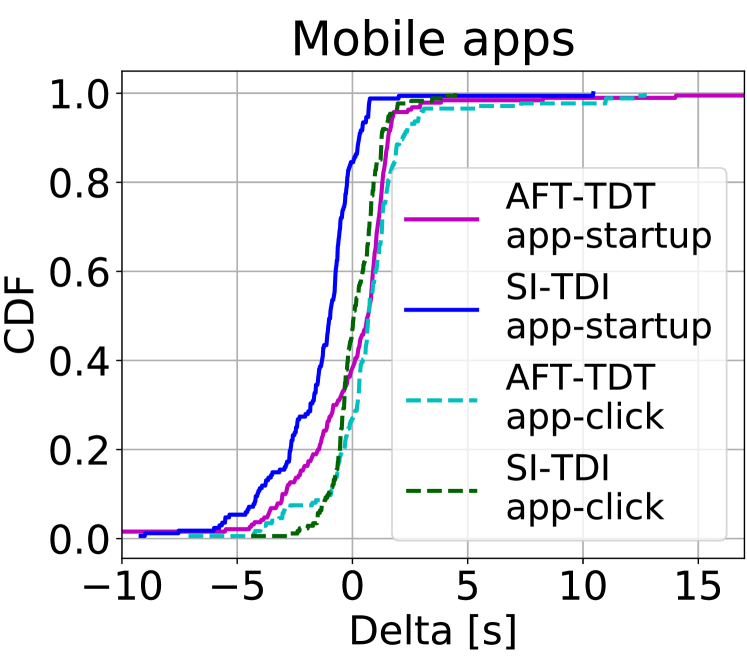
Aggregate apps traffic. Fig. 7(right) reports the CDFs of AFT-TDT and SI-TDI deltas for both app-startup and app-click datasets. All curves are well centered around zero, but app-startup CDFs present a heavier negative tail. This resembles what was observed for browsing, i.e., at startup more content is downloaded than what is required for the visualization, so TDT and TDI can over-estimate rendering deadlines. TDI is more sensible to this effect, while for 75% of the experiments TDT generates a 1.3s error at most.
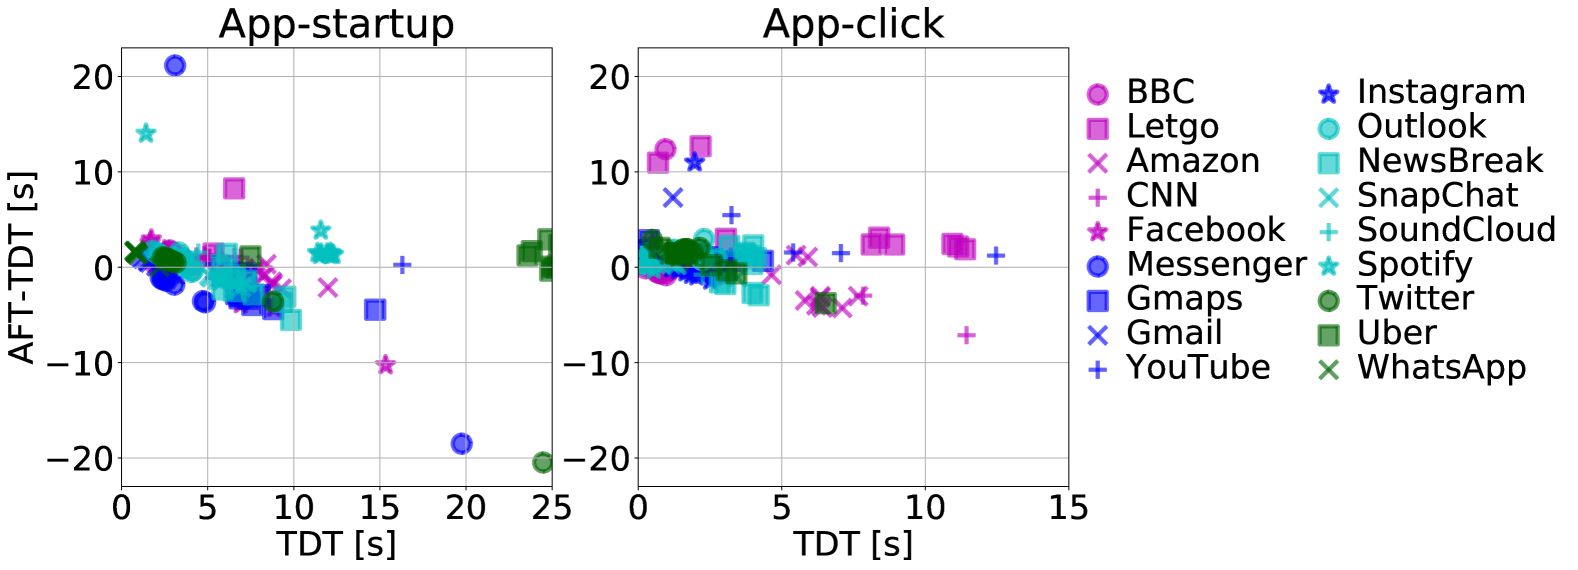
Per-app traffic. To further investigate the deviations between instant metrics, Fig. 8 reports the deltas AFT-TDT as a function of TDT for each individual app. Considering app-startup (left plot), besides a few outliers, all apps present similar behavior, with variable deadlines in absolute scale, but TDT is triggered slightly after AFT as already observed in Fig.7(right). For app-click (right plot) errors are further reduced, with only Amazon showing larger penalties.
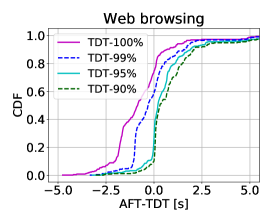
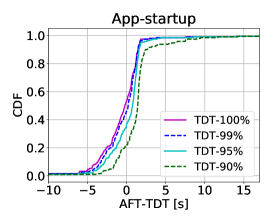
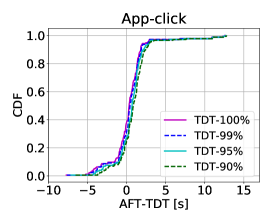
TDT sensitivity to percentiles. TDT and TDI capture the progress of the download by means of a percentile. The analysis previously reported refers to the 95th percentile of the volume transfered within an activity window, but other values are possible. To better investigate the sensitivity of selecting the percentile to use, Fig. 9 reports the CDFs of the delta AFT-TDT for web browsing, app-startup, and app-click respectively. Intuitively, selecting a high percentile can expose the passive metrics to pre-fetching, i.e., the delivery deadline triggers too late due to content downloaded even if not required for the rendering. Conversely, a small value instead cause the opposite effect, i.e., the deadline triggers too early. Both effects are clearly visible in Fig 9 CDFs. Considering browsing (left plot) waiting until all content is downloaded (TDT-100%) results is a macroscopic delay with respect to AFT, while 95th and 90th present fairly similar performance. Considering app traffic, app-startup (middle plot), high percetiles give similar performance, while the 90th percentile is less accurate; app-click (right plot) presents very little differences. Overall, we selected the 95th percentile to define TDT and TDI as it provides more consistent performance across the different types of traffic.
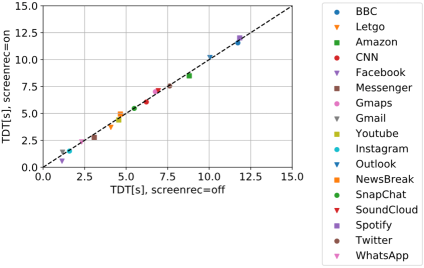
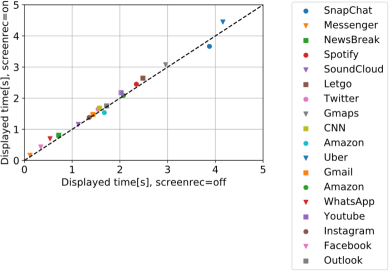
Impact of screen recording. As the video screen record can be resource demanding, it can bias the measurement of AFT and SI, as well as our defined deadline TDT and TDI. To investigate on this, we consider the apps startup, and run 10 experiments for each app with and without Android screenrecord enabled. For each experiment we collect two metrics: TDT over the app startup activity window, and the Displayed time666https://developer.android.com/topic/performance/vitals/launch-time provided by Android Activity Manager777https://developer.android.com/reference/android/app/ActivityManager via logcat for those activities involved in the app startup (e.g., launching the process, initializing the objects, creating the activity, inflating the layout, and drawing the application for the first time). In other words, we are interested in understanding if (and by how much) these deadline changes in the presence of the screen record with respect to the bytes exchanged, as well as the dynamics of the apps. In Fig 10 we compare the median TDT (left) and Displayed times (right) across apps and experiments. Notice how the points are well distributed over the bisect line, with only two corner cases for the Display time (Uber and Whatsapp). With an error generally lower than 1%, we can conclude that for the apps under study the impact of the screen record is marginal.
Summary. The analysis shows that metrics purely based on passive traffic monitoring are a reasonable approximation of AFT and SI, and at least as good as popular metrics such as PLT. This brings visibility on apps dynamics when AFT and SI cannot be measured, and more broadly they can significantly simplify QoE/performance analysis. There are clearly some corner cases and occasional outliers, as not all apps behave the same, but our analysis shows that TDT and TDI are reasonable heuristics to qualitatively capture delivery deadlines.






7. Critical Path Analysis
CPA tools for browsing define the critical path based on a dependency graph capturing the relations between objects downloaded (section 2.2). This graph is constructed “passively” exploiting the DOM built by the browser when rendering the webpage; however this technique is not applicable to generic mobile apps. Therefore, to discover critical traffic, MCPA uses an “active” approach based on traffic throttling. We use the tc utility to throttle one domain at a time to 1kb/s, and test the impact on the activity window delivery deadline. In particular, for each throttling scenario we perform 10 runs applying a p-value test (with as significance level) to accept or reject the null hypothesis: a domain is critical if the deadline is always delayed across runs. Likewise, a similar test is applied to discover dependencies among domains (i.e., by delaying domain A also domain B is delayed).
Overall, we define Critical Set (CS) as the set of domains impacting the delivery deadline, and we use it to create a dependency graph among domains. We define Critical Path (CP) as the whole set of flows generated by the CS. In other words, similarly to Lighthouse, MCPA CP is defined based only on network traffic, but it captures the whole traffic activities of a flow, rather than pinpointing specific objects/requests. It follows that the time on CP is the sum of time intervals where at least 1 critical flow is active. In the remainder of the section, we first present some examples of CPA on specific apps. Then, we discuss traffic properties across apps.
7.1. Dissecting individual apps traffic
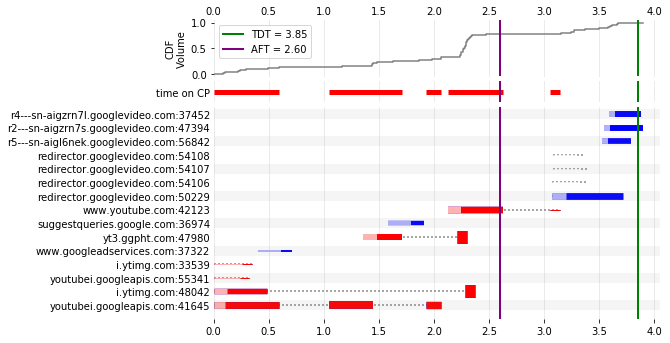
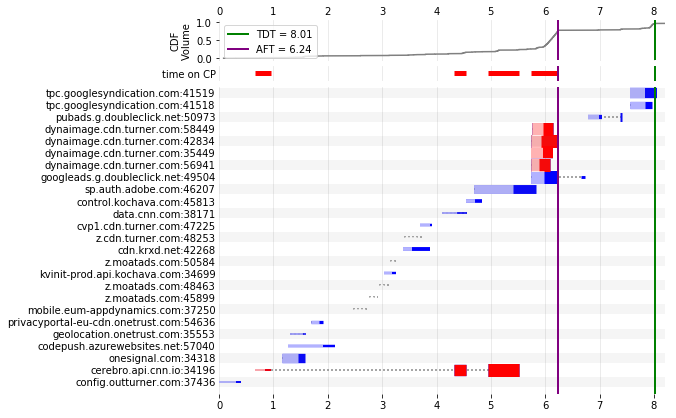
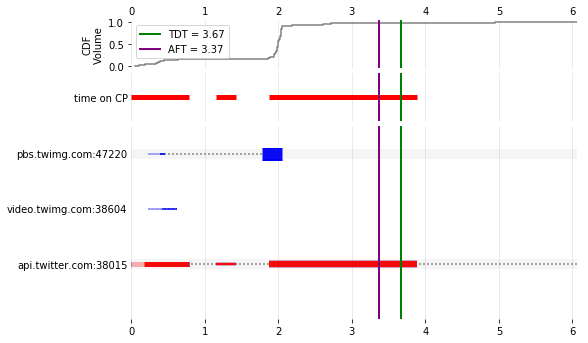
Fig. 11, Fig. 13, and Fig. 14 details the startup traffic dynamics for YouTube, CNN, and Twitter apps respectively by stacking 6 views of the traffic: dependency graph, download waterfall, time on CP, CDF of the bytes exchanged, and a film strip showing the screen rendering progress. The dependency graphs show only domains having at least one dependency. In the download waterfall each row corresponds to a different flow (labeled with domain and destination port). Horizontal lines show bursts carried by flows (section 6), colored red if found critical (blue otherwise), while dotted lines indicate idle periods. Saturated colors reflect exchange of data, while pale ones correspond to DNS and handshakes (TCP, TLS, or QUIC). Finally, two vertical lines mark the AFT and TDT deadlines.
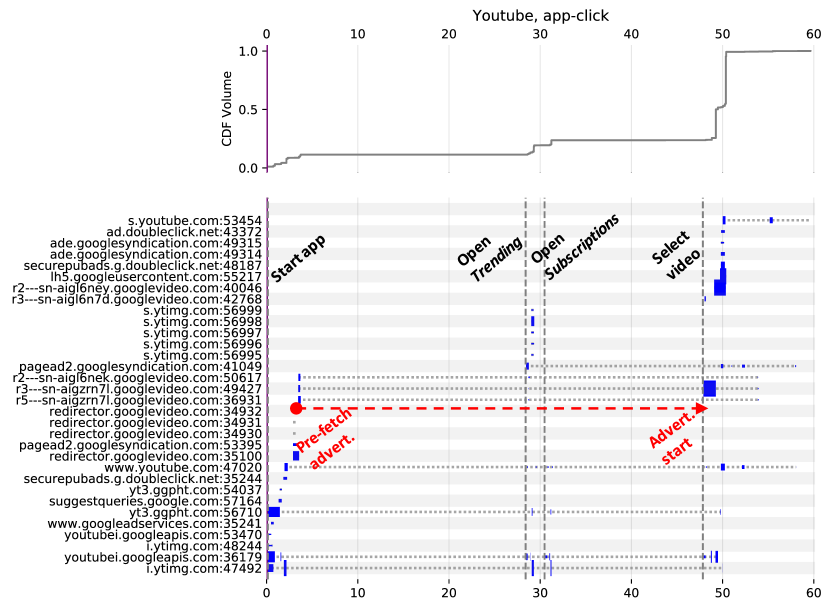
YouTube. Focusing on YouTube, the traffic before the AFT is almost entirely critical. This is composed of a mix of images (i.ytimg.com handles video thumbnails, while yt3.ggpht.com handles user related content such as avatars), control, and other structural elements of the app (e.g., fonts, javascripts). The download idle times hint to rendering cycles (fetch process render iterate), as also confirmed by the film strip showing a “dummy” loading screen used to hide the actual rendering process. TDT is delayed due to video pre-fetching. This is confirmed by app-click, where we observe the portion of video left being delivered on the already opened flows when the playback is triggered. An example is shown in Fig. 12. After 4 requests to redirector.google.com, three flows are opened towards video caches (r5—sn-aigzrn7l.googlevideo.com, r3—sn-aigzrn7l.googlevideo.com, and r2—sn-aigl6nek.googlevideo.com). At around 28s and 30s, the trending videos tab and the subscriptions tab are opened, respectively. Finally, at 47s the video playback is triggered. Notice however how a “blob” of content is carried through the connection opened earlier and correspond to a video ad, while the actual video is downloaded from a different video cache (r2—sn-aigl6ney.googlevideo.com).
CNN. Differently from YouTube, the majority of the traffic for the CNN app is not critical. After contacting cerebro.api.cnn.io (possibly a control domain), there are about 3s busy with only 3rd party and ads services communications, none of which is critical. Finally the control goes back to cerebro.api.cnn.io which triggers the rest of the critical traffic (dynaimage.cdn.turner.com). As for YouTube, rendering phases are possibly hidden by the loading screen, but more interesting is the macroscopic impact of 3rd party traffic which accounts for 55% of the overall deadline.
Twitter. The Twitter app instead has a very simple waterfall: only 3 flows, all twitter related, with only 1 being critical. We interpret this minimalist approach as an explicit design choice, but it would be interesting to know if applying content sharding and a few more flows could further reduce loading latency.
| App-startup | |||||||||||
| fl. | dom. | vol.[kB] | TC[s] | TC break [%] | |||||||
| abs | % | abs | % | abs | % | abs | % | dns | hshake | data | |
| 5 | 38 | 1 | 13 | 33 | 79 | 4 | 77 | 0 | 32 | 68 | |
| 2 | 40 | 2 | 40 | 836 | 97 | 9 | 61 | 1 | 6.3 | 92.7 | |
| 9 | 56 | 2 | 25 | 1108 | 97 | 4 | 80 | 0 | 11.6 | 88.4 | |
| 2 | 100 | 1 | 100 | 4 | 100 | 1 | 100 | 9 | 6 | 85 | |
| Snapchat | 8 | 80 | 4 | 50 | 2802 | 91 | 11 | 70 | 3 | 23 | 74 |
| Messenger | 4 | 57 | 3 | 50 | 86 | 72 | 2 | 63 | 0 | 31.8 | 68.2 |
| CNN | 10 | 59 | 2 | 13 | 25 | 31 | 3 | 38 | 15 | 19.6 | 64.4 |
| BBC | 6 | 75 | 2 | 50 | 98 | 96 | 1 | 21 | 0 | 29 | 71 |
| NewsBreak | 27 | 66 | 5 | 25 | 152 | 92 | 5 | 63 | 0 | 20 | 80 |
| Gmaps | 17 | 65 | 6 | 46 | 870 | 99 | 4 | 57 | 0 | 37 | 63 |
| Uber | 13 | 59 | 6 | 43 | 238 | 95 | 13 | 53 | 0 | 25 | 75 |
| Letgo | 10 | 56 | 3 | 30 | 715 | 97 | 1 | 18 | 6 | 31 | 63 |
| Amazon | 33 | 67 | 5 | 45 | 1490 | 96 | 7 | 84 | 0.4 | 30.6 | 69 |
| Gmail | 1 | 14 | 1 | 20 | 16 | 91 | 2 | 82 | 0 | 46.5 | 53.5 |
| Outlook | 4 | 57 | 2 | 50 | 20 | 91 | 2 | 79 | 3 | 32 | 65 |
| Youtube | 10 | 63 | 4 | 36 | 127 | 84 | 3 | 46 | 5.8 | 25 | 69.2 |
| SoundCloud | 10 | 43 | 2 | 20 | 715 | 99 | 8 | 76 | 0 | 84 | 78 |
| Spotify | 1 | 13 | 2 | 25 | 78 | 95 | 5 | 59 | 1 | 15 | 84 |
| AVERAGE | 10 | 56 | 3 | 38 | 523 | 89 | 5 | 63 | 2.5 | 24.8 | 72.7 |
| Browsing | 12 | 48 | 5 | 37 | 488 | 71 | 5.53 | 38 | 2.6 | 21.5 | 76 |
| App-click | ||||||||||
| fl. | dom. | vol.[kB] | TC[s] | TC break [%] | ||||||
| abs | % | abs | % | abs | % | abs | % | dns | hshake | data |
| 1 | 13 | 1 | 25 | 29 | 96 | 19 | 44 | 0 | 0 | 100 |
| 3 | 60 | 2 | 40 | 1313 | 63 | 5 | 54 | 6 | 10 | 84 |
| 4 | 57 | 1 | 50 | 1538 | 90 | 2 | 50 | 0 | 0 | 100 |
| 1 | 100 | 1 | 100 | 1 | 100 | 1 | 100 | 0 | 0 | 100 |
| 2 | 22 | 1 | 33 | 194 | 75 | 6 | 17 | 2 | 7 | 91 |
| 2 | 40 | 2 | 67 | 20 | 79 | 10 | 35 | 0 | 2 | 98 |
| 3 | 25 | 2 | 40 | 69 | 82 | 1 | 55 | 0 | 3 | 97 |
| 4 | 36 | 2 | 67 | 105 | 92 | 1 | 67 | 0 | 22 | 78 |
| 19 | 43 | 7 | 78 | 96 | 20 | 3 | 73 | 0 | 13 | 87 |
| 3 | 60 | 2 | 100 | 870 | 98 | 2 | 52 | 0 | 0 | 100 |
| 3 | 43 | 1 | 50 | 13 | 11 | 5 | 85 | 0 | 0 | 100 |
| 5 | 100 | 2 | 100 | 65 | 100 | 2 | 100 | 0 | 6 | 94 |
| 21 | 34 | 4 | 36 | 1650 | 92 | 12 | 80 | 0 | 6 | 94 |
| 6 | 55 | 2 | 40 | 38 | 75 | 11 | 21 | 0 | 7 | 93 |
| 5 | 83 | 3 | 75 | 9 | 100 | 0 | 35 | 0 | 75 | 25 |
| 5 | 45 | 1 | 20 | 65 | 47 | 1 | 31 | 0 | 67 | 35 |
| 1 | 17 | 1 | 33 | 120 | 99 | 1 | 44 | 0 | 0 | 100 |
| 3 | 30 | 1 | 50 | 115 | 98 | 0 | 52 | 0 | 0 | 100 |
| 5 | 48 | 2 | 56 | 351 | 79 | 4 | 55 | 0 | 12 | 88 |
7.2. Critical traffic properties across apps
Table 1 summarizes the critical traffic properties for both app-startup (left) and app-click (right). For each app we report the number of critical flows, domains, bytes both in absolute and percentage averaged across different runs. We also report the time spent on the critical path (TC) and how this is spent doing DNS, transport handshakes, and data transfers. Table rows are grouped by app categories.
Traffic volume. On average, 56% (48%) of flows, 89% (79%) of bytes are critical in app-startup (app-click). Differently from what we expected, in absolute scale the volume of bytes is still significant in app-click (351kB on average, almost 70% of the average volume in app-startup). Considering domains, 38% are critical in app-startup startup against 56% for app-click. There are macroscopic differences between apps, but no visible patterns within and between categories or scenarios. For instance, Whatsapp is an “outlier” as all traffic is carried over 1-2 flows, hence everything is critical. The only class that seems different is web browsing, which presents 48% (71%) of critical flows (bytes), -8% (-18%) with respect to apps startup.
Time on CP. For browsing also TC is lower, 38% against 63% (55%) in app-startup (app-click). On the other hand, for both browsing and apps TC is similar in absolute scale (4-5s). In other words, despite the diversity in the actions triggered, results suggest that the differences in the critical traffic between startup and actual app usage could be less pronounced that one might think. As expected, data transfer has the largest impact on the critical path with 72.7% (88%) for app-startup (app-click). DNS is generally small except for a few cases. Conversely, protocol handshakes are heavier at startup (24.8% on average), but app-click shows unexpected bi-modal behaviour with either a heavy (e.g., 67% YouTube, 10% Facebook) or negligible weight.
Content type analysis. Extracting keywords from the domains, we split the traffic in 3 classes: ad-hoc (apps/websites specific domains), cdn, and oth-serv (e.g., 3rd party services, ad networks). We find that for apps (browsing) TC is split into 68% (33%), 25% (51%), and 7% (15%), while volume is split into 47% (25%), 52% (65%), and 1% (9%) for ad-hoc, cdn, and oth-serv respectively. In other words, apps network latency tends to gravitate towards app-specific domains. Those are not necessarily responsible only for control logic as they carry almost the same volume as CDNs. Conversely, browsing content is likely served by CDNs. Considering oth-serv, browsing spends 2 TC than apps, but downloads 9 more volume than apps.
8. Discussion
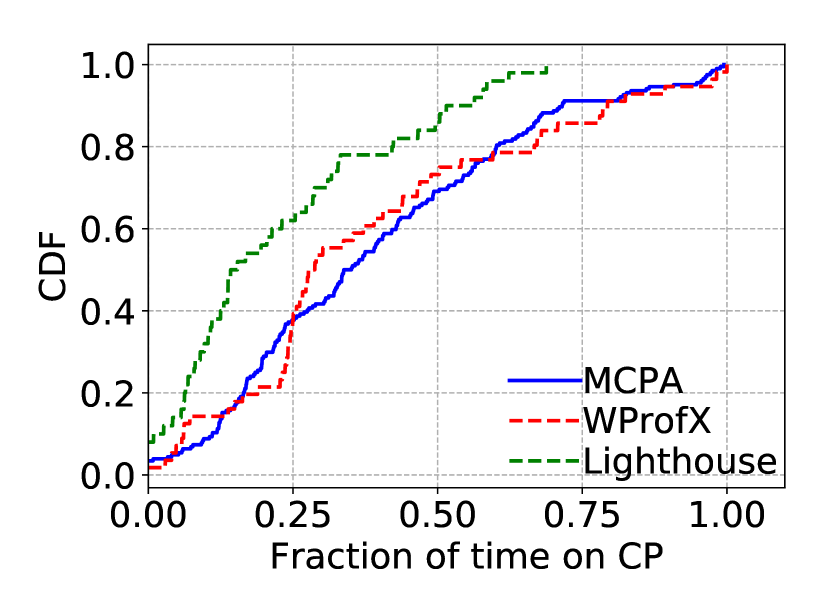
MCPA aims to identify critical traffic generated by generic mobile apps. A few other CPA tools for mobile apps have been presented, but none of them are applicable to our intent as they either require heavy on-device instrumentation or do not dissect traffic dynamics (Ravindranath et al., 2012; Zhang et al., 2013). However, restricting the focus to web browsing only, we can compare MCPA with WProfX (the WProf version for mobile browsing) and Google Lighthouse, both open sourced. Fig. 15 shows the CDF of the fraction of time on CP for the three tools. We highlight that for MCPA and Lighthouse, time on CP implicitly refers to only network activities, while WProfX reports also on parsing and rendering time, which we exclude for the comparison.
WProfX profiles the impact of webpages loading activities on PLT. Notice the strong similarity of MCPA and WProfX CDFs, with both tools reporting 38% of time on CP on average. This implies that MCPA, even if based on traffic analysis only, is comparable with an in-browser profiling engine.
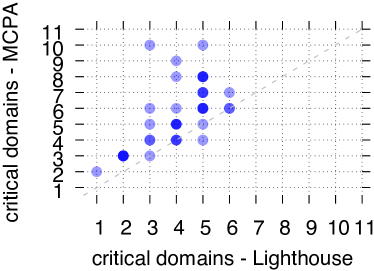
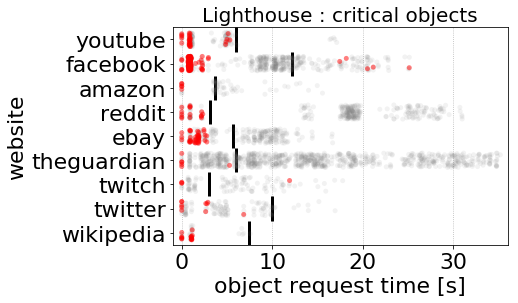
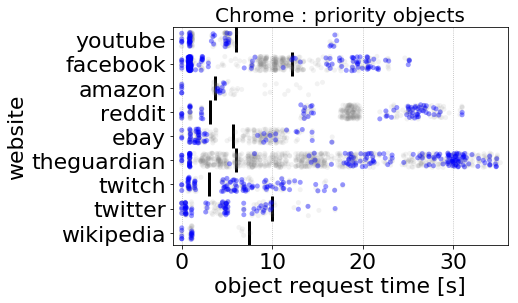
Lighthouse reports the webpage Critical Request Chains (CRCs) pinpointing to objects generating bottlenecks.888https://developers.google.com/web/tools/lighthouse/audits/critical-request-chains As visible in Fig. 15, Lighthouse reports a shorter time on CP than both WProfX and MCPA. We found that MCPA generally classifies a few more domains as critical than Lighthouse (Fig. 16), but the same is true for WProfX too. The reason of the discrepancy resulted clear only by investigating Lighthouse source code, i.e., it is due to an internal design choice not publicly documented. Specifically, Lighthouse marks objects as critical if they have a network priority higher than medium (i.e., the browser schedules objects fetch early on), and they are neither images, XML HTTP Request (XHR), nor server push(ed) content. This results in a “constrained” view of the traffic as reported for a subset of websites by the strip-plots in Fig. 17: grey dots represent all requests; red dots (left plot) mark critical objects; blue dots (right plot) marks prioritized objects; vertical black lines mark the AFT. Notice how Lighthouse is biased towards the first part of the download, which possibly involves only “structural” properties of the webpage rather than actual content.
Beside the fine-grained details, the tools comparison highlights a more subtle problem: the lack of standard methodologies to pinpoint what is critical, and how to perform root cause analysis related to those bottlenecks. These goals go beyond the purpose of our work, which instead addresses a prior and more fundamental requirement: to ease the study of generic mobile apps. We demonstrated that network measurements can be effective and easier to adopt than rendering based metrics such as AFT/SI. Moreover, our definition of critical path aims to discover any critical network activity without any restriction on the type, so to capture traffic dynamics as a whole. To test MCPA we adopted the standard practice of an instrumented device, with the intention to demonstrate that this might not be necessary. This can open the doors to a new class of tools easier to deploy than current state of the art techniques, without significantly sacrificing accuracy. In this way, app developers and mobile operators could better dissect traffic dynamics (e.g., TCP/TLS handshake, TCP fast open (Radhakrishnan et al., 2011), app-specific protocols, control logic, or pre-fetching) by means of at-scale measurement campaigns.
| app name | package name | usage pattern |
|---|---|---|
| com.twitter.android | start app; open trending now; select top result; select top tweet; refresh home. | |
| com.facebook.katana | start app; move to notifications; select top notification; move back to home; refresh home. | |
| com.instagram.android | start app; open search tab; move back to home (refresh); open story from top bar. | |
| com.whatsapp | start app; select top conversation; type random message and send (x3). | |
| Snapchat | com.snapchat.android | start app; select friend from list; grab and send picture (x3). |
| Messenger | com.facebook.orca critical | start app; open top conversation; type random message and send (x3). |
| CNN | com.cnn.mobile.android.phone | start app; open top news; open next news; move back to homepage; open CNN video portal |
| BBC | bbc.mobile.news.uk | start app; open top news; move to popular news list; move back to homepage; open My News area. |
| NewsBreak | com.particlenews.newsbreak | start app; move to news category (e.g., World, Business); open top result; move to next category; open top result. |
| Gmaps | com.google.android.apps.maps | start app; open tab explore restaurants; select top result; tap on indications; show route info. |
| Uber | com.ubercab | start app; open search box; select destination from history; cancel; back to homepage. |
| Letgo | com.abtnprojects.ambatana | start app; open random item category (e.g., tech); open top offer; tap on more info to display item details (including geographical location); move to different category. |
| Amazon | com.amazon.mShop.android.shopping | start app; open side menu; select top offers; select top item; open item details page. |
| Gmail | com.google.android.gm | start app; open random email from inbox; open reply tab; send empty reply; move back to inbox. |
| Outlook | com.microsoft.office.outlook | start app; open random email from inbox; open reply tab; send empty reply; move back to inbox. |
| Youtube | com.google.android.youtube | start app; move to trending tab; move to subscriptions tab; select top result (playback starts); exit playback. |
| SoundCloud | com.soundcloud.android | start app; open liked tracks tab; open top song; start song playback; exit playback. |
| Spotify | com.spotify.music | start app; move to your playlists; open top playlist; start playback; stop playback (and move back to home). |
| name | package name | app-click | app-startup |
|---|---|---|---|
| com.twitter.android | api.twitter.com | api.twitter.com | |
| com.facebook.katana |
graph.facebook.com
external-lht6-1.xx.fbcdn.net |
graph.facebook.com
scontent-lhr3-1.xx.fbcdn.net external-lhr3-1.xx.fbcdn.net |
|
| com.instagram.android | scontent-lht6-1.cdninstagram.com |
scontent-lhr3-1.cdninstagram.com
i.instagram.com |
|
| Snapchat | com.snapchat.android | mvm.snapchat.com |
app.snapchat.com
app-analytics.snapchat.com mvm.snapchat.com sc-analytics.appspot.com |
| Messenger | com.facebook.orca critical |
edge-mqtt.facebook.com
lookaside.facebook.com |
b-graph.facebook.com
scontent.xx.fbcdn.net |
| CNN | com.cnn.mobile.android.phone |
cerebro.api.cnn.io
dynaimage.cdn.turner.com |
cerebro.api.cnn.io
dynaimage.cdn.turner.com |
| BBC | bbc.mobile.news.uk |
trevor-producer-cdn.api.bbci.co.uk
ichef.bbci.co.uk |
trevor-producer-cdn.api.bbci.co.uk
ichef.bbci.co.uk |
| NewsBreak | com.particlenews.newsbreak |
graph.facebook.com
googleads.g.doubleclick.net lh3.googleusercontent.com api.particlenews.com api.mobula.sdk.duapps.com img.particlenews.com log.particlenews.com |
graph.facebook.com
googleads.g.doubleclick.net static.xx.fbcdn.net tpc.googlesyndication.com scontent.xx.fbcdn.net |
| Gmaps | com.google.android.apps.maps |
clients4.google.com
www.google.com |
www.google.com
lh4.googleusercontent.com lh3.googleusercontent.com lh5.googleusercontent.com lh6.googleusercontent.com clients4.google.com |
| Uber | com.ubercab | cn-sjc1.uber.com |
csi.gstatic.com
d1w2poirtb3as9.cloudfront.net api.braintreegateway.com cn-sjc1.uber.com cn-geo1.uber.com clients4.google.com |
| Letgo | com.abtnprojects.ambatana |
search-products.letgo.com
img.letgo.com |
stickers.letgo.com
search-products.letgo.com img.letgo.com |
| Amazon | com.amazon.mShop.android.shopping |
m.media-amazon.com
www.amazon.es images-eu.ssl-images-amazon.com images-na.ssl-images-amazon.com |
m.media-amazon.com
msh.amazon.co.uk images-eu.ssl-images-amazon.com images-na.ssl-images-amazon.com www.amazon.es |
| Gmail | com.google.android.gm |
ci5.googleusercontent.com
inbox.google.com |
inbox.google.com |
| Outlook | com.microsoft.office.outlook |
prod15-api.acompli.net
prod15-files.acompli.net mobile.pipe.aria.microsoft.com |
prod15-api.acompli.net
prod15-files.acompli.net |
| Youtube | com.google.android.youtube | s.ytimg.com |
i.ytimg.com
www.youtube.com youtubei.googleapis.com yt3.ggpht.com |
| SoundCloud | com.soundcloud.android | i1.sndcdn.com |
api-mobile.soundcloud.com
i1.sndcdn.com |
| Spotify | com.spotify.music | i.scdn.co |
i.scdn.co
pl.scdn.co |
References
- (1)
- Agababov et al. (2015) Victor Agababov, Michael Buettner, Victor Chudnovsky, Mark Cogan, Ben Greenstein, Shane McDaniel, Michael Piatek, Colin Scott, Matt Welsh, and Bolian Yin. 2015. Flywheel: Google’s Data Compression Proxy for the Mobile Web. In Proc. USENIX NSDI.
- Aggarwal et al. (2014) Vaneet Aggarwal, Emir Halepovic, Jeffrey Pang, Shobha Venkataraman, and He Yan. 2014. Prometheus: Toward Quality-of-experience Estimation for Mobile Apps from Passive Network Measurements. In Proc. ACM HotMobile.
- Almeida et al. (2018) Mario Almeida, Muhammad Bilal, Alessandro Finamore, Ilias Leontiadis, Yan Grunenberger, Matteo Varvello, and Jeremy Blackburn. 2018. CHIMP: Crowdsourcing Human Inputs for Mobile Phones. In Proc. WWW.
- Almeida et al. (2017) Mario Almeida, Alessandro Finamore, Diego Perino, Narseo Vallina-Rodriguez, and Matteo Varvello. 2017. Dissecting DNS Stakeholders in Mobile Networks. In Proc. ACM CoNEXT.
- Blog (2017) Flurry Analytics Blog. 2017. U.S. Consumers Time-Spent on Mobile Crosses 5 Hours a Day. http://flurrymobile.tumblr.com/post/157921590345/us-consumers-time-spent-on-mobile-crosses-5.
- Bocchi et al. (2016) Enrico Bocchi, Luca De Cicco, and Dario Rossi. 2016. Measuring the Quality of Experience of Web Users. In Proc. SIGCOMM Internet-QoE.
- Brutlag et al. (2011) Jake Brutlag, Zoe Abrams, and Pat Meenan. 2011. Above the fold time: Measuring web page performance visually. https://conferences.oreilly.com/velocity/velocity-mar2011/public/schedule/detail/18692.
- Butkiewicz et al. (2015) Michael Butkiewicz, Daimeng Wang, Zhe Wu, Harsha V. Madhyastha, and Vyas Sekar. 2015. KLOTSKI: Reprioritizing Web Content to Improve User Experience on Mobile Devices. In Proc. USENIX NSDI.
- Chen et al. (2014) Qi Alfred Chen, Haokun Luo, Sanae Rosen, Z. Morley Mao, Karthik Iyer, Jie Hui, Kranthi Sontineni, and Kevin Lau. 2014. QoE Doctor: Diagnosing Mobile App QoE with Automated UI Control and Cross-layer Analysis. In Proc. ACM IMC.
- Collins (2017) David Collins. 2017. Mobile conversion rates lag behind desktop. https://grafik.agency/insight/mobile-conversion-rates/.
- Colwyn (2014) Susanne Colwyn. 2014. 89% of consumer media time in mobile apps, 11% in mobile web according to latest statistics by Nielsen. https://www.smartinsights.com/marketplace-analysis/customer-analysis/consumer-media-device-use/.
- da Hora et al. (2018) D. N. da Hora, A. Alemnew, C. Vassilis, R. Teixeira, and D. Rossi. 2018. Narrowing the Gap Between QoS Metrics and Web QoE Using Above-the-fold Metrics. In Proc. PAM.
- Eaton (2015) Kit Eaton. 2015. How one second could cost $1.6 billion in sales. https://www.fastcompany.com/1825005/how-one-second-could-cost-amazon-16-billion-sales.
- Erman et al. (2013) J. Erman, V. Gopalakrishnan, R. Jana, and K. Ramakrishnan. 2013. Towards a SPDYier Mobile Web?. In Proc. ACM CoNEXT.
- Falaki et al. (2010) Hossein Falaki, Dimitrios Lymberopoulos, Ratul Mahajan, Srikanth Kandula, and Deborah Estrin. 2010. A first look at traffic on smartphones. In Proceedings of the ACM IMC.
- Gao et al. (2017) Qingzhu Gao, Prasenjit Dey, and Parvez Ahammad. 2017. Perceived Performance of Top Retail Webpages In the Wild: Insights from Large-scale Crowdsourcing of Above-the-Fold QoE. In Proc. SIGCOMM Internet-QOE.
- Goel et al. (2016) Utkarsh Goel, Moritz Steiner, Mike P. Wittie, Martin Flack, and Stephen Ludin. 2016. Detecting Cellular Middleboxes Using Passive Measurement Techniques. In Proc. PAM.
- Google (2008) Google. 2008. Speed Index. https://sites.google.com/a/webpagetest.org/docs/using-webpagetest/metrics/speed-index.
- Google (2017) Google. 2017. Lighthouse. https://developers.google.com/web/tools/lighthouse/.
- Han et al. (2015) Bo Han, Feng Qian, Shuai Hao, and Lusheng Ji. 2015. An Anatomy of Mobile Web Performance over Multipath TCP. In Proc. ACM CoNEXT.
- Han et al. ([n. d.]) Bo Han, Feng Qian, and Lusheng Ji. [n. d.]. When Should We Surf the Mobile Web Using Both Wifi and Cellular?. In Proc. Workshop on All Things Cellular (ATC ’16).
- Hoßfeld et al. (2018) Tobias Hoßfeld, Florian Metzger, and Dario Rossi. 2018. Speed Index: Relating the Industrial Standard for User Perceived Web Performance to Web QoE. In QoMEX.
- Kelton et al. (2017) Conor Kelton, Jihoon Ryoo, Aruna Balasubramanian, and Samir R. Das. 2017. Improving User Perceived Page Load Time Using Gaze. In Proc. USENIX NSDI.
- Le et al. (2015) Anh Le, Janus Varmarken, Simon Langhoff, Anastasia Shuba, Minas Gjoka, and Athina Markopolou. 2015. AntMonitor: A System for Monitoring from Mobile Devices. In ACM C2B1D.
- Li et al. (2010) Zhichun Li, Ming Zhang, Zhaosheng Zhu, Yan Chen, Albert Greenberg, and Yi-Min Wang. 2010. WebProphet: Automating Performance Prediction for Web Services. In Proc. USENIX NSDI.
- Ma et al. (2015) Yun Ma, Xuanzhe Liu, Shuhui Zhang, Ruirui Xiang, Yunxin Liu, and Tao Xie. 2015. Measurement and Analysis of Mobile Web Cache Performance. In Proc. WWW.
- Monetate (2018) Monetate. 2018. Benchmarks and Research - EQ1. https://info.monetate.com/rs/092-TQN-434/images/EQ1-2018_First-Impressions.pdf.
- Naboulsi et al. (2015) D. Naboulsi, M. Fiore, Stephane R., and Razvan S. 2015. Large-Scale Mobile Traffic Analysis: A Survey. IEEE Communications Surveys & Tutorials 18, 1 (Oct. 2015), 124–161.
- Qian et al. (2014) Feng Qian, Subhabrata Sen, and Oliver Spatscheck. 2014. Characterizing Resource Usage for Mobile Web Browsing. In Proc. ACM MobiSys.
- Radhakrishnan et al. (2011) Sivasankar Radhakrishnan, Yuchung Cheng, Jerry Chu, Arvind Jain, and Barath Raghavan. 2011. TCP Fast Open. In Proc. ACM CoNEXT.
- Ravindranath et al. (2012) Lenin Ravindranath, Jitendra Padhye, Sharad Agarwal, Ratul Mahajan, Ian Obermiller, and Shahin Shayandeh. 2012. AppInsight: Mobile App Performance Monitoring in the Wild. In Proc. OSDI.
- Rula and Bustamante (2014) John P. Rula and Fabian E. Bustamante. 2014. Behind the Curtain: Cellular DNS and Content Replica Selection. In Proc. ACM IMC.
- Sandvine (2018) Sandvine. 2018. Global Internet Phenomena. https://www.sandvine.com/press-releases/sandvine-releases-2018-global-internet-phenomena-report.
- Stöber et al. (2013) Tim Stöber, Mario Frank, Jens Schmitt, and Ivan Martinovic. 2013. Who Do You Sync You Are?: Smartphone Fingerprinting via Application Behaviour. In Proc. ACM WiSec.
- Varvello et al. (2016) Matteo Varvello, Jeremy Blackburn, David Naylor, and Konstantina Papagiannaki. 2016. EYEORG: A Platform For Crowdsourcing Web Quality Of Experience Measurements. In CONEXT.
- W3C (2012) W3C. 2012. Navigation Timing. https://www.w3.org/TR/navigation-timing/.
- W3C (2018) W3C. 2018. Navigation Timing Level 2. https://w3c.github.io/navigation-timing/#introduction.
- Wang et al. (2013) Xiao Sophia Wang, Aruna Balasubramanian, Arvind Krishnamurthy, and David Wetherall. 2013. Demystifying Page Load Performance with WProf. In Proc. USENIX NSDI.
- Wang et al. (2016a) Xiao Sophia Wang, Arvind Krishnamurthy, and David Wetherall. 2016a. Speeding Up Web Page Loads with Shandian. In Proc. USENIX NSDI.
- Wang et al. (2016b) Xiao Sophia Wang, Arvind Krishnamurthy, and David Wetherall. 2016b. Speeding Up Web Page Loads with Shandian. In Proc. USENIX NSDI.
- Zhang et al. (2013) Lide Zhang, David R. Bild, Robert P. Dick, Z. Morley Mao, and Peter Dinda. 2013. Panappticon: Event-based Tracing to Measure Mobile Application and Platform Performance. In Proc. CODES+ISSS.