From Facility to Application Sensor Data:
Modular, Continuous and Holistic Monitoring with DCDB
Abstract.
Today’s HPC installations are highly-complex systems, and their complexity will only increase as we move to exascale and beyond. At each layer, from facilities to systems, from runtimes to applications, a wide range of tuning decisions must be made in order to achieve efficient operation. This, however, requires systematic and continuous monitoring of system and user data. While many insular solutions exist, a system for holistic and facility-wide monitoring is still lacking in the current HPC ecosystem.
In this paper we introduce DCDB, a comprehensive monitoring system capable of integrating data from all system levels. It is designed as a modular and highly-scalable framework based on a plugin infrastructure. All monitored data is aggregated at a distributed noSQL data store for analysis and cross-system correlation. We demonstrate the performance and scalability of DCDB, and describe two use cases in the area of energy management and characterization.
1. Introduction
As the use of High-Performance Computing (HPC) technologies in science and industry continues to increase and the race for the world’s fastest machines yields ever-growing sizes of supercomputers, the complexity across all layers, from the data center building infrastructure, over the HPC system’s hard- and software, to the scientific application software, has increased significantly. Current HPC systems consume power in the same order as large industrial facilities, and future exascale systems are expected to pose an even greater challenge both in terms of energy efficiency (Villa et al., 2014) and resilience (Cappello et al., 2014), in addition to exposing more and more parallelism in highly heterogeneous architectures (Vetter et al., 2018). To cope with these complexities and in order to retain insight into the working conditions of a system, administrators and users alike rely on monitoring tools that collect, store and evaluate relevant operational, system and application data.
With the adoption of new technologies, such as liquid cooling, the appearance of heterogeneous and accelerated systems, the increased use of dynamic tuning mechanisms at all system levels, and the establishment of complex workflows, one can observe the necessity for tighter integration of HPC systems and applications with their surrounding data center as well as with both local and global resource management. As a consequence, it is imperative that we (a) gather application, system and facility data, (b) provide the mechanisms to efficiently manage and store them, and (c) establish the foundation to integrate the data across all layers. As of today, though, distinct monitoring systems for the data center infrastructure, system hardware, and application performance are commonly used (Giménez et al., 2017), which prevents us from gaining sufficient insight for optimal supercomputer operations.
For instance, one increasingly important use case for system-wide monitoring is to verify that resource usage is kept within acceptable margins and that power consumption levels meet specific power band requirements (Sarood et al., 2014). As soon as power exceeds a given bound, corrective actions must be taken by administrators in order to ensure system health, which is in turn monitored by a series of infrastructural and environmental sensors provided by facility management. On the other extreme, monitoring on a continuous basis, e.g., by sampling performance metrics from compute nodes, is critical to detect applications with potential bottlenecks. This, however, requires a completely different set of data sources (Guillen et al., 2014), typically based on raw performance counter data integrated with derived application metrics. Even more so, ultimately, application behavior also has a direct impact on power consumption, making application data highly relevant to fine tune facility-wide power and energy management.
Further, in many scenarios, different applications or system components require concurrent access to the same data sources: as the employment of data analytics techniques to improve the efficiency of HPC systems becomes progressively common, more frameworks for fault tolerance (Jones et al., 2012), runtime tuning and optimization (Eastep et al., 2017; Miceli et al., 2015; Ţăpuş et al., 2002) and visualization, among others, require access to different types of data, such as performance counters, power meters, or even application- and runtime-level metrics. This leads to the necessity of a unified and controlled access to all data sources.
Given the above, a system monitoring solution must be holistic (comprising of data sources of the facility, the system, the runtime, and the applications), thorough (storing as many data points as available), and continuous (analyzing and storing the data from all sensors at all times). In this paper, we present the Data Center Data Base (DCDB), a novel monitoring framework for HPC data centers, systems, and applications. It is designed following these requirements and hence addresses the complexity of managing new-generation installations for administrators and users alike.
Its key features are modularity, which allows for easy integration and replacement in existing environments, and extensibility through its plugin-based architecture, which enables addition of new data sources and suitability for a wide range of deployment requirements. DCDB is also highly scalable, thanks to its distributed and hierarchical architecture, and efficient, due to its low-overhead implementation. The code is open-source, and as such it can be freely customized according to the necessities of a specific data center. DCDB is developed at the Leibniz Supercomputing Centre (LRZ) and is currently deployed on our production HPC systems. In particular we make the following contributions.
-
•
We introduce the need and requirements for continuous monitoring in modern HPC facilities.
-
•
We implement DCDB, a modular and extendable monitoring framework capable of combing sensor data from facilities all the way to applications.
-
•
We demonstrate its flexibility through a series of data collection agents covering a wide range of data sources.
-
•
We highlight its performance through a series of targeted experiments covering overheads of all individual components as well as overall scalability.
-
•
We show its applicability based on two case studies in the area of energy monitoring.
The remainder of the paper is structured as follows: Section 2 briefly discusses the challenges that characterize HPC holistic monitoring, which we address in DCDB. Section 3 describes the design foundations of our framework and its architecture, and Section 4 provides a detailed view of its implementation. Section 5 presents the available interfaces for data access in DCDB. Section 6 evaluates DCDB’s footprint on several production HPC systems, and Section 7 illustrates two real-world case studies using our framework. Finally, Section 8 discusses related work on the topic of HPC monitoring, and Section 9 draws our conclusions and outlines future work.
2. Monitoring Challenges
Establishing the necessary framework for holistic and continuous monitoring of large-scale HPC systems and their infrastructure is extremely challenging in many ways (Ahlgren et al., 2018; Brandt et al., 2016).
(1)
One particular challenge is Scalability: “traditional” sensor data (e.g., health status, temperature, power draw, network bandwidth) is comparatively easy and cheap to collect as it is typically acquired on a per-node basis and does not require very high readout frequencies. Even for large HPC systems, this type of data will only consist of a few thousand sensors which can still be handled by a monolithic and centralized monitoring solution. Application-related metrics (e.g., executed instructions, memory bandwidth, branch misses), however, typically need to be collected on a per-core basis and at high frequencies (i.e., 1Hz or higher). Consequently, they can easily add up to thousands of individual sensors per-compute node, resulting in millions of sensor readings per second, which creates bottlenecks particularly on large-scale HPC systems. Such vast amounts of sensor data can only be handled by a scalable and distributed monitoring solution.
(2)
The above also exposes a second challenge: Comparability. Data from different sources is recorded at varying frequencies using varying units and exposing different metadata characteristics. We need mechanisms to translate data from different sensors, derive comparable metrics, and ultimately enable cross-source correlations.
(3)
A third challenge is Interference: many metrics must be collected in-band (i.e., on the compute nodes themselves) as opposed to out-of-band (i.e., via a dedicated management network). For the former, monitoring solutions need to be highly-efficient in order not to interfere with running HPC applications, both in terms of Overhead and Resource Footprint, particularly Memory Footprint. This is especially pressing when performing fine-granularity monitoring of several thousand metrics per-node, as discussed above, which could interfere with applications significantly.
(4)
Last, but not least, a challenge in monitoring is Extensibility: very often, new devices (in hardware or software) need to be added to an already-running monitoring system, potentially requiring additional protocols and interfaces to access their data. Being able to easily add new ones, either by deploying existing implementations or developing them from scratch, is therefore important for production use of any monitoring solution.
3. DCDB Architecture
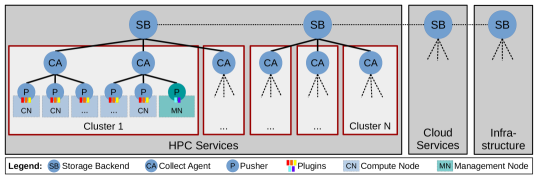
To address the challenges described in Section 2, DCDB has been designed following a modular architecture, as depicted in Figure 1. We first describe the architecture in terms of its single components, and then explain the design principles on which it is based.
3.1. Components of the Architecture
DCDB consists of three major classes of components, each with distinct roles: a set of data Pushers, a set of Collect Agents and a set of Storage Backends. These components are distributed across the entire system and facility, which explicitly includes system nodes, facility management nodes and infrastructure components.
Transport Protocol.
DCDB employs the Message Queuing Telemetry Transport (MQTT) (Locke, 2010) protocol for the communication between Pushers and Collect Agents. We adopted MQTT for a variety of reasons: first, it is a lightweight protocol that was introduced specifically for the exchange of telemetry data, which makes it an ideal fit for sensor monitoring. Moreover, it has a generic design and is well-established, enabling DCDB to be compatible with a vast amount of available tools for data transmission, processing and visualization that support MQTT. Similarly, several implementations of MQTT exist for a large variety of platforms and architectures; in this regard, by exploiting the modular design of DCDB, developers can choose to swap one Pusher against another as long as it also employs MQTT for transmitting data.
The protocol is based on a publish/subscribe model in which senders publish their messages under a certain topic to which potential receivers can subscribe. MQTT topics are essentially strings that describe the content of each message and are organized similarly to file system path names, i.e., they implicitly define a hierarchy. We leverage this feature in DCDB by associating a unique MQTT topic to each sensor, thus defining a sensor hierarchy. The individual hierarchy levels can be defined by the user, but we commonly specify them reflecting the location of the monitored entities (e.g., a hierarchy would comprise levels associated to rooms, systems, racks, chassis, nodes, and CPUs). Defining an appropriate hierarchy for sensors is fundamental in a holistic monitoring tool such as DCDB: since the amount of available sensors can potentially become enormous due to system size and to the monitoring requirements of different parties (e.g., developers, vendors, operators), enabling separation of the sensor space greatly improves the navigability, and in turn, the usability of the DCDB framework itself.
Pusher.
A Pusher component is responsible for collecting monitoring data and is designed to either run on a compute node of an HPC system to collect in-band data or on a management or facility server to gather out-of-band data. The plugins for the actual data acquisition are implemented as dynamic libraries, which can be loaded at initialization time as well as at runtime. We currently provide ten different Pusher plugins, supporting in-band application performance metrics (Perfevents (Weaver, 2013)), server-side sensors and metrics (ProcFS111http://man7.org/linux/man-pages/man5/proc.5.html and SysFS), I/O metrics (GPFS and Omnipath), out-of-band sensors of IT components (IPMI (int, 2013) and SNMP (Case et al., 1990)), RESTful APIs, and building management systems (BACnet (ANSI/ASHRAE Standard 135-2008, 2010)). A Pusher’s data collection capabilities are only limited by the available plugins and their supported protocols and data sources, and it is therefore adaptable to a wide variety of use cases.
Collect Agent.
A Collect Agent is responsible for receiving the sensor readings from a set of associated Pushers and writing them to a Storage Backend. For that purpose, it assumes the role of an MQTT broker that manages the publish/subscribe semantics of the MQTT protocol: Pushers publish the readings of individual sensors under their specific topics and Collect Agents forward them to the potential subscribers of those topics. In the current design of DCDB, the Storage Backend is the only subscriber that subscribes to all MQTT topics. However, it is possible that additional subscribers may want to receive certain sensor readings as well for other purposes, for example for on-the-fly analysis of data or online tuning.
Storage Backend.
By its nature, monitoring data is time series data that is typically acquired and consumed in bulk: it is streamed into the database and retrieved for longer time spans, and not for single points in time. Logically, the data points for a sensor are organized as a tuple of ¡sensor, timestamp, reading¿. These properties make monitoring data a perfect fit for noSQL databases in general and wide-column stores in particular, due to their high ingest and retrieval performance for this kind of streaming data.
The current implementation of DCDB leverages Apache Cassandra (Wang and Tang, 2012) for Storage Backends, but due to its modularity it could easily be swapped for a different database such as InfluxDB222https://www.influxdata.com/, KairosDB333https://kairosdb.github.io/, or OpenTSDB444http://opentsdb.net. We chose Cassandra due to its data distribution mechanism that allows us to distribute a single database over multiple server nodes, or Storage Backends, either for redundancy, scalability, or both. This feature works in synergy with the hierarchical and distributed architecture of DCDB and effectively allow us to scale our system to arbitrary size.
3.2. Design Principles
Here we introduce the main design principles and requirements driving the architecture of DCDB (Data Flow and Components), alongside the concepts around which the framework itself and its interfaces are built (Sensors and Virtual Sensors).
Data Flow.
The data collection mechanism follows the push principle: instead of a central server that pulls data from monitored entities, a distributed set of Pushers close to the data sources acquire data and push it to the Collect Agents. Collect Agents receive monitoring data from their associated Pushers and forward it to their respective Storage Backend for persistent storage, which (in combination) form the overall distributed DCDB data storage.
Communication between components is performed via established protocols and well-defined APIs such that each component could be easily swapped for a different implementation, leveraged for other purposes or integrated into existing environments.
Components.
The modular design of DCDB facilitates its scalability as all components are designed to be distributed and are hierarchically-organized: in a typical setup, there will be a large number of Pushers (hundreds or thousands), many Collect Agents (in the order of dozens), and one or more Storage Backends. Depending on the system’s size and the number of metrics to be monitored, the number of Pushers, Collect Agents and Storage Backends can be scaled to handle the load and to sustain the required ingest rates. In terms of extensibility, Pushers provide a flexible plugin-based interface that allows for easily adding new and different data sources via various protocols and interfaces. DCDB currently provides plugins for the most commonly-used protocols, but additional plugins can be implemented with low coding effort.
Sensors.
In the context of DCDB, each data point of a monitored entity is called a sensor. This could be a physical sensor measuring temperature, humidity or power, but can also be any other source of monitoring data such as a performance counter event of a CPU, the measured bandwidth of a network link or the energy meter of a power distribution unit (PDU). Each sensor’s data consists of a time series, in which readings are represented by a timestamp and a numerical value. This format is enforced across DCDB, ensuring consistency and uniformity of sensor data.
Virtual Sensors.
DCDB supports the definition of virtual sensors, which supply a layer of abstraction over raw sensor data and can be used to provide derived or converted metrics. They are generated according to user-specified arithmetic expressions of arbitrary length, whose operands may either be sensors or virtual sensors themselves. This can be used, for instance, to aggregate data from several sources in order to gain insight about the status of a system as a whole (e.g., aggregating the power sensors of individual compute nodes in an HPC system), or to calculate key performance indicators such as the Power Usage Effectiveness (PUE) from physical units measured by sensors. Virtual sensors can be used like normal sensors and are evaluated lazily, i.e., they are only computed upon a query and only for the queried period of time. As queries to virtual sensors may potentially be expensive (in terms of computation as well as I/O), results of previous queries are written back to a Storage Backend so they can be re-used later. The units of the underlying physical sensors are converted automatically and we account for different sampling frequencies by linear interpolation.
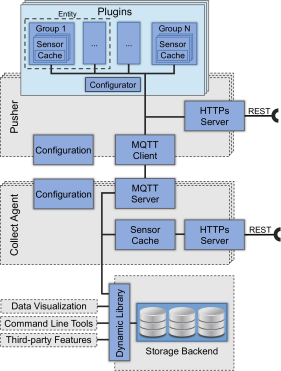
4. DCDB Implementation
DCDB is written in C++11 and is freely available under the GNU GPL license via GitLab555https://dcdb.it. In this section we provide greater detail on the implementation specifics on DCDB’s core components, which are also represented in Figure 2.
4.1. Pusher Structure
A Pusher comprises a set of Plugins, an MQTT Client, an HTTPs Server, and a Configuration component. The latter is responsible for configuring the Pusher at start-up and instantiating the required plugins. This process is controlled by a set of configuration files that define the data sources for each plugin as well as the global Pusher configuration. The configuration files use an intuitive property tree format, which is documented on the DCDB code repository with several examples. The HTTPs Server provides a RESTful API to facilitate configuration tasks and to access the sensor caches in the plugins (see Section 5.3 for details). The MQTT Client component periodically extracts the data from the sensors in each plugin and pushes it to the associated Collect Agent. It relies on the Mosquitto library (Light, 2017) for MQTT communication, which proved to be the most suitable for our purposes in terms of scalability, stability and resource footprint. The key components of a Pusher, however, are the plugins that perform the actual data acquisition and consist of up to four logical components:
Sensors
The most basic unit for data collection. A sensor represents a single data source that cannot be divided any further. It may represent, e.g., the L1 cache misses of a CPU core or the power consumption of a device, which are sampled and collected as a numerical time series. A sensor always has to be part of a group.
Groups
The next aggregation level combining multiple sensors. All sensors that belong to one group share the same sampling interval and are always read collectively at the same point in time. Groups are intended to tie together logically-related sensors, such as all power outlets of one power delivery unit and cache-related performance counters of a CPU core.
Entities
An optional hierarchy level to aggregate groups or to provide additional functionality to them. For example, for a plugin reading data from a remote server (e.g., via IPMI or SNMP), a host entity may be used by all groups reading from the same host for communication with it.
Configurator
The component responsible for reading the configuration file of a plugin and instantiating all components for data collection. It provides the interface between the Pusher and one of its plugins, and gives access to its entities, groups and sensors.
System administrators deploying DCDB are encouraged to extend Pushers according to their own needs by implementing plugins for new data sources. To simplify the process of implementing such plugins DCDB provides a series of generator scripts. They create all files required for a new plugin and fill them with code skeletons to connect to the plugin interface. Comment blocks point to all locations where custom code has to be provided, greatly reducing the effort required to implement a new plugin.
Sensor read intervals are not only synchronized within groups, but also across plugins and even Pushers by means of the Network Time Protocol (NTP) (Mills, 1991). Moreover, DCDB’s push-based monitoring approach allows for more precise timings compared to pull-based monitoring, especially at fine-grained (i.e., sub-second) sampling intervals. This allows for easily correlating different sensors without having to interpolate readings to account for different readout timestamps. Additionally, this minimizes jitter on compute nodes of HPC systems as parallel applications running on multiple nodes will be interrupted at the same time and hence less load imbalance will be introduced (Ferreira et al., 2008). Although the data collection intervals of multiple Pushers are synchronized, these will send their data at different points in time in order not to overwhelm the network, Collect Agents and Storage Backends.
4.2. Collect Agent as Data Broker
Collect Agents are built on top of a custom MQTT implementation that only provides a subset of features necessary for their tasks. In particular, it only supports the publish interface of the MQTT standard, but not the subscribe interface. As Storage Backends are currently the only consumers of sensor readings, this avoids additional overhead for filtering MQTT topics.
Upon retrieval of an MQTT message, a Collect Agent parses the topic of the message and translates it into a unique numerical Sensor ID (SID) that is used as the key to store a sensor’s reading in a Storage Backend. There is a 1:1 mapping of topics to SIDs which maintains the hierarchical organization of MQTT topics: each topic is split into its hierarchical components and each such component is mapped to a numeric value that is stored in a particular bit field of the 128-bit SID.
4.3. Cassandra Storage Backends
As mentioned in Section 3, we picked Apache Cassandra for our Storage Backends as it fits well with the semantics of monitoring data and because its distributed approach allows for the scalability required of a holistic monitoring framework.
As Cassandra may be distributed across multiple servers (a “cluster” in Cassandra terminology), any of those servers may be used to insert or query data. The distribution of data within the cluster can be controlled via partition keys and a partitioning algorithm. We exploit this feature by leveraging the hierarchical SIDs as partition keys for Cassandra: using a partitioning algorithm that maps a sub-tree in the sensor hierarchy to a particular database server allows for storing a sensor’s reading on the nearest server and thus to avoid network traffic. The same logic is applied for queries to minimize network traffic between the database servers by directing them directly to the respective server. This logic is implemented in libDCDB (see Section 5.1) and is fully transparent to Collect Agents as well as to the users requesting access to sensor data.
5. DCDB Interfaces
DCDB provides several interfaces to access the stored monitoring data. Users and administrators of an HPC system can perform this task with the support of a specific dynamic library (libDCDB), with command line tools that are built on top of this library and via RESTful APIs. Furthermore, data can be converted to be analyzed using the Grafana visualization tool of GrafanaLabs666https://grafana.com/.
5.1. libDCDB
All accesses to Storage Backends are performed via a well-defined API that is independent from the underlying database implementation. While we use Apache Cassandra in our current Storage Backends, this abstraction allows for easily swapping it against a different database solution without any changes in the upstream components. Currently, the API has only been implemented in a C++ library, libDCDB, but other bindings could easily be implemented as well. Additionally, the C++ library can also be used in Python scripts and hence covers a wide range of use cases.
5.2. Command Line Tools
DCDB offers a series of command line tools that leverage libDCDB for access to Storage Backends. Among these, the config tool allows administrators to perform basic database management tasks (e.g., deleting old data or compacting) as well as configuring the properties of sensors such as units and scaling factors or defining virtual sensors. The query tool then allows users to obtain sensor data for a specified time period in CSV format or perform basic analysis tasks on the data such as integrals or derivatives. A series of secondary tools offers utility features, like a csvimport tool to import CSV data into Storage Backends.
5.3. RESTful APIs
Pushers and Collect Agents further support data retrieval through RESTful APIs. In a Pusher this provides an interface to retrieve the current configuration (e.g., of plugins or sensors) and allows for starting and stopping individual plugins. This can be useful, for example, to avoid conflicts with user software accessing the same data source, or to enable additional data sources for individual applications. Additionally, one can modify a plugin’s configuration file at runtime and trigger a reload of the configuration, which allows a seamless re-configuration without interrupting the Pusher. Further, the RESTful API also provides access to a sensor cache that stores the latest readings of all sensors. It is configurable in size and can be used by other processes (either on the same machine or via the network) to easily read all kinds of sensors via a common interface from user space.
Analogous to Pushers, Collect Agents provide a sensor cache that can be queried via the same RESTful API and that gives access to the most recent readings of all Pushers connected to them. This can be used, for example, to feed all readings into another (legacy) monitoring framework without having to deal with the protocols of various sensors.
5.4. Visualization of Data
DCDB leverages Grafana for the visualization of monitoring data. Among its many benefits, Grafana suits our needs primarily because a) it provides a comprehensive set of visualization options (e.g., graphs, heatmaps, histograms or tables); b) it allows users to define alerts and receive associated notifications via multiple channels; c) it is designed following an extensible architecture, allowing to develop dedicated plugins; d) it has a strong user and development community; and e) is completely open-source.
However, although Grafana supports several database implementations, it does not provide any plugin for Apache Cassandra. We therefore develop our own plugin that leverages libDCDB. In addition to retrieving data from Cassandra, it is also designed to profit from current and future features offered by DCDB.
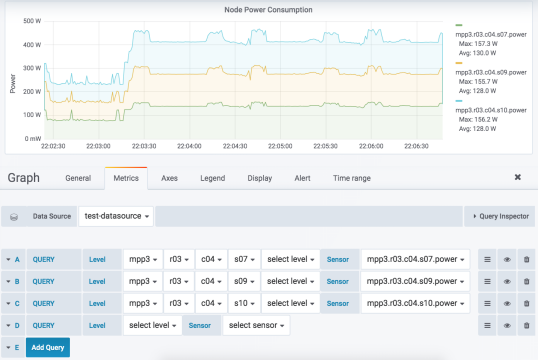
To this day, a missing feature in Grafana and in all of its plugins for different databases is the possibility to build hierarchical queries and to select metrics at a specific level of the hierarchy. This functionality is useful in HPC or data center environments, where a system administrator can browse different hierarchical levels of a system (e.g., a rack, a chassis, or a server) and query data from sensors available at that level. This becomes particularly beneficial if the monitored system comprises a very large number of sensors (potentially in the order of millions for leadership-class HPC systems). As DCDB employs such a hierarchy on all sensors (see Section 3), our data source plugin also exposes it in Grafana.
Figure 3 illustrates a visualization example of this feature, specifically plotting the power consumption of three different nodes on one of our production systems at LRZ. As depicted, users can query sensors at a specific hierarchical level by navigating through the hierarchy with the support of multiple drop-down menus. The visualization of data may further benefit from convenient features such as stacking of time series data or comprehensive formatting of axes and legends (e.g., displaying useful information like current average or maximum values of the plotted metrics).
6. Performance and Scalability
| HPC System | Nodes | CPU | Memory | Interconnect | Plugins | Sensors | Overhead |
| SuperMUC-NG | 6480 Skylake | Intel Xeon Platinum 8174 2 cpus x 24 cores x 2 threads | 96GB | Intel OmniPath | Perfevents, ProcFS, SysFS, OPA | 2477 | 1.77% |
| CooLMUC-2 | 384 Haswell | Intel Xeon E5-2697 v3 2 cpus x 14 cores | 64GB | Mellanox Infiniband | Perfevents, ProcFS, SysFS | 750 | 0.69% |
| CooLMUC-3 | 148 KNL | Intel Xeon Phi 7210-F 64 cores x 4 threads | 96GB 16GB HBM | Intel OmniPath | Perfevents, ProcFS, SysFS, OPA | 3176 | 4.14% |
In this section we discuss the performance of DCDB from different viewpoints. We start by evaluating Pushers in production and test configurations, and then proceed by analyzing Collect Agents. Our purpose is to quantify the performance of our framework as a whole: by quantifying the impact of a Pusher on running applications we assess its overhead, whereas by analyzing its resource usage we characterize its footprint and scalability. The same approach is applied to a Collect Agent to characterize its scalability at various data rates, and thus to prove the suitability of DCDB for extreme-scale HPC installations.
6.1. Experimental Setup
Reference Applications.
In order to estimate how DCDB impacts running applications, we performed tests by executing instances of well-known benchmarks on multiple node architectures. We first present a series of tests performed in a production environment (Section 6.2.1), where we aim to characterize the impact of DCDB on real applications sensitive to network and memory bandwidth, and on MPI communication. For this reason, we employ a selection of MPI benchmarks from the CORAL-2 suite777https://asc.llnl.gov/coral-2-benchmarks, namely Quicksilver (Richards et al., 2017), LAMMPS (Plimpton, 1995), AMG (Yang et al., 2002) and Kripke (Kunen et al., 2015). These four benchmarks cover a large portion of the behavior spectrum of HPC applications, and results obtained with these can be considered representative of real work loads.
Later on, we characterize the impact of DCDB on computational resources and its scalability with various test configurations (Section 6.2.2), stressing the communication and sampling subsystems. In this part, we focus on using the shared-memory version of the High-Performance Linpack (HPL) benchmark (Dongarra et al., 2003), supplied with the Intel MKL library888https://software.intel.com/en-us/articles/intel-mkl-benchmarks-suite. Being a compute-bound application, tests performed against HPL give us insights on the behavior of DCDB in a worst-case scenario.
Test Architectures.
For the Pusher-related part of this analysis we use nodes from three different production HPC systems at LRZ, each with a different architecture (see Table 1). The Skylake and Haswell CPUs provide strong single-thread performance, whereas the Knights Landing CPU with its large number of (SMT-) cores is comparatively weak in this regard. A Collect Agent was running on a dedicated database node, equipped with two Intel E5-2650 v2 CPUs, 64GBs of RAM and a 240GB Viking Tech SSD drive.
Configuration Parameters.
All benchmarks are configured to instantiate one MPI process (in case of MPI codes) per node, and use as many OpenMP threads as physical CPU cores that are available. Pushers are configured to use two sampling threads and a sensor cache size of two minutes (see Section 5.3).
Evaluation Metrics.
Each experiment involving benchmark runs was repeated 10 times to ensure statistical significance. To account for outliers and performance fluctuations, we use median runtimes. We then use the following metrics to evaluate the performance of the DCDB components:
-
•
Overhead is defined as the fraction of time an application spends in excess compared to running without DCDB due to interference from Pushers. We obtain it by comparing the reference execution time () of an application run against the one observed when a Pusher is run (), and we compute it as . The overhead helps quantify the impact of a component on the system performance. We compute it in terms of the runtime impact on reference applications, so as to obtain scalable and reproducible experiments. Our evaluation process does not include system throughput among the selected metrics as it would significantly depend on the underlying workload, and as such would require a large-scale dedicated environment. Nevertheless, based on our experience on our production systems, we do expect low runtime overhead to directly translate into low throughput change.
-
•
CPU Load is defined as the percentage of active CPU time spent by a process against its total runtime, as measured by the Linux ps command; this metric characterizes a Pusher’s and a Collect Agent’s performance when used in a out-of-band context, with no overhead concerns.
-
•
Memory Usage of a process is quantified by ps. It helps characterize the impact of different monitoring configurations in Pushers and Collect Agents.
6.2. Pusher Performance
First, we present the performance of Pushers in terms of computational overhead against work loads running in an HPC system.
6.2.1. Overhead in a Production Configuration
To assess a Pusher’s performance in typical production environments, we are using the actual configurations deployed on our systems as described in Table 1. In all configurations, the ProcFS plugin collects data from the meminfo, vmstat and procstat files, whereas we use SysFS to sample various temperature and energy sensors. we use Perfevents to sample performance counters on CPU cores, and finally OPA to measure network-related metrics. For this use case, we only deploy plugins that perform in-band measurement with a sampling interval of 1 second; out-of-band measurement would be performed on separate machines and hence does not incur overhead on running applications. Additionally, in some experiments we only deploy the tester plugin, which can generate an arbitrary number of sensors with negligible overhead. This allows us to isolate the overhead of the various monitoring backends (e.g., IPMI or perfevents) from that of the Pusher, which is mostly communication-related.
We measured the overhead against the CORAL-2 MPI benchmarks with different node counts on our Skylake-based SuperMUC-NG system, using a weak scaling approach. We present our results in Figure 4. The experiment was performed twice: once with the Pusher configuration presented in Table 1 (labeled total), and once using a configuration with the same number of sensors, produced with the tester plugin (labeled core). The overhead for LAMMPS, Quicksilver and Kripke is low and never goes above 3%. Moreover, when scaling the number of nodes, the overhead increase is minimal. The AMG benchmark represents an exception, showing a linear increase with respect to the node count, and peaking at 9% with 1024 nodes: this application is notorious for using many small MPI messages and fine-granular synchronization. Consequently, it is extremely sensitive to network interference. This is also confirmed by the experiments with the tester plugin: LAMMPS, Quicksilver and Kripke are affected to a very limited extent by the Pushers’ network interference, whereas in AMG this causes most of the total overhead. Moreover, we observe the best performance for AMG when the Pushers were configured to send sensor data to a Collect Agent in regular bursts twice per minute, reducing network interference. The remaining benchmarks, on the other hand, perform better when the Pushers’ data is sent out continuously in a non-bursty manner. This type of interference can be avoided by using a separate network interface (e.g., for management) to transmit data from compute nodes.
We present overhead results against single-node HPL runs for all three architectures in Table 1. In most configurations the overhead is low despite the large number of sensors being pushed each second. The worst performer is the Knights Landing architecture: this was expected due to its weak single-thread performance and the much larger number of collected sensors than in the Skylake and Haswell configurations, which is due to the large number of SMT cores on this architecture. Average memory usage ranges between 25MB (Haswell) and 72MB (Knights Landing), whereas average per-core CPU load ranges between 1% (Haswell) and 9% (Knights Landing).
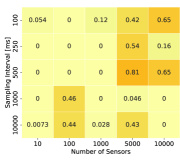
6.2.2. Overhead in a Test Configuration
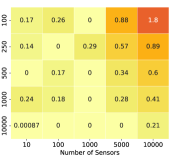
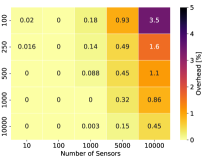
In this second part we estimate the scalability of the Pusher’s core, once again using the tester plugin. We analyze a total of 25 configurations, which differ in terms of sampling intervals and number of sensors. Figure 5 depicts the results in terms of overhead against single-node HPL runs, for each of the three analyzed node architectures. In the plot, a value of 0 denotes no overhead, meaning that the median runtime when using a Pusher in the experiment was equal or less than the reference median runtime. In all cases the computational overhead is low, and in all configurations with 1,000 sensors or less, which are typical for production environments, it is below 1%. Even when pushing 100,000 sensor readings per second (10,000 sensors sampled every 100ms) overhead remains acceptable for all platforms. The Skylake node architecture, in particular, is unaffected by the various Pusher configurations and shows consistent overhead values. Haswell and Knights Landing show clearer gradients with increasing overhead in the most intensive configurations, with the latter of the two exhibiting the worse results due to its weak single-thread performance. DCDB is thus usable in scenarios with large numbers of sensors and at high sampling rates.
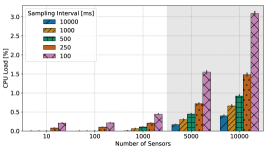
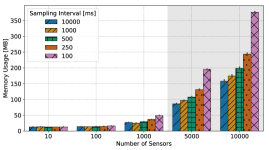
In Figure 6 we show results in terms of average per-core CPU load and memory usage for each configuration. We show results only for the Skylake-based SuperMUC-NG nodes, since all node types scale similarly. Memory usage is dependent on both the sampling interval and number of sensors, as these will result in different sensor cache sizes. In the most intensive configuration with 100,000 sensor readings per second, memory usage averages at 350MB, and is well below 50MB for typical production configurations, that have 1,000 sensors or less. It can be further reduced by tuning the size of sensor caches. CPU load peaks at 3% in the most intensive configuration, proving that there is ample room for much more intensive and fine-granularity configurations, in environments in which computational overhead is not a concern, such as when performing out-of-band monitoring.
6.3. Performance Scaling Modeling
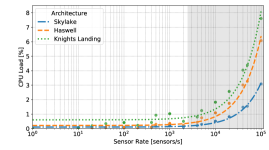
We now discuss a generic model to infer the performance of our Pusher solution in terms of per-core CPU load on each architecture, as a function of the sensor rate (i.e., the ratio of the number of instantiated sensors and the sampling interval). We use the performance data obtained in the experiment discussed in Section 6.2.2 on the three reference architectures. Figure 7 shows the observed average per-core CPU load across configurations as well as fitted curves resulting from linear regression. Since we cover a broad range of sensor rates, the X-axis is shown in logarithmic scale.
Results show that varying levels of performance are achieved across the reference architectures. The Skylake architecture, in particular, shows the best scaling curve with 3% peak CPU load, whereas Knights Landing once again shows the worst results, with 8% peak CPU load. In all architectures, however, CPU load is below 1% for configurations with a sensor rate of 1,000 or less. Most importantly, Pushers follow a distinctly linear scaling curve on all architectures. This implies that system administrators can reliably infer the average CPU load of the Pusher on a certain system by means of linear interpolation, with the following equation:
| (1) |
In Equation 1, represents the average CPU load, while is the target sensor rate, and and are two reference sensor rates for which the average CPU load was measured.
6.4. Collect Agent Performance
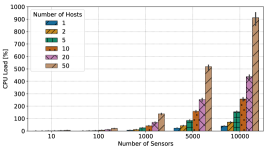
In this subsection we analyze the performance and scalability of our Collect Agent component, to prove its effectiveness in supporting a large-scale monitoring infrastructure. In order to evaluate its scalability we focus on the CPU load metric, as defined in Section 6.1. We do not analyze the performance of the Cassandra key-value store to which Collect Agents write, as it is a separate component. Similar to Section 6.2, we perform tests by running Pushers with the tester plugin under different configurations. In this test, we used a sampling interval of 1 second, and experimented with different numbers of Pushers, executed from separate nodes, each sampling a certain number of sensors.
We show the results of our tests in Figure 8. In the configurations that use 1,000 sensors or less, we reach saturation of a single CPU core only with 50 concurrent hosts. In the most intensive configurations, multiple CPU cores are fully used, but even in the worst-case scenario we observe an average CPU load of 900%, which translates into 9 fully-loaded cores: this corresponds to a Cassandra insert rate of 500,000 sensor readings per second (10,000 sensors sampled each second by 50 concurrent Pushers), which is equivalent to that of a production configuration in a medium-scale system.
7. Case Studies
In the following, we illustrate two real-world case studies using DCDB, illustrating both facility and application-level analysis on top of a single system and with shared metrics. In the first, we prove its effectiveness for monitoring and correlating infrastructure data from different sources by analyzing the cooling system’s ability to remove heat, whereas in the second we focus on showing the usefulness of high-frequency monitoring data collected in compute nodes to characterize the power consumption of applications.
7.1. Efficiency of Heat Removal
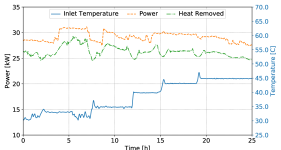
One of the requirements in the procurement of our CooLMUC-3 system was to achieve high energy efficiency through the employment of direct warm-water cooling. Megware, the chosen system integrator, provided a 100% liquid-cooled solution that not only liquid-cools the compute nodes, but also all other components, including power supplies and network switches. Hence, the entire system does not require any fans in the compute racks and therefore allows us to thermally insulate them. This reduces the heat emission to the compute room to close to zero. To help study its efficiency, the system is broadly instrumented and provides a wide range of infrastructure sensors and measuring devices, such as power sensors and flow meters. We monitor these sensors and devices in DCDB to evaluate the efficiency of the system’s water cooling solution by calculating the ratio between the heat removed via warm water and the system’s total electrical power consumption.
Figure 9 depicts in detail the behavior of the monitored metrics for our case study, specifically the total power consumption of the system, the total heat removed from the system by the liquid-cooling circuit, and its inlet water temperature. All data has been collected out-of-band by running one Pusher and one Collect Agent on two different management servers and by leveraging the Pusher’s REST and SNMP plugins. As it may be expected, the instrumentation employs sensors only at the node or rack levels, which do not supply a picture of the entire system’s status. Hence, we defined aggregated metrics in DCDB using the virtual sensors (as described in Section 3), which prove to be particularly suitable for this use case. Using DCDB, we were able to easily record all relevant sensors and to calculate the average ratio between the total heat removed and the power drawn, which turned out to be approximately 90%, showing very high efficiency of our new system’s water cooling solution. We further observe that, for rising inlet water temperatures, the gap between power and heat removed does not increase, suggesting that the insulation of the entire racks is effective in reducing the emission of heat radiation to ambient air.
7.2. Application Characterization
Monitoring data can be used to implement a feedback loop inside of HPC systems, by using it to make informed and adaptive management decisions. One such use case involves using monitoring data in compute nodes to characterize the relationship between the throughput and power consumption of running applications, and thus change parameters such as the CPU frequency at runtime to improve the overall energy efficiency. In this scenario, for example, when applying monitoring data to drive Dynamic Voltage and Frequency Scaling (DVFS), the frequency of sampling needs to be high (i.e., greater than 1Hz) so as to react quickly to the frequent changes that occur in application behavior (Mittal, 2014).
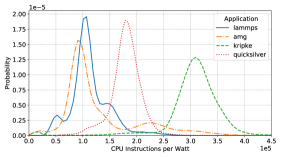
Here, we present a characterization of the four applications from the CORAL-2 suite used in Section 6. We execute several runs of the applications on a single node in our CooLMUC-3 system, while using DCDB with a 100ms sampling interval. The application, node and DCDB configurations are as described in Section 6.1. In particular, we try to gain insight into the characteristics of each single application by analyzing the ratio between the number of per-core retired instructions and the node’s power consumption at each time point. In Figure 10 we show the fitted probability density function of the resulting time series for each application. We can see that each application shows a distinct behavior: Kripke and Quicksilver exhibit very high mean values, translating to a high computational density, while applications such as LAMMPS or AMG show lower values. Moreover, the distributions of the two latter applications show multiple trends, indicating a dynamic behavior that changes over time. Obviously, those variations vastly depend on the code profile of the underlying applications. In this context, the use of a fine-grained monitoring tool, such as DCDB, significantly contributes to distinguishing different application patterns and to support the implementation of optimal operational modes, leading to better system performance and efficiency (e.g., by selecting optimal CPU frequencies).
8. Related Work
Many insular components for data center and HPC system management are currently available, with varying feature sets, broadness and architectures. The Examon monitoring framework (Beneventi et al., 2017) shares a similar design philosophy with our monitoring solution, as it also employs a push-based monitoring model, allows for accurate fine-grained monitoring, and uses MQTT and Apache Cassandra as communication protocol and data store, respectively. Examon, however, has been mostly developed as an ad-hoc solution for certain production environments, and lacks a modular and plugin-oriented architecture, making integration of new data sources difficult. Moreover, DCDB provides synchronization of measurements across nodes, which helps reduce the interference on parallel applications and allows for accurate correlation of sensors.
One of the most common open-source monitoring frameworks in the HPC domain is the Lightweight Distributed Metric Service (LDMS) (Agelastos et al., 2014), which has been shown to be suitable for deployment on large-scale systems. However, while plugin-based, the LDMS architecture is not designed for customization. As such, development of new plugins for specific purposes requires considerable effort. Moreover, storage options for sensor data in LDMS are limited, and since the communication protocol between sampler and aggregator processes is custom, integration with other frameworks and environments is difficult. Finally, the pull-based model adopted by LDMS is problematic for fine-grained monitoring, which requires high sampling accuracy and precise timing. The Ganglia (Massie et al., 2004) and Elastic Stack999https://www.elastic.co/products/ open-source monitoring frameworks share similar issues as LDMS, but are not designed for large-scale HPC setups.
On the data transport side, frameworks like the Multicast Reduction Network (MRNet) enable high-throughput and efficient multicast and reduction operations in distributed systems (Roth et al., 2003). In particular, MRNet relies on a tree-based overlay network for communication, whereby retrieval of data is performed from the leaves to the root of the tree. Packet aggregation can be implemented via customizable filters. While MRNet could be integrated into DCDB for its communication, we opted to deploy an IoT-based communication solution instead, in our case MQTT, due to its wider spread use, higher acceptance among our administrators as well as a more loosely-coupled initialization, which allows us to easily deploy DCDB beyond job boundaries. Furthermore, since the purpose of our framework is holistic continuous monitoring, filtering is not desired in our case, but was one of the major drivers behind MRNet and is one of its major advantages.
There are many commercial and closed-source products for system-wide monitoring. Among these, the most popular are Nagios (Barth, 2008), Zabbix (Olups, 2016) and Splunk (Carasso, 2012), which are deployed in many data centers across the world. Icinga101010https://www.icinga.com is a similar product, tailored for HPC systems specifically. These frameworks, however, are alert-oriented and focus on the analysis of Reliability, Availability and Serviceability (RAS) metrics to provide insights into system behavior. They supply conventional monitoring features, but these usually focus on infrastructure-level data and cover only a very small part of the vast amount of metrics that could be monitored in a system (e.g., CPU performance counters in compute nodes).
The PerSyst tool (Guillen et al., 2014) specializes in collecting performance monitoring data, transforming raw data into performance patterns and aggregating the data during collection. The data at the backend therefore lacks the detail of the raw performance metrics. The ScrubJay tool (Giménez et al., 2017) allows to automatically derive semantic relationships from raw monitored data, which is aggregated to generate performance indicators.
Performance profiling tools such as HPCToolkit (Adhianto et al., 2010), Likwid (Treibig et al., 2010), TAU (Shende and Malony, 2006) or perf (Weaver, 2013) offer extensive support for the collection and manipulation of node-level performance metrics at fine granularity, useful for application behavior characterization, but do not support the transmission and storage of monitored data nor the integration of facility data. Finally, TACC Stats (Evans et al., 2014) is a comprehensive solution for monitoring and analysis of resource usage in HPC systems at multiple resolution levels, whereas tools such as Caliper (Boehme et al., 2016) provide generic interfaces to enable application instrumentation. These tools are not designed to perform system-wide monitoring, but rather application analysis and have a different focus compared to our monitoring solution, yet could potentially be included in DCDB as additional data sources.
9. Conclusions and Future Work
In this paper we have presented DCDB, a novel monitoring framework for HPC systems that is designed to be modular, scalable and easily customizable. Our framework supports the most common standards and protocols for the collection of data in HPC systems, covering a broad range of performance events and sensor types that can be monitored. We characterized the footprint and overhead of DCDB, which was observed to be very small, by evaluating it on several production HPC systems, with different architectures and scales. We observed overhead against state-of-the-art benchmarks to also be very low and on par with other monitoring solutions. We already deployed DCDB in the context of several HPC research projects with successful results, and we expect to complete soon its deployment on all production HPC systems at LRZ.
As future work, we plan to further extend DCDB and develop further plugins in order to support a broader range of sensors and performance events, such as those deriving from GPU usage. Also, since application data in DCDB is currently only extracted from data sources such as CPU performance counters, we plan to implement plugins to collect profiling data as well, so as to extend the application analysis capabilities of DCDB. Moreover, we plan to implement a streaming data analytics layer highly-integrated in our framework, which will offer novel abstractions to aid in the implementation of algorithms for many data analytics applications in HPC, such as energy efficiency optimization or anomaly detection. This framework will be able to fetch live sensor data and perform online data analytics at the Collect Agent or Pusher level, and it will make use of features in our monitoring solution such as sensor caching, RESTful APIs, and the Pusher’s plugin-based architecture.
Acknowledgements.
The research leading to these results has received funding from the Mont-Blanc 1 and 2 projects and the DEEP project respectively under EU FP7 Programme grant agreements n. 288777, 61042 and 287530, and from the DEEP-EST project under the EU H2020-FETHPC-01-2016 Programme grant agreement n. 754304.References
- (1)
- int (2013) 2013. Intelligent Platform Management Interface Specification v2.0 rev. 1.1. Industry Specification. Intel Corporation, Hewlett-Packard Company, Dell Computer Corporation, NEC Corporation.
- Adhianto et al. (2010) Laksono Adhianto, Sinchan Banerjee, Mike Fagan, Mark Krentel, Gabriel Marin, John Mellor-Crummey, et al. 2010. HPCToolkit: Tools for performance analysis of optimized parallel programs. Concurrency and Computation: Practice and Experience 22, 6 (2010), 685–701.
- Agelastos et al. (2014) Anthony Agelastos, Benjamin Allan, Jim Brandt, Paul Cassella, Jeremy Enos, Joshi Fullop, et al. 2014. The lightweight distributed metric service: a scalable infrastructure for continuous monitoring of large scale computing systems and applications. In Proc. of SC 2014. IEEE, 154–165.
- Ahlgren et al. (2018) Ville Ahlgren, Stefan Andersson, Jim Brandt, Nicholas Cardo, Sudheer Chunduri, Jeremy Enos, et al. 2018. Large-Scale System Monitoring Experiences and Recommendations. In Proc. of CLUSTER 2018. IEEE, 532–542.
- ANSI/ASHRAE Standard 135-2008 (2010) ANSI/ASHRAE Standard 135-2008 2010. BACnet—A Data Communication Protocol for Building Automation and Control Networks. Standard. American Society of Heating, Refrigerating and Air-Conditioning Engineers (ASHRAE), Atlanta, GA.
- Barth (2008) Wolfgang Barth. 2008. Nagios: System And Network Monitoring (2 ed.). Open Source Press GmbH.
- Beneventi et al. (2017) Francesco Beneventi, Andrea Bartolini, Carlo Cavazzoni, and Luca Benini. 2017. Continuous learning of HPC infrastructure models using big data analytics and in-memory processing tools. In Proc. of DATE 2017. IEEE, 1038–1043.
- Boehme et al. (2016) David Boehme, Todd Gamblin, David Beckingsale, Peer-Timo Bremer, Alfredo Gimenez, Matthew LeGendre, Olga Pearce, and Martin Schulz. 2016. Caliper: performance introspection for HPC software stacks. In Proc. of SC 2016. IEEE, 47.
- Brandt et al. (2016) J Brandt, A Gentile, M Showerman, Jeremy Enos, Joshi Fullop, and G Bauer. 2016. Large-scale Persistent Numerical Data Source Monitoring System Experiences. In Proc. of the IPDPS Workshops 2016. IEEE, 1711–1720.
- Cappello et al. (2014) Franck Cappello, Al Geist, William Gropp, Sanjay Kale, Bill Kramer, and Marc Snir. 2014. Toward exascale resilience: 2014 update. Supercomputing frontiers and innovations 1, 1 (2014), 5–28.
- Carasso (2012) David Carasso. 2012. Exploring Splunk - Search processing Language (SPL) Primer and Cookbook (1 ed.). CITO Research.
- Case et al. (1990) Jeffrey Case, Mark Fedor, Martin Lee Schoffstall, and Davin James. 1990. A Simple Network Management Protocol (SNMP). RFC 1157. RFC Editor. 1–36 pages.
- Ţăpuş et al. (2002) Cristian Ţăpuş, I-Hsin Chung, and Jeffrey K. Hollingsworth. 2002. Active Harmony: Towards Automated Performance Tuning. In Proceedings of the 2002 ACM/IEEE Conference on Supercomputing (SC ’02). IEEE Computer Society Press, Los Alamitos, CA, USA, 1–11. http://dl.acm.org/citation.cfm?id=762761.762771
- Dongarra et al. (2003) Jack J Dongarra, Piotr Luszczek, and Antoine Petitet. 2003. The LINPACK benchmark: past, present and future. Concurrency and Computation: practice and experience 15, 9 (2003), 803–820.
- Eastep et al. (2017) Jonathan Eastep, Steve Sylvester, Christopher Cantalupo, Brad Geltz, Federico Ardanaz, Asma Al-Rawi, et al. 2017. Global Extensible Open Power Manager: A Vehicle for HPC Community Collaboration on Co-Designed Energy Management Solutions. In Proc. of ISC 2017. 394–412.
- Evans et al. (2014) Todd Evans, William L Barth, James C Browne, Robert L DeLeon, Thomas R Furlani, Steven M Gallo, et al. 2014. Comprehensive Resource Use Monitoring for HPCSystems with TACC Stats. In Proc. of the HUST Workshop 2014. IEEE, 13–21.
- Ferreira et al. (2008) Kurt B Ferreira, Patrick Bridges, and Ron Brightwell. 2008. Characterizing application sensitivity to OS interference using kernel-level noise injection. In Proc. of SC 2008. IEEE, 19.
- Giménez et al. (2017) Alfredo Giménez, Todd Gamblin, Abhinav Bhatele, Chad Wood, Kathleen Shoga, Aniruddha Marathe, Peer-Timo Bremer, Bernd Hamann, and Martin Schulz. 2017. ScrubJay: deriving knowledge from the disarray of HPC performance data. In Proc. of SC 2017. ACM, 35.
- Guillen et al. (2014) Carla Guillen, Wolfram Hesse, and Matthias Brehm. 2014. The PerSyst Monitoring Tool - A Transport System for Performance Data Using Quantiles. In Proc. of the Euro-Par 2014 Workshops (Lecture Notes in Computer Science), Vol. 8806. Springer, 363–374.
- Jones et al. (2012) William M Jones, John T Daly, and Nathan DeBardeleben. 2012. Application monitoring and checkpointing in HPC: looking towards exascale systems. In Proc. of ACM-SE 2012. ACM, 262–267.
- Kunen et al. (2015) Adam J Kunen, Teresa S Bailey, and Peter N Brown. 2015. KRIPKE-a massively parallel transport mini-app. Technical Report. Lawrence Livermore National Lab.(LLNL), Livermore, CA (United States).
- Light (2017) Roger A Light. 2017. Mosquitto: server and client implementation of the MQTT protocol. The Journal of Open Source Software 2, 13 (2017), 265.
- Locke (2010) Dave Locke. 2010. Mq telemetry transport (mqtt) v3. 1 protocol specification. IBM developerWorks Technical Library (2010), 15.
- Massie et al. (2004) Matthew L Massie, Brent N Chun, and David E Culler. 2004. The ganglia distributed monitoring system: design, implementation, and experience. Parallel Comput. 30, 7 (2004), 817–840.
- Miceli et al. (2015) Renato Miceli, Anca Berariu, and Michael Gerndt. 2015. Introduction to Automatic Tuning of HPC Applications: The Periscope Tuning Framework. 1–14.
- Mills (1991) David L Mills. 1991. Internet time synchronization: the network time protocol. IEEE Transactions on communications 39, 10 (1991), 1482–1493.
- Mittal (2014) Sparsh Mittal. 2014. Power management techniques for data centers: A survey. arXiv preprint arXiv:1404.6681 (2014).
- Olups (2016) Rihards Olups. 2016. Zabbix Network Monitoring (2 ed.). Packt Publishing.
- Plimpton (1995) Steve Plimpton. 1995. Fast parallel algorithms for short-range molecular dynamics. Journal of computational physics 117, 1 (1995), 1–19.
- Richards et al. (2017) David F Richards, Ryan C Bleile, Patrick S Brantley, Shawn A Dawson, Michael Scott McKinley, and Matthew J O’Brien. 2017. Quicksilver: a proxy app for the Monte Carlo transport code mercury. In Proc. of CLUSTER 2017. IEEE, 866–873.
- Roth et al. (2003) Philip C. Roth, Dorian C. Arnold, and Barton P. Miller. 2003. MRNet: A Software-Based Multicast/Reduction Network for Scalable Tools. In Proc. of SC 2003. ACM, 21.
- Sarood et al. (2014) Osman Sarood, Akhil Langer, Abhishek Gupta, and Laxmikant Kale. 2014. Maximizing throughput of overprovisioned hpc data centers under a strict power budget. In Proc. of SC 2014. IEEE, 807–818.
- Shende and Malony (2006) Sameer S Shende and Allen D Malony. 2006. The TAU parallel performance system. The International Journal of High Performance Computing Applications 20, 2 (2006), 287–311.
- Treibig et al. (2010) Jan Treibig, Georg Hager, and Gerhard Wellein. 2010. Likwid: A lightweight performance-oriented tool suite for x86 multicore environments. In Proc. of the ICPP 2010 Workshops. IEEE, 207–216.
- Vetter et al. (2018) Jeffrey S. Vetter, Ron Brightwell, Maya Gokhale, Pat McCormick, Rob Ross, John Shalf, et al. 2018. Extreme Heterogeneity 2018 - Productive Computational Science in the Era of Extreme Heterogeneity: Report for DOE ASCR Workshop on Extreme Heterogeneity. (12 2018).
- Villa et al. (2014) Oreste Villa, Daniel R Johnson, Mike Oconnor, Evgeny Bolotin, David Nellans, Justin Luitjens, et al. 2014. Scaling the power wall: a path to exascale. In Proc. of SC 2014. IEEE, 830–841.
- Wang and Tang (2012) Guoxi Wang and Jianfeng Tang. 2012. The nosql principles and basic application of cassandra model. In Proc. of CSSS 2012. IEEE, 1332–1335.
- Weaver (2013) Vincent M Weaver. 2013. Linux perf_event features and overhead. In Proc. of the FastPath Workshop 2013, Vol. 13.
- Yang et al. (2002) Ulrike Meier Yang et al. 2002. BoomerAMG: a parallel algebraic multigrid solver and preconditioner. Applied Numerical Mathematics 41, 1 (2002), 155–177.