Deep Active Learning for Anchor User Prediction
Abstract
Predicting pairs of anchor users plays an important role in the cross-network analysis. Due to the expensive costs of labeling anchor users for training prediction models, we consider in this paper the problem of minimizing the number of user pairs across multiple networks for labeling as to improve the accuracy of the prediction. To this end, we present a deep active learning model for anchor user prediction (DALAUP for short). However, active learning for anchor user sampling meets the challenges of non-i.i.d. user pair data caused by network structures and the correlation among anchor or non-anchor user pairs. To solve the challenges, DALAUP uses a couple of neural networks with shared-parameter to obtain the vector representations of user pairs, and ensembles three query strategies to select the most informative user pairs for labeling and model training. Experiments on real-world social network data demonstrate that DALAUP outperforms the state-of-the-art approaches.
1 Introduction
Social network users often join multiple social networks to obtain versatile services. For example, a user can be simultaneously active in both Foursquare and Twitter. These users are often termed as anchor users who often generate rich data for cross-network analysis. Advanced services for anchor users include cross-network recommendation Li and Lin (2014), link prediction Zhang et al. (2013) and information diffusion analysis Peng et al. (2013). However, cross-network data generated from the anchor users are difficult to collect, because these users rarely use the same identities in different social networks, which poses difficulties for advancing cross network applications. Therefore, identifying anchor users across multiple social networks has attracted increasing research interests in recent years Man et al. (2016).
To identify anchor users, previous work Liu et al. (2013); Riederer et al. (2016) try to collect and combine users’ demographic data and daily-generated content data for estimation. For example, they often combine users’ registration profile data such as names, genders and locations, and their daily-generated tweets, posts, blogs, reviews and ratings for analysis. However, it is difficult to obtain sufficient and correct demographic data and daily generated content data for prediction. As a result, the prediction accuracy of anchor users is often unstable and unsatisfactory.
Recently, researchers turn to social link data to predict anchor users Liu et al. (2016); Man et al. (2016), because social link data, compared to demographic data and daily-generated content data, are much more reliable in terms of correctness and completeness. Existing works that use network structures for anchor user prediction can be divided into three categories, the unsupervised, supervised and semi-supervised models Shu et al. (2017), according to whether or to what extent the anchor user data can be observed and collected before model training.
The unsupervised models are proposed to solve unlabeled social structure data. These methods are proved to be equivalent to the network alignment problem Singh et al. (2007); Klau (2009); Kollias et al. (2012), which falls into the NP-hard combinatorial optimization. As a consequent, these approaches are either limited to small networks or only applicable to large but sparse networks Man et al. (2016). The supervised models are used for predicting anchor users with training labels, which often generate accurate results when the number of labeled anchor users are adequate Kong et al. (2013); Man et al. (2016). Last but not least, the semi-supervised models can leverage both labeled and unlabeled training data for model training. Note that in semi-supervised models the unlabeled anchor users can be predicted during the learning process Tan et al. (2014); Liu et al. (2016).
Obviously, the number of labeled anchor users plays a critical role in building an accurate anchor user prediction model. In order to reduce the number of training examples, Active Learning (AL) has been widely used to label training examples by iteratively selecting the most informative data for labeling at each round Settles (2009). In this paper, we wish to design an economic anchor user prediction model based on the active learning method. To reduce the cost of labeling user pairs in social networks, we need to address the following challenges:
-
•
Challenge 1. In this paper, active learning algorithm builds on non-independently and identically distributed data. Our anchor user prediction problem needs to consider social structure data obtained from multiple networks where both anchor and non-anchor user pairs exist.
-
•
Challenge 2. The anchor user pairs and the non-anchor user pairs are interlocked (or correlated). The interlock means that if is a pair of anchor users, and are unlikely to be a pair of anchor users when and . Hence, the query strategy of active learning should consider the interlock property among all the unlabeled user pairs.
-
•
Challenge 3. There are two components in the anchor user prediction framework, i.e., the active sampling component and the anchor user prediction component. How to iteratively reinforce the two components and minimize the labeling cost is non-trivial.
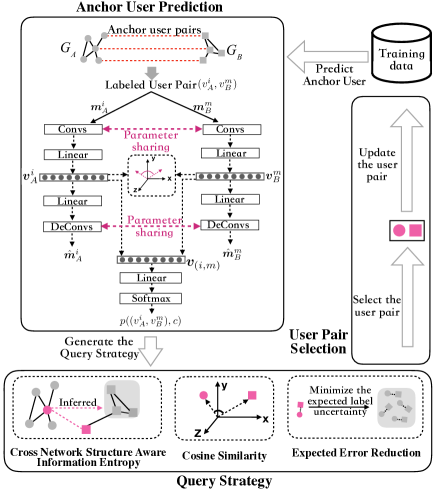
To address the above challenges, we present a Deep Active Learning model for Anchor User Prediction (DALAUP for short). The framework of the proposed method is illustrated in Fig. 1. From this figure, we can observe the three key components of the DALAUP method, i.e., the anchor user prediction component, the query strategy component and the user pair selection component. To solve Challenge 1, DALAUP uses a couple of convolution and deconvolution networks with shared-parameter to jointly analyze multiple social networks and obtain the representation vectors for cross-network user pairs, where structure information from both single-network and cross-network are jointly considered. To solve Challenge 2, in the query strategy component, DALAUP uses three different criteria for active learning query, i.e., the cross network structure aware information entropy, the cosine similarity and the expected error reduction. To solve Challenge 3, DALAUP adaptively selects user pairs by ensembling the three query methods to estimate the most informative user pairs for labeling. The main contributions of this work are summarized as follows,
-
•
We are the first to study the problem of active learning for anchor user prediction across multiple social networks, where user data are non-i.i.d. distributed.
-
•
We propose a new model DALAUP by integrating active sampling and anchor user prediction. Based on the rewards of the two components, they can reinforce each other via updating parameters iteratively.
-
•
We conduct experiments on real-world data sets to verify the performance of DALAUP. The results demonstrate the effectiveness of our model compared with the state-of-the-art.
2 Preliminaries
Given two users in two different social networks, if they share the same identity in the real-world, we call them as an anchor user pair. The anchor user prediction aims to find out these anchor user pairs.
Formally, given two social networks represented as and , where , are two sets of users, and , are two sets of undirected edges. Denote the sizes and . Let denote a labeled set of pairs of anchor (or non-anchor) users, where and . Let denote an unlabeled set, where is the Cartesian product. We wish to design an active anchor user prediction model which selects a small portion of pairs of users from . Then, based on the labeled pairs of users, we can build accurate prediction models for anchor users.
In the active learning, we aim to design a set of query functions and a selection function of pairs of users which can select a small portion of pairs of users from for labeling. This sampling and labeling process runs continuously until a given budget of labeling limit is reached. In the next section, we will formally define the learning function.
3 The DALAUP Model
We introduce the DALAUP model for anchor user prediction under the active learning setting.
3.1 Anchor User Prediction
Given , and , we first extract the structural context for each user in both networks and , based on which we design a classifier for predicting the labels of pairs of users.
3.1.1 Structural Context
Given a social network , we wish to use a vector to represent each user , where indicates the probability of visiting after -step transitions initiated from . The transitions are usually controlled by random walks with restart Tong et al. (2006) with a parameter . Specifically, each transition either returns to with probability , or goes forward with probability . As a result, can be calculated iteratively as follows,
| (1) |
where is the normalized weighted matrix of with sums of the rows to be 1, and is the initial vector with the -th entry to be and the remaining entries .
To capture contextual information of network structures, we define the structural context of user to be,
| (2) |
where indicates the number of steps. Following the same logic, we can obtain the structural context for each user . These structural contexts are served as the input of the following neural network architecture.
3.1.2 Representation of Pairs of Users Across Networks
We wish to learn stable representations of pairs of users based on the structural context defined above. To preserve the structure information of a single network, we use both convolution and deconvolution neural networks to represent social networks Niepert et al. (2016). The convolution neural network in our model consists of convolution layers. Let be the input of user at the first convolution layer and
| (3) |
be the output of the -th convolution layer, where and represents the convolution operation, is a non-linear activation function such as Sigmoid. is a weight parameter and is the bias. We use to denote the vector representation of user , where is a fully connected linear layer with a parameter set .
By using the deconvolution architecture, we can obtain the reconstruct representation for user . Similarly, we can obtain representation and reconstruct representation for user with the parameters in full connected linear layer and the shared-parameters in convolution layers.
The goal of preserving the structure information of a single network is to minimize the reconstruction error as follows,
| (4) |
We consider anchor users to be similar in their representation spaces. Then, the loss of representing cross-network information with respect to anchor users can be formulated as follows,
where is a cosine similarity function, is a set of pairs of anchor users, is a set of pairs of non-anchor users, and is the margin.
3.1.3 Anchor User Pair Classification
Based on the anchor user representation and discussed above, we further design a classifier to estimate a pair of users , e.g., is a pair of anchor users when , otherwise, a pair of non-anchor users. The probability of a pair of users belongs to class can be defined as follows,
| (6) |
where is an aggregated representation of a pair of users , and is a fully connected linear layer with a parameter set . The loss function under the cross entropy measure can be formulated as follows,
| (7) |
where is the true label of a pair of anchor users .
In other words, the objective function of anchor user prediction can be formulated by minimizing the function as follows,
| (8) |
where is an -norm regularizer term to prevent over-fitting and , , are hyper-parameters to tradeoff the four parts.
3.2 Query Strategy
Based on the prediction of pairs of anchor users, we have two networks , , a labeled data set and an unlabeled data set . Moreover, we obtain the representations of all nodes in , , and the prediction probability for unlabeled pair in . Then, we wish to design query strategies to choose the most informative user pairs for labeling.
The anchor user pairs and non-anchor user pairs are interlocked. Once an anchor user pair is labeled, we can infer a large set of non-anchor user pairs. Thus, anchor user pairs are more valuable and informative for labeling than non-anchor user pairs. Here, we design two strategies cross network information entropy and cosine similarity to find user pairs which are more likely to be anchor ones. Moreover, we propose the third query strategy expected error reduction to maximize the label certainty of the unlabeled use pairs.
3.2.1 Cross Network Structure Aware Information Entropy
Given two networks , and a labeled set , according to Eq. (6), we can obtain the probability of the candidate user pair belonging to class . The measure function for unknown label of each unlabeled user pair is defined as follows,
| (9) |
where is the reward function to measure the labeling outcome . For information entropy, reward function can be defined as follows,
| (10) |
Due to the interlock between anchor user pairs and non-anchor user pairs, the reward for labeling anchor user pairs is much more important than labeling non-anchor ones. Let denote a set of non-anchor user pairs inferred from when it is labeled to be anchor one, we modify the reward function in Eq. (10) to be,
and
| (11) |
Based on the new measure functions, we enable the cross network information entropy for candidate user pairs in , i.e., the larger , the more informative we obtain.
3.2.2 Cosine Similarity
After predicting the anchor users, we obtain the representations of , in the low-dimensional vector space. Since the anchor user pairs are similar between their representation vectors as in Eq. (3.1.2), we adopt the cosine similarity to query each candidate user pair . The cosine similarity based query strategy is defined as follows,
| (12) |
The larger is, the more valuable is.
3.2.3 Expected Error Reduction
For , we introduce the expected error reduction query strategy, based on the prediction performance on the remaining unlabeled instances Aggarwal et al. (2014). The expected error reduction aims to choose to maximize the label certainty of use pairs in . Intuitively, the estimated label of relates the probability . Thus, the error reduction based query for can be defined as follows,
| (13) | |||
where is the probability that user pair belongs to class , which can be calculated by Eq. (6) with being added to . The bigger is, the more helpful is for maximizing the label certainty of pairs in .
3.3 Active User Pair Selection Mechanism
Based on the above query strategies, a natural question is how to choose one candidate at each iteration for labeling. As the prediction performance tends to get better when the labeled data set becomes larger after adding the labeled user pairs at each iteration, it is intuitive that the rewards are not independent random variables at different iterations. In this paper the reward is defined as the average rise of Precision@30 and MAP@30, which can be estimated on the validate data. The recommended user pairs of the strategy are influenced by the recommendation results at previous iterations.
To simulate the adversarial setting, we use the multi-armed bandit method as the solution Auer et al. (2002). To adaptively select the most informative user pairs, we adjust the -greedy algorithm to make a trade-off between exploitation and exploration, where the exploration probability is time-sensitive, e.g. for different iteration . At the -th iteration, we first sample an according to . The selection randomly selects a query strategy with probability (Exploration); Otherwise, it selects the one with the highest historical mean reward (Exploitation).
Specifically, let denote the historical mean reward of the query strategy at the first active learning iterations, then the query strategy at the -th iteration can be chosen as below,
| (14) |
where is a sample from . With the iteration time increasing, is expected to decrease, which will reduce the attention onto the exploitation.
Let be the time of query strategy employed at the first iteration. Assume the query strategy is employed in the -th iteration, then the historical mean reward and employ times of can be updated through,
| (15) |
and with . Meanwhile, , , and . The update is similar, when or is employed at the -th iteration.
3.4 Algorithms
The algorithm for solving DALAUP is summarized in Algorithm 1, where denotes a set of the learnable parameters in the anchor user prediction component at the -th iteration, where .
4 Experiments
In this section, we compare DALAUP with existing baseline methods on real world social networks. Experimental results show the effectiveness of DALAUP compared with the state-of-the-art methods. 222https://github.com/chengaf/DALAUP.
4.1 Data Sets
We use Foursquare and Twitter Kong et al. (2013) as the testbed. All the anchor user pairs are known in these data sets. The statistics are listed in Table 1.
We consider the labeled anchor user pairs as positive data and the inferred or labeled non-anchor user pairs as negative data. In the training process, we adopt undersampling to balance positive and negative data Japkowicz and Stephen (2002). In our experiment, we randomly sample two non-anchor user pairs corresponding to an anchor user pair.
| Network | User | Relation | Anchor User |
|---|---|---|---|
| Foursquare | 5,313 | 76,972 | 3,141 |
| 5,120 | 164,919 |
4.2 Baseline Methods and Evaluation Metrics
In order to evaluate the effectiveness of DALAUP, we choose the state-of-the-art unsupervised, supervised and semi-supervised methods for comparison,
-
•
DW: DeepWalk Perozzi et al. (2014). An unsupervised method which first represents two social networks to a low-dimensional vector space and then calculates cosine similarity between vector representations of cross-network user pairs to predict anchor user.
-
•
PALE: Predicting Anchor Links via Embedding Man et al. (2016). A supervised model that learns network embedding with extended structural information.
-
•
IONE: Input-output Network Embedding Liu et al. (2016). A semi-supervised approach that gets aligned vector representations for multiple networks.
In addition, we introduce some variants of DALAUP for comparison, including
-
•
AUP: Anchor User Prediction method proposed in this paper, which is a supervised manner.
-
•
DALAUP-saie, DALAUP-eer, DALAUP-cs, DALAUP-ie, and DALAUP-Rand.: the variants of DALAUP distinguished by their different AL query strategies, i.e., DALAUP-saie ia an active anchor user prediction model with only one query strategy defined by Eq. (9) and Eq. (11). Same argument for DALAUP-eer and DALAUP-cs. Besides, DALAUP-ie is a simplified model of DALAUP-saie with a query strategy in which is defined by Eq. (10). The last method DALAUP-Rand. is to randomly select user pairs from unlabeled set to label.
4.3 Parameter Setting
The optimal parameter settings for each method are either determined by experiments or taken from the suggestions by previous works. Following Perozzi et al. (2014), we use the default parameter setting for DW, i.e., window size is and walks per user is . In our method, we set the restart probability to Tong et al. (2006) and the number of convolution layers . Margin in is set to . The other parameters are set as: , .
4.4 Results and Analysis
To evaluate the effectiveness of DALAUP, we conduct two parts of experiments: effectiveness of AUP and effectiveness of DALAUP. For all experiments, we repeat the process times and report the average results to test the statistical significance of the comparison results.
4.4.1 Effectiveness of AUP
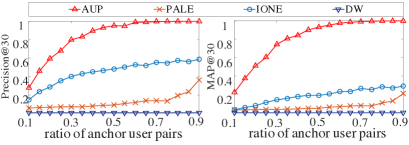
In this experiment, different ratios of anchor user pairs are sampled randomly as positive data and the corresponding inferred non-anchor user as negative data for training. The remaining ones are viewed as test data. We set ratio respectively and fix the representation dimension Liu et al. (2016). Experiment results are shown in Fig. 2.
From Fig. 2, we can observe that the performance of our supervised method AUP is significantly better than the other comparing methods. Specially, when the ratio comes to , IONE can achieve about and in Precision@30 and MAP@30, while AUP can obtain and in these two measures.
4.4.2 Effectiveness of DALAUP
In this part, we investigate the effectiveness of the AL query strategies and the select mechanism proposed in section 3.2 and 3.3. To ensure that the performance difference in the experiments is solely caused by different AL query strategies and their select mechanism, we first randomly split the whole anchor user data into four parts: an initial training set to build an initial model, a validate set to get the rewards of different query strategies, a test set to evaluate the performance of the model, and an unlabeled set to select user pairs Shen et al. (2004).
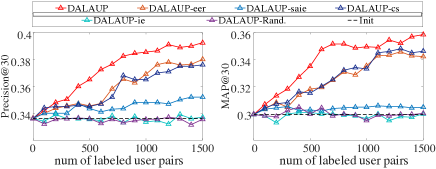
The size of anchor user pairs in each part is 100, 300, 600 and 2,141 respectively. According to the interlock property, the non-anchor user pairs can be inferred from the anchor user pair set. At each iteration, we select a small batch of user pairs by following our AL query strategies, add the real label on them, and put them into the training set. The batch size and the maximum size . The performance comparisons of different query strategies with the different number of queried user pairs are shown in Fig. 3, in which the dotted line is the performance of the AUP model without any newly labeled information being added.
From Fig. 3, we can observe that:
-
•
DALAUP significantly outperforms all the other methods in terms of both Precision@30 and MAP@30, which demonstrates that the proposed active user pair selection methods is effective in improving the prediction performance.
-
•
The poor results of DALAUP-Rand. further validate the effectiveness of the proposed AL query strategies.
-
•
Compared to information entropy DALAUP-ie, the modified DALAUP-saie method largely improves Precision@30 and MAP@30, which proves that cross network structure information can be used to ameliorate information entropy.
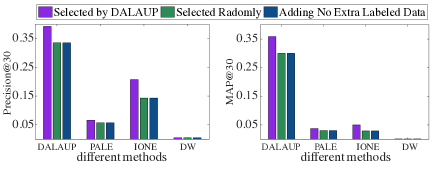
In addition, we investigate the performance of different anchor link prediction methods when adding 1500 extra labeled user pairs. These labeled data are selected in two manners. One is to select by DALAUP , while the other is to select randomly. For the convenience comparison, we also add the performance of these methods with no extra labeled data added.
The results are shown in Fig. 4, from which we can observe that:
-
•
DALAUP outperforms all the other methods, no matter the data selected by itself or by random.
-
•
The labeled data, selected by DALAUP, can improve performance for the baselines.
-
•
The randomly selected 1500 data for labeling cannot help better the benchmark methods, which confirms the importance of active selection methods.
5 Conclusion
In this paper, we present a deep active learning based method DALAUP to solve the anchor user prediction problem. We design a couple of convolution and deconvolution networks with shared-parameter to estimate the vector representations of cross-network anchor users. To solve the correlation difficulty of labeling anchor user pairs and non-anchor user pairs, we design three query strategies and a time-sensitive user pair selection algorithm for precisely selecting pairs of users for labeling . Experiments on real-world social network datasets demonstrate the effectiveness and efficiency of the proposed DALAUP method.
Acknowledgments
This work was supported in part by the National Key Research and Development Program of China (No. 2016YFB0801301), the NSFC (No. 61872360), the MQNS (No. 9201701203), the MQEPS (No. 90275252 and No. 96804590), the MQRSG (No. 95109718), the Youth Innovation Promotion Association CAS (No. 2017210), and the Investigative Analytics Collaborative Research Project between Macquarie University and Data61 CSIRO.
References
- Aggarwal et al. (2014) Charu C Aggarwal, Xiangnan Kong, Quanquan Gu, Jiawei Han, and Philip S Yu. Active learning: A survey. 2014.
- Auer et al. (2002) Peter Auer, Nicolo Cesa-Bianchi, Yoav Freund, and Robert E Schapire. The nonstochastic multiarmed bandit problem. SIAM journal on computing, 32(1):48–77, 2002.
- Japkowicz and Stephen (2002) Nathalie Japkowicz and Shaju Stephen. The class imbalance problem: A systematic study. Intelligent data analysis, 6(5):429–449, 2002.
- Klau (2009) Gunnar W Klau. A new graph-based method for pairwise global network alignment. BMC bioinformatics, 10(1):S59, 2009.
- Kollias et al. (2012) Giorgos Kollias, Shahin Mohammadi, and Ananth Grama. Network similarity decomposition (nsd): A fast and scalable approach to network alignment. IEEE Transactions on Knowledge and Data Engineering, 24(12):2232–2243, 2012.
- Kong et al. (2013) Xiangnan Kong, Jiawei Zhang, and Philip S Yu. Inferring anchor links across multiple heterogeneous social networks. In Proceedings of the 22nd ACM international conference on Information & Knowledge Management, pages 179–188. ACM, 2013.
- Li and Lin (2014) Chung-Yi Li and Shou-De Lin. Matching users and items across domains to improve the recommendation quality. In Proceedings of the 20th ACM SIGKDD international conference on Knowledge discovery and data mining, pages 801–810. ACM, 2014.
- Liu et al. (2013) Jing Liu, Fan Zhang, Xinying Song, Young-In Song, Chin-Yew Lin, and Hsiao-Wuen Hon. What’s in a name?: an unsupervised approach to link users across communities. In Proceedings of the sixth ACM international conference on Web search and data mining, pages 495–504. ACM, 2013.
- Liu et al. (2016) Li Liu, William K Cheung, Xin Li, and Lejian Liao. Aligning users across social networks using network embedding. In IJCAI, pages 1774–1780, 2016.
- Man et al. (2016) Tong Man, Huawei Shen, Shenghua Liu, Xiaolong Jin, and Xueqi Cheng. Predict anchor links across social networks via an embedding approach. In IJCAI, volume 16, pages 1823–1829, 2016.
- Niepert et al. (2016) Mathias Niepert, Mohamed Ahmed, and Konstantin Kutzkov. Learning convolutional neural networks for graphs. In International conference on machine learning, pages 2014–2023, 2016.
- Peng et al. (2013) Chuan Peng, Kuai Xu, Feng Wang, and Haiyan Wang. Predicting information diffusion initiated from multiple sources in online social networks. In 2013 Sixth International Symposium on Computational Intelligence and Design, volume 2, pages 96–99. IEEE, 2013.
- Perozzi et al. (2014) Bryan Perozzi, Rami Al-Rfou, and Steven Skiena. Deepwalk: Online learning of social representations. In Proceedings of the 20th ACM SIGKDD international conference on Knowledge discovery and data mining, pages 701–710. ACM, 2014.
- Riederer et al. (2016) Christopher Riederer, Yunsung Kim, Augustin Chaintreau, Nitish Korula, and Silvio Lattanzi. Linking users across domains with location data: Theory and validation. In Proceedings of the 25th International Conference on World Wide Web, pages 707–719. International World Wide Web Conferences Steering Committee, 2016.
- Settles (2009) Burr Settles. Active learning literature survey. University of Wisconsinmadison, 39(2):12–C131, 2009.
- Shen et al. (2004) Dan Shen, Jie Zhang, Jian Su, Guodong Zhou, and Chew-Lim Tan. Multi-criteria-based active learning for named entity recognition. In Proceedings of the 42nd Annual Meeting on Association for Computational Linguistics, page 589. Association for Computational Linguistics, 2004.
- Shu et al. (2017) Kai Shu, Suhang Wang, Jiliang Tang, Reza Zafarani, and Huan Liu. User identity linkage across online social networks: A review. Acm Sigkdd Explorations Newsletter, 18(2):5–17, 2017.
- Singh et al. (2007) Rohit Singh, Jinbo Xu, and Bonnie Berger. Pairwise global alignment of protein interaction networks by matching neighborhood topology. In Annual International Conference on Research in Computational Molecular Biology, pages 16–31. Springer, 2007.
- Tan et al. (2014) Shulong Tan, Ziyu Guan, Deng Cai, Xuzhen Qin, Jiajun Bu, and Chun Chen. Mapping users across networks by manifold alignment on hypergraph. In Twenty-Eighth AAAI Conference on Artificial Intelligence, 2014.
- Tong et al. (2006) Hanghang Tong, Christos Faloutsos, and Jia-Yu Pan. Fast random walk with restart and its applications. In Sixth International Conference on Data Mining (ICDM’06), pages 613–622. IEEE, 2006.
- Zhang et al. (2013) Jiawei Zhang, Xiangnan Kong, and S Yu Philip. Predicting social links for new users across aligned heterogeneous social networks. In 2013 IEEE 13th International Conference on Data Mining, pages 1289–1294. IEEE, 2013.