The Near and Mid-infrared photometric properties of known redshift Quasars
Abstract
We assemble a catalogue of 488 spectroscopically confirmed very high () redshift quasars and report their near- () and mid- (WISE W1234) infrared properties. 97% of the VHQ sample is detected in one or more NIR () band, with lack of coverage rather than lack of depth being the reason for the non-detections. 389 (80%) of the very high redshift quasars are detected at 3.4m in the W1 band from the unWISE catalog and all of the quasars are detected in both unWISE W1 and W2. Using archival WFCAM/UKIRT and VIRCAM/VISTA data we check for photometric variability that might be expected from super-Eddington accretion. We find 28 of the quasars have sufficient NIR measurements and signal-to-noise ratio to look for variability. Weak variability was detected in multiple bands of SDSS J0959+0227, and very marginally in the -band of MMT J0215-0529. Only one quasar, SDSS J0349+0034, shows significant differences between WFCAM and VISTA magnitudes in one band. With supermassive black hole accretion likely to be redshift invariant up to very high-redshift, further monitoring of these sources is warranted. All the data, analysis codes and plots used and generated here can be found at: github.com/d80b2t/VHzQ.
keywords:
Astronomical data bases: surveys – Quasars: general – galaxies: evolution – galaxies: infrared.1 Introduction
Very high redshift quasars (VHQ; defined here to have redshifts ) are excellent probes of the early Universe. This includes studies of the Epoch of Reionization for hydrogen (see e.g. Fan et al., 2006a; Mortlock, 2016, for reviews), the formation and build-up of supermassive black holes (e.g., Rees, 1984; Wyithe & Loeb, 2003; Volonteri, 2010; Agarwal et al., 2016; Valiante et al., 2018; Latif et al., 2018; Wise et al., 2019) and early metal enrichment (see e.g., Simcoe et al., 2012; Chen et al., 2017; Bosman et al., 2017).
Super-critical accretion, where , is a viable mechanism to explain the high, potentially super-Eddington, luminosity and rapid growth of supermassive black holes in the early universe (e.g., Alexander & Natarajan, 2014; Madau et al., 2014; Volonteri et al., 2015; Pezzulli et al., 2016; Lupi et al., 2016; Pezzulli et al., 2017; Takeo et al., 2018). Thus, one could expect VHQs to potentially vary in luminosity as they go through phases of super-critical accretion. These signatures of photometric variability should be looked for, noting the rest-frame optical emission is redshifted into the observed near-infrared (NIR) at redshifts , and relativistic time dilation also stretches the photometric variability of the accretion disk as observed. Fortunately, data are now in place from deep, wide-field NIR instruments and surveys such as the Wide Field Camera (WFCAM) instrument on the United Kingdom Infra-Red Telescope (UKIRT) in the Northern Hemisphere and the VISTA InfraRed CAMera (VIRCAM) on the Visible and Infrared Survey Telescope for Astronomy (VISTA) in the Southern Hemisphere, that are necessary for identifying VHQs.
Quasars are known to be prodigious emitters of infrared emission, thought to be from the thermal emission of dust grains heated by continuum emission from the accretion disc (e.g., Richards et al., 2006; Leipski et al., 2014; Hill et al., 2014; Hickox et al., 2017). Observations in the mid-infrared, e.g. 3-30m allow discrimination between AGN111Historically, “quasars” and “Active Galactic Nuclei (AGN)” have described different luminosity/classes of objects. In recognition of the fact that both terms describe accreting supermassive black holes, we use these terms interchangeably, with a preference for quasar, since we are generally in the higher- regime (e.g. Haardt et al., 2016). and passive galaxies due to the 1.6m “bump” entering the MIR at (e.g., Wright et al., 1994; Sawicki, 2002; Lacy et al., 2004; Stern et al., 2005; Richards et al., 2006; Timlin et al., 2016) as well as between AGN and star-forming galaxies due to the presence of Polycyclic Aromatic Hydrocarbon (PAHs) at m (e.g., Yan et al., 2007; Tielens, 2008).
Jiang et al. (2006) and Jiang et al. (2010) report on the discovery of a quasar without hot-dust emission in a sample of 21 quasars. Such apparently hot-dust-free quasars have no counterparts at low redshift. Moreover, those authors demonstrate that the hot-dust abundance in the 21 quasars builds up in tandem with the growth of the central black hole. But understanding how dust first forms and appears in the central engine remains an open question (Wang et al., 2008, 2011).
WISE mapped the sky in 4 passbands, in bands centered at wavelengths of 3.4, 4.6, 12, and 23m. The all sky ‘AllWISE’ catalogue release, contains nearly 750 million detections at high-significance222wise2.ipac.caltech.edu/docs/release/allwise/expsup/sec2_1.html, of which over 4.5M AGN candidates have been identified with 90% reliability (Assef et al., 2018). Blain et al. (2013) presented WISE mid-infrared (MIR) detections of 17 (55%) of the then known 31 quasars at . However, Blain et al. (2013) was compiled with the WISE ‘All-Sky’ data release, as opposed to the superior AllWISE catalogues. That sample only examined the 31 known quasars; our sample has 174 objects with redshift (with 117 detected in WISE). Bañados et al. (2016) reports WISE W1, W2, W3 and W4 magnitudes for the Panoramic Survey Telescope and Rapid Response System 1 (Pan-STARRS1, PS1; Kaiser et al., 2002, 2010), but with no further investigation into the reddest WISE waveband for the VHQs.
Critically, we now have available to us new W1 and W2 photometry from the ‘unWISE Source Catalog’ (Schlafly et al., 2019), a WISE-selected catalogue that is based on significantly deeper imaging and has a more extensive modeling of crowded regions than the AllWISE release. For the first time in a catalogue, unWISE takes advantage of the ongoing mid-IR Near-Earth Object Wide-Field Infrared Survey Explorer Reactivation mission (NEOWISE-R; Mainzer et al., 2014), and achieves depths 0.7 mag deeper than AllWISE (in W1/2). This additional depth is a significant advantage in the detection and study of VHQs in the 3-5 micron regime.
Here we present for the first time the combined near-infrared properties (from UKIRT and VIRCAM) and the new mid-infrared unWISE for all the spectroscopically known quasars. Our motivations are numerous and include: (i) establishing the first complete catalogue of quasars since the pioneering work from SDSS; (ii) utilizing all the WFCAM and VISTA near-infrared photometry available for the quasars; (iii) making the first study of near- and mid-IR variability of the VHzQ population and (iv) establishing the photometric properties for upcoming surveys and telescopes including the Large Synoptic Survey Telescope (LSST)333lsst.org;, ESA Euclid444sci.esa.int/euclid; and the James Webb Space Telescope (JWST)555jwst.nasa.gov;,666sci.esa.int/jwst;,777www.asc-csa.gc.ca/eng/satellites/jwst;,888jwst.stsci.edu.. We chose redshift as our lower redshift limit due to a combination of garnishing a large sample, adequately spanning physical properties (e.g. luminosity, age of the Universe) and to highlight the parts of parameter space where quasars still wait to be discovered.
This paper is organized as follows. In Section 2, we present the assembled list of the 488 VHQs that we have compiled. We then give a high-level overview of the photometric surveys and datasets we use and present the photometry of the VHQs. In Section 3 we investigate the variability properties of the VHQs, looking for evidence of super-critical accretion. In Section 4 we calculate how many quasars we should expect to find in current datasets. We conclude in Section 5 and present all the necessary details to obtain our dataset in the Appendices.
We present all our photometry and magnitudes on the AB system. For NIR, we use the Oke & Gunn (1983) and Fukugita et al. (1996) system which has a zeropoint of . For WISE, the AB-Vega offsets are calculated using the Tokunaga & Vacca (2005) AB system, which has a zeropoint of -48.574. So to remain on the -48.60 system, and assuming a flux density F, one needs to subtract 0.026 mag from the zeropoints: (W1, W2, W3) = (2.673, 3.313, 5.148). For W4, we use the calibration of Brown et al. (2014), W4= 6.66. These magnitudes are not Galactic extinction corrected.
We use a flat CDM cosmology with km s-1 Mpc-1, , and Planck Collaboration (2016) to be consistent with Bañados et al. (2016) and all logarithms are to the base 10.
2 Method and Data
Quasars are generally identified by photometric selection followed by spectroscopic confirmation. Here, we reverse this method obtaining first a list of spectroscopic quasars and then obtain photometric information.
We have compiled a list of 488 quasars with redshifts . We use all the quasars that have been discovered, spectroscopically confirmed and published as of 2018 December 31 (MJD 58483). We then obtain optical, near-infrared and mid-infrared photometry for the spectral dataset. The near-infrared data comes from two sources: first, the WFCAM (Casali et al., 2007) on the UKIRT, primarily, but not exclusively, as part of the UKIRT Infrared Deep Sky Survey (UKIDSS; Lawrence et al., 2007). And second, data from the VIRCAM on the VISTA (Emerson et al., 2006; Dalton et al., 2006). The mid-infrared, m wavelength data is from the Wide-Field Infrared Survey Explorer (WISE; Wright et al., 2010; Cutri et al., 2013) mission. For reference, Figure 1 displays the wavelength and normalised transmission of the filters in question.
2.1 Spectroscopy
We compile the list of all known, spectroscopically confirmed quasars from the literature. This list was complied from a range of surveys and papers. Specifically, we use data from: Bañados et al. (2014, 2016, 2018a, 2018b), Becker et al. (2015), Calura et al. (2014), Carilli et al. (2007, 2010), Carnall et al. (2015), Cool et al. (2006), Douglas et al. (2007), De Rosa et al. (2011), Fan et al. (2000, 2001, 2003, 2004, 2006b, 2018), Goto (2006), Ikeda et al. (2017), Jiang et al. (2008, 2009); Jiang et al. (2015); Jiang et al. (2016), Kashikawa et al. (2015), Khorunzhev et al. (2017), Koptelova et al. (2017), Kozłowski et al. (2019), Kim et al. (2015, 2018), Kurk et al. (2007, 2009), Leipski et al. (2014), Mahabal et al. (2005), Matsuoka et al. (2016, 2018a, 2018b), Mazzucchelli et al. (2017), Morganson et al. (2012), Mortlock et al. (2009, 2011), McGreer et al. (2006); McGreer et al. (2013), Reed et al. (2015, 2017), Saxena et al. (2018), Schneider et al. (2007), Stern et al. (2007), Tang et al. (2017), van Breugel et al. (1999), Venemans et al. (2007, 2012, 2013, 2015b, 2015a, 2016), Wang et al. (2016, 2017, 2018a, 2018b), Willott et al. (2007, 2009, 2010, 2013, 2015), Wu et al. (2015) Yang et al. (2018a, b) and Zeimann et al. (2011).
We updated our list of objects between the submitted paper and accepted due to feedback from other scientists. We discuss these changes in detail in Appendix C.
Most of these objects are easily identified by their broad Ly emission line, N v emission and characteristic shape blueward of 1215Å in the rest-frame. As we shall see, some of the recently discovered objects are close to the galaxy luminosity function characteristic luminosity , and some have relatively weak or maybe even completely absorbed Ly (e.g. Figures 7 and 10 in Bañados et al., 2016). We leave aside detailed investigation and discussion into spectral features and line strengths, and take as given the published spectra and redshift identifications.
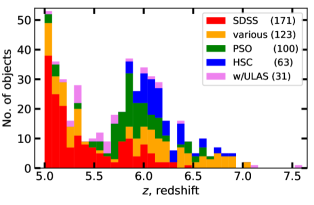
The breakdown of how many VHQ each survey reports is given in Table 1. The Sloan Digital Sky Survey (SDSS) and the Pan-STARRS1 (PS1; PSO in Table 1) survey and alone identified over half (55.5%) of the VHQ population. Data from the Hyper Suprime-Cam (HSC) on the Subaru telescope is responsible for 13.1% of our dataset (HSC+SHELLQs in Table 1). The combination of surveys is also vital for identifying VHQs. The UKIDSS Large Area Survey (ULAS) on its own, or in combination with other surveys is responsible for 6.3% of the sample (SUV+ULAS) including the highest- object. Where more than one survey is used for the high-redshift identification (e.g. via shorter-band veto and longer wavelength detection) we follow the discovery paper naming convention.
| Survey | # VHQs | (%) | Survey reference |
|---|---|---|---|
| ATLAS | 4 | ( 0.82) | Shanks et al. (2015) |
| CFHQS | 20 | ( 4.10) | Willott et al. (2007) |
| DELSa | 16 | ( 3.28) | Dey et al. (2018) |
| ELAIS | 1 | ( 0.20) | Väisänen et al. (2000) |
| FIRST | 1 | ( 0.20) | Becker et al. (1995) |
| HSC | 9 | ( 1.84) | Miyazaki et al. (2018) |
| IMS | 5 | ( 1.02) | Kim et al. (2015) |
| MMT | 12 | ( 2.46) | McGreer et al. (2013) |
| NDWFS | 1 | ( 0.20) | Jannuzi & Dey (1999) |
| PSO | 100 | (20.49) | Kaiser et al. (2002, 2010) |
| RD | 1 | ( 0.20) | Mahabal et al. (2005) |
| SDSS | 171 | (35.04) | Stoughton et al. (2002) |
| SDWISEb | 27 | ( 5.53) | Wang et al. (2016) |
| SHELLQs | 55 | (11.27) | Matsuoka et al. (2016) |
| SUVc | 21 | (4.30) | Yang et al. (2017) |
| TGSS | 1 | (0.20) | Saxena et al. (2018) |
| TN | 1 | (0.20) | ?? van Breugel et al. (1999) |
| UHS | 1 | ( 0.20) | Wang et al. (2017) |
| ULAS | 10 | ( 2.05) | Lawrence et al. (2007) |
| VDESd | 17 | ( 3.48) | Reed et al. (2017) |
| VHS | 1 | ( 0.20) | Wang et al. (2018b) |
| VIK | 10 | ( 2.05) | Edge et al. (2013) |
| VIMOS | 1 | ( 0.20) | Le Fèvre et al. (2003) |
| XMM | 1 | (0.20) | Khorunzhev et al. (2017) |
The redshifts for the VHQs generally come from the measurement of broad UV/optical emission lines. There are far infra-red emission lines e.g. C ii 158 m available for several objects, but at the level of our current analysis broadline redshifts are sufficient.
| Age / Myr | No. of objects | |
|---|---|---|
| 5.00 | 1180 | 488 |
| 5.70 | 1000 | 273 |
| 6.00 | 937 | 174 |
| 6.19 | 900 | 87 |
| 6.50 | 845 | 40 |
| 6.78 | 800 | 14 |
| 7.00 | 767 | 4 |
| 7.50 | 700 | 1 |
The number of objects at or above various redshifts, along with the corresponding age of the Universe is given in Table 2.
The redshift histogram is given for the sample in Figure 2. We split the contribution up by survey. For clarity we show the individual surveys of SDSS, PS1, HSC, the ULAS detection, and tally the remaining surveys together (“various”).
2.2 Near-infrared photometry
The near-infrared data in this paper comes from the Wide Field Astronomy Unit’s (WFAU) Science Archives for UKIRT-WFCAM, the WFCAM Science Archive (WSA; Hambly et al., 2008) and VISTA-VIRCAM, the VISTA Science Archive (VSA; Cross et al., 2012). These archives were developed for the VISTA Data Flow System (VDFS Emerson et al., 2004).
We access both the WSA and the VSA and include all non-proprietary WFCAM data, which covers all public surveys and PI projects from Semester 05A (2005-05-01) to 2017-Jan-01, and all non-proprietary VISTA data, which covers all public surveys and PI projects from science verification on 2009-Oct-15 to 2017-Jan-01.
Here we are not just querying the WSA or VSA data tables. We are taking a list of objects (positions) are performing matched aperture (“forced”) photometry on the NIR imaging data. As such, we generate a set of tables that are different in subtle ways to the regular “Detection” tables. The two most important tables for our needs are the [w/v]serv1000MapRemeasurement and [w/v]serv1000MapRemeasAver.
We produce and provide a two new databases with all the necessary quantities and measurements to fully reproduce our tables, figures and results herein. Moreover, these databases report considerably more information than we report here. Full documentation can be found at the WSA Schema Browser and the VSA Schema Browser.
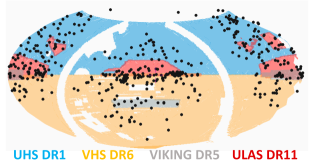
Figure 3 shows the areal coverage of the ULAS, UHS, VHS and VIKING. UHS DR1 is 12,600 deg2 (-band); ULAS DR1 3,700 deg2 VHS DR6 16,000 deg2 and VIKING DR5 is 1,300 deg2. The overlap between UHS DR1 and VHS DR6 is 28 deg. These four surveys together cover 33,000 deg2. VHS, ULAS and UHS do not observe in the -band.
2.2.1 Averaging matched photometry
The data was processed using a matched-aperture photometry method where flux is measured at the spectroscopic position of the quasar, without necessarily knowing if there is a formal detection in the NIR photometry beforehand. The matched-aperture pipeline is discussed in Cross et al. (2013) and with fuller details to appear in a forthcoming paper (Cross et al., 2020, in prep).
We query the WSA and VSA performing matched-aperture photometry at the positions of our 488 VHQs. This database is world-readable and we give the full recipe and relevant SQL queries for accessing both databases in Appendix A as well as online.
The photometry in a single epoch image often has a low signal-to-noise ratio. The advantage of matched aperture photometry on quasars is that co-adding is relatively simple if each epoch is taken in the same aperture and the aperture photometry has been corrected to total. Indeed, the standard aperture corrections work well for point sources. Coadding using the matched-aperture photometry can give better results for the photometry, where the individual epochs are taken from multiple projects with different field-centres and orientations and point-spread functions since the individual epoch scattered light, pixel distortion and aperture corrections can be applied with the correct weighting.
We average the aperture corrected calibrated fluxes (e.g. aperJky3), and then convert to magnitudes.
| (1) |
where is the epoch measurement of a parameter to be averaged such as the aperture corrected calibrated flux in a aperture (aperJky3) and is the weighted mean average of this parameter. The weight for each epoch if the epoch is included and if an epoch is excluded for quality control purposes. The weights of each epoch in each averaged catalogue are tabulated in the [w]̌serv1000MapAverageWeights.
We calculate a set of averaged catalogues, for each pointing and filter, based
on the requirements in RequiredMapAverages, in these cases over time
spans of 7, 14, 30, 91, 183 days, 365 days, 730 days, over 10 epochs and
over all epochs. The averaging process starts at the first epoch and works onwards
from there. Again, we present these measurements in the new SQL tables.
We detect 367 unique quasars in the WFCAM WSA database, 237 quasars are detected in the VISTA VSA database with 131 objects in common with both WFCAM and VISTA data. We give the necessary SQL queries syntax at d80b2t/VHzQ.
2.3 MIR data
The MIR data for this study comes from the Wide-field Infrared Survey Explorer (WISE) mission, and we utlize data from the WISE cryogenic and the Near-Earth Object WISE (NEOWISE; Mainzer et al., 2011) post-cryogenic and NEOWISE Reactivation Mission (NEOWISE-R Mainzer et al., 2014) survey phases.
We use data from the beginning of the WISE mission (2010 January; Wright et al., 2010) through the fifth-year of NEOWISE-R operations (Mainzer et al., 2011, 2018 December;). There are several major data releases and catalogues based on the WISE mission. Here we use two: the WISE AllWISE Data release and the recently released ‘‘unWISE Catalog’’ (Schlafly et al., 2019). The AllWISE program combines the W1 and W2 Single-exposure data from all the WISE survey phases (4-Band Cryo, 3-Band Cryo and Post-Cryo; 2010-01-07 thru 2011-02-01) survey phases, and the W3 and W4 from the 4-Band Cryo phase. The unWISE effort999http://unwise.me is the unblurred coadds of the WISE imaging using the AllWISE and NEOWISE-R stacked data (Lang, 2014; Meisner et al., 2018a, b).
For the two shorter WISE bands, 3.37m W1 and 4.62m W2 we generally report the deeper, unblurred unWISE coadd data. For the two longer WISE bands, 12.1m and 22.8m we use the AllWISE Data Release. Most objects in the AllWISE Source Catalog are unresolved, so the best photometric measurements to use are the deep detection profile-fit photometry measures, wmpro, wsigmpro and wsnr. The unWISE Catalog absolute photometric calibration derives from the photometric calibration of the unWISE coadds (Meisner et al., 2017), which is tied to the original WISE zero points through aperture fluxes in a 27.5’’ radius.
Previous works (e.g., Krawczyk et al., 2013; Ross et al., 2015; Bilicki et al., 2016) found that cross-matches performed with a radius of 2-3’’ between the user catalogue and WISE was a good compromise between completeness and contamination (see e.g. Figure 4 of Krawczyk et al., 2013). We thus use a cross-match radius of 2.75’’. When querying the AllWISE catalogues, ‘‘Cone Search Radius’’ in the AllWISE table search was set to 2.75’’ for the Spatial Constraints. The ‘‘One to One Match’’ was ‘‘not’’ checked; although possible, we consider it highly unlikely there would be more than one MIR source contributing to the flux of a single UV/optically bright rest-frame quasar. As a check, we utilize data from the Spitzer Space Telescope in IRAC Channel 2 4.5m, IRAC Channel4 8m and MIPS 24m, and number counts and luminosity density measurements from Driver et al. (2016, see their Figures 8.11, 8.12 and 8.13). The redshift distribution of the sampled 8--24 m foreground objects is narrow enough and their -corrections advantageous enough, that the objects counts sharply turnover for mag, and the normalized differential counts --- especially in e.g. WISE W4 --- have most of their extragalactic background light energy emerging at AB18--20 mag. As a consequence, the relative number or probability of contaminating objects at ABmag inside our apertures should be small.
Knowing we have secure detections in the near-infrared bands, and wanting to boost the number of WISE W3/W4 detections, we allow ourselves to be less conservative in querying the AllWISE catalogues and also query the AllWISE Reject Table. However, with the exception of one object (SHELLQs J1208-0200), the AllWISE Reject Table does not contain any further W3/W4 detection information.
All fluxes in the unWISE catalog are reported there are in ‘‘Vega nanoMaggies’’, with the Vega magnitude of a source is given by
| (2) |
where is the source flux. The absolute calibration for unWISE is ultimately inherited from AllWISE through the calibration of Meisner et al. (2017). This inheritance depends on details of the PSF normalization at large radii, which is uncertain. Subtracting 4 millimag from the unWISE W1, and 32 millimag from unWISE W2 fluxes improves the agreement between unWISE and AllWISE fluxes.
Thus to convert unWISE Vega magnitudes onto the AB system, we have:
using the Tokunaga & Vacca (2005) AB system, and is slightly different to the transformations presented in Schlafly et al. (2019).
For the our MIR variability investigations, we use the NEOWISE-R 2019 Data Release. NEOWISE 2019 makes available the 3.4 and 4.6 μm (W1 and W2) single-exposure images and extracted source information that was acquired up until 2018 December 13 (MJD 58465) including the fifth year of survey operations of NEOWISE. These fifth year NEOWISE data products are concatenated with those from the first four years into a single archive from 2013 December 13 (MJD 56639). The WISE scan pattern leads to coverage of the full-sky approximately once every six months (a‘‘sky pass’’), but the satellite was placed in hibernation in 2011 February and then reactivated in 2013 October. Hence, our light curves have a cadence of 6 months with a 32 month sampling gap.
| Survey | QsoName | R.A. / deg | Decl. / deg | redshift | Y | J | H | K | unWISE | AllWISE | ||
|---|---|---|---|---|---|---|---|---|---|---|---|---|
| (J2000) | (J2000) | W1 | W2 | W3 | W4 | |||||||
| PSO | J000.3401+26.8358 | 0.34011 | 26.83588 | 5.75 | --- | --- | --- | |||||
| SDSS | J0002+2550 | 0.66412 | 25.84304 | 5.82 | --- | --- | --- | |||||
| SDSS | J0005-0006 | 1.46808 | --0.1155 | 5.85 | ||||||||
| PSO | J002.1073-06.4345 | 2.10739 | --6.43456 | 5.93 | --- | --- | ||||||
| SDWISE | J0008+3616 | 2.21429 | 36.27041 | 5.17 | --- | --- | --- | |||||
| PSO | J002.3786+32.8702 | 2.3787 | 32.87026 | 6.1 | --- | --- | --- | --- | --- | --- | ||
| SDSS | J0012+3632 | 3.137 | 36.53781 | 5.44 | --- | --- | --- | |||||
| SDSS | J0017-1000 | 4.31117 | --10.0154 | 5.01 | --- | |||||||
| PSO | J004.3936+17.0862 | 4.39361 | 17.0863 | 5.8 | --- | --- | --- | --- | ||||
| PSO | J004.8140-24.2991 | 4.81408 | --24.29916 | 5.68 | --- | |||||||
| VDES | J0020-3653 | 5.13112 | --36.89495 | 6.9 | --- | --- | ||||||
| SDSS | J0023-0018 | 5.87779 | --0.31011 | 5.06 | ||||||||
| PSO | J006.1240+39.2219 | 6.12404 | 39.22193 | 6.62 | --- | --- | --- | --- | --- | --- | ||
| SDWISE | J0025-0145 | 6.36183 | --1.75903 | 5.07 | ||||||||
| PSO | J007.0273+04.9571 | 7.02733 | 4.95712 | 6.0 | ||||||||
| SDWISE | J0031+0710 | 7.85775 | 7.17692 | 5.33 | ||||||||
| CFHQS | J0033-0125 | 8.2975 | --1.42358 | 6.13 | --- | --- | --- | --- | ||||
| SDSS | J0034+3759 | 8.55979 | 37.99833 | 5.63 | --- | --- | --- | |||||
| PSO | J009.3573-08.1190 | 9.35733 | --8.11902 | 5.72 | --- | |||||||
| DELS | J0038-1527 | 9.65042 | --15.45656 | 7.02 | --- | --- | --- | --- | ||||
| PSO | J009.7355-10.4316 | 9.73551 | --10.43164 | 6.0 | --- | --- | --- | --- | ||||
| PSO | J011.3899+09.0325 | 11.38987 | 9.03249 | 6.42 | --- | --- | ||||||
| PSO | J0046-2837 | 11.59854 | --28.62982 | 5.99 | ||||||||
| CFHQS | J0050+3445 | 12.52777 | 34.75601 | 6.25 | --- | --- | --- | |||||
3 Results
Having collated the sample of 488 VHQs, and obtained their near- and mid-infrared photometry we report here the various photometric properties of the quasars. Table 3 represents the culmination of this effort, is the main data product of this paper and we now exam the assembly of its contents in more detail.
First, we will concentrate on detection rate in the infrared, go on to report on the colour-redshift and colour-colour properties of our sample. We also investigate the photometric variability.
3.1 Detection Rates in the NIR
Table 4 gives the detection rates for the VHQs in the NIR -bands. The first thing to note is that the coverage of the NIR surveys for example from the UKIDSS LAS and VISTA VHS, does not overlap the full area for where the VHQs are detected.
| Selection | number detected (%) |
|---|---|
| Any band () | 473 (96.9) |
| -band | 81 (16.6) |
| -band | 289 (59.2) |
| -band | 471 (96.5) |
| -band | 277 (56.8) |
| or -band | 343 (70.3) |
There are 15 objects that have no NIR detections. 3 of these (PSOJ053.9605-15.7956, PSO J056.7168-16.4769 and DELSJ0411-0907) have been observed (by VHS) but are out of our queried time range (for which the data is publicly available). 6 objects are at declination deg and have not been observed (or at least the data is not in the VSA archive yet). 6 objects are at a declination deg are too far north for UKIRT and cannot be observed.
We note that although we are often working close to the magnitude limits of the surveys, Eddington bias does not a significant effect on our measurements, since we are not discovering new sources, but measuring properties of already known quasars. Indeed in the NIR WFCAM/VISTA data, using forced photometry reduces the Eddington bias to negligible levels since a flux will be measured regardless of whether the source is just bright enough (or too faint) to be detected above the background noise.
3.1.1 Comparing WFCAM and VISTA
There are 131 quasars observed in the overlapping area between WFCAM and VISTA. We used the VegaToAB values to put these objects on the same AB system, and for each object compared the two measurements. First, we calculated the weighted average (calibrated flux) in each filter of both and calculated the ratio and difference between each measurement and the average. Then for each filter we calculated the weighted average of the differences (in mag) for each instrument to see if there were significant offsets. The results are given in Table 5. The only filter with a significant offset is the -band. All of the VISTA averages are negative and all of the WFCAM ones are positive, except for J where the difference is negligable. The versus band comparison may be affected the different shapes of the filters, with being significantly wider than , able to detect light at longer wavelengths.
| abs(VIRCAM | millimags | no. of |
|---|---|---|
| - WFCAM) | objects | |
| 13.1 | 3 | |
| 59.3 | 63 | |
| 0.9 | 125 | |
| 14.9 | 108 | |
| / | 1.1 | 114 |
We have also checked for quasars with large differences in magnitude between the WSA and VSA. Objects were selected where the average flux was and average flux error. In order to account for large errors in either the WFCAM or VISTA photometry, objects with mag in either WSA or VSA were removed. This selects one quasar with large, mag mag differences between the WSA and VSA. This is SDSSJ0349+0034 which has a WSA -band magnitude of 21.030.35 mag AB (observed at MJD=54062.4), while for the VSA -band this is 20.200.14 mag AB (observed 3 times between MJD=55537 and 55542), meaning that the WFCAM and VISTA observations are years apart.
| unWISE | AllWISE | |||
|---|---|---|---|---|
| W1 | W2 | W3 | W4 | |
| 5.00 | 389 ( 79.7%) | 334 ( 68.4%) | 59 ( 12.1%) | 10 ( 2.0%) |
| 5.70 | 194 ( 71.1%) | 157 ( 57.5%) | 16 ( 5.9%) | 6 ( 2.2%) |
| 6.00 | 115 ( 66.1%) | 96 ( 55.2%) | 9 ( 5.2%) | 2 ( 1.1%) |
| 6.19 | 65 ( 74.7%) | 48 ( 55.2%) | 3 ( 3.4%) | 2 ( 2.3%) |
| 6.50 | 35 ( 87.5%) | 26 ( 65.0%) | 1 ( 2.5%) | 2 ( 5.0%) |
| 6.78 | 12 ( 85.7%) | 9 ( 64.3%) | 0 ( 0.0%) | 0 ( 0.0%) |
| 7.00 | 4 (100.0%) | 4 (100.0%) | 0 ( 0.0%) | 0 ( 0.0%) |
| 7.50 | 1 (100.0%) | 1 (100.0%) | 0 ( 0.0%) | 0 ( 0.0%) |
3.2 Detection Rates in the MIR
Unlike the NIR coverage, the WISE satellite and mission performed an all-sky survey, so the location of every VHQ in our dataset is covered. However, the depth of the WISE survey depends heavily on sky location, with locations near the Ecliptic Poles having the highest number of exposures.
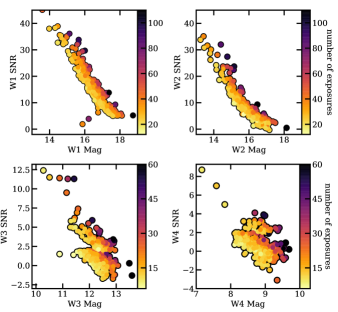
Before reporting on the detection rates, we investigate this effect using the AllWISE Source Catalog. Figure 4 shows the WISE AllWISE magnitude versus signal-to-noise ratio, colour coded by wcov the mean coverage depth, in each corresponding band. The wcov values are the mean pixel coverage in W1/2/3 from the W1/2/3 Atlas Tile Coverage Map within an aperture of circular area with a radius of 8.25’’ centered on the position of this source. For wcov this radius is 16.5’’ (the AllWISE Source Catalog Column Descriptions has further details). The wcov value takes into account e.g., individual pixels in the measurement area that may be masked or otherwise unusable (reducing the effective pixel count and thus the mean coverage value) as well as pixels that are affected by distortions across the across the focal plane in single-exposure images (where this distortion is corrected when coadding to generate the Atlas Images).
In the two shorter bands W1/2 we see the clear and expected trend for brighter objects to have larger SNR, and also for the higher signal-to-noise ratio for objects with more exposures at a given magnitude. The behaviour for the W3/4 bands is different, with two populations clearly evident in W3 and although a bit more mixed, also in W4. With the suggested split at SNR, and no obvious R.A./Declination dependence seen, this behaviour is explained by the fact that there are non-detections in W3/4 for objects (with high W1/2 SNR) that are reported in the AllWISE catalogue.
Table 6 gives the detection rates for the VHQs in the MIR WISE W1-4 bands. The unWISE depths are impressive with nearly 80% of all the VHQs being detected in unWISE W1. 12 out of 14 (86%) in unWISE W1 (9 our of 14; 64% in unWISE W2) of the quasars are detected and moreover all of the quasars are detected in both unWISE W1 and W2. This bodes very well for future, small mirror infrared missions (e.g. Ross et al., 2019).
Secrest et al. (2015) present an all-sky sample of 1.35 million AGN meeting a two-color, (W1-W2) vs. (W2-W3), photometric selection as applied to sources from AllWISE. This colour-selection is motivated by Mateos et al. (2012). We investigate if this catalogue, which is tuned for, and noted to be highly complete at, lower, redshifts, contain the VHQs. We find only 5 VHQs from our sample match the Secrest catalogue, but given a W3 detection is required, this is not surprising. Further, in addition to the relative lack of sensitivity in W3, the mid-IR colors are moving out of the Mateos et al. (2012) color criterion at high redshift. This was shown using an AGN SED where AGNs above a redshift of about 2 fall out of the colour criterion, see e.g. Figure 5 of Mateos et al. (2012) and Figure 9 of Secrest et al. (2015). Assef et al. (2018) released two large catalogues of AGN candidates identified across 30,000 deg2 of extragalactic sky from the WISE AllWISE Data Release. The ‘‘R90’’ catalogue, contains 4.5M AGN candidates at 90% reliability (150 AGN candidates per deg2) while the ‘‘C75’’ catalogue consists of 20.9M AGN candidates at 75% completeness (700 AGN candidates per deg2). Crossmatching our catalogue of 488 VHQs with these catalogues, produces 49 matches with the R90 sample and 129 matches with the C75 sample. Both catalogues unsurprisingly match to the ultraluminous quasar SDSS J0100+2802 (Wu et al., 2015) while the C75, but not the R90 catalogue matches to the first redshift quasar ULAS J1120+0641 (Mortlock et al., 2011). Neither the R90 or C75 catalogue matches to the current highest-redshift object J1342+0928 (Bañados et al., 2018a).
3.3 MIR Colours
Due to the depth all-sky coverage of the WISE (and NEOWISE-(R)) mission, several investigations have looked at how WISE detects AGN (e.g Stern et al., 2012; Assef et al., 2012; Secrest et al., 2015; LaMassa et al., 2017; Assef et al., 2018; Glikman, 2018; Hviding et al., 2018; LaMassa et al., 2019)
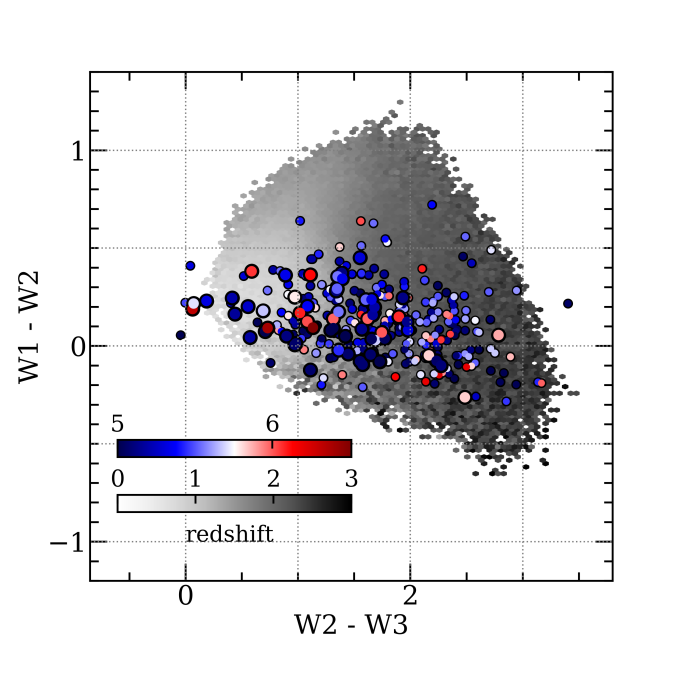
Figure 5 shows the (W1-W2) vs. (W2-W3) colour-colour diagram for the 330 VHQs that have reported w3mpro values (blue to red coloured points), though we note that only 51 (18%) of these objects have w3snr 3.0. Approximately 400,000 quasars at redshift from the SDSS Quasar Catalog using the Fourteenth data release (DR14Q; Pâris et al., 2018) are also shown (grey colour-scale).
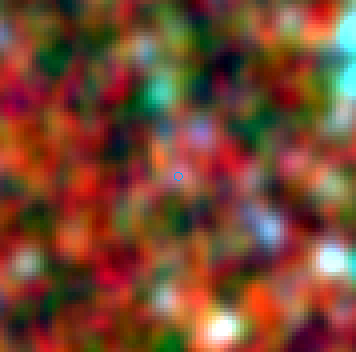
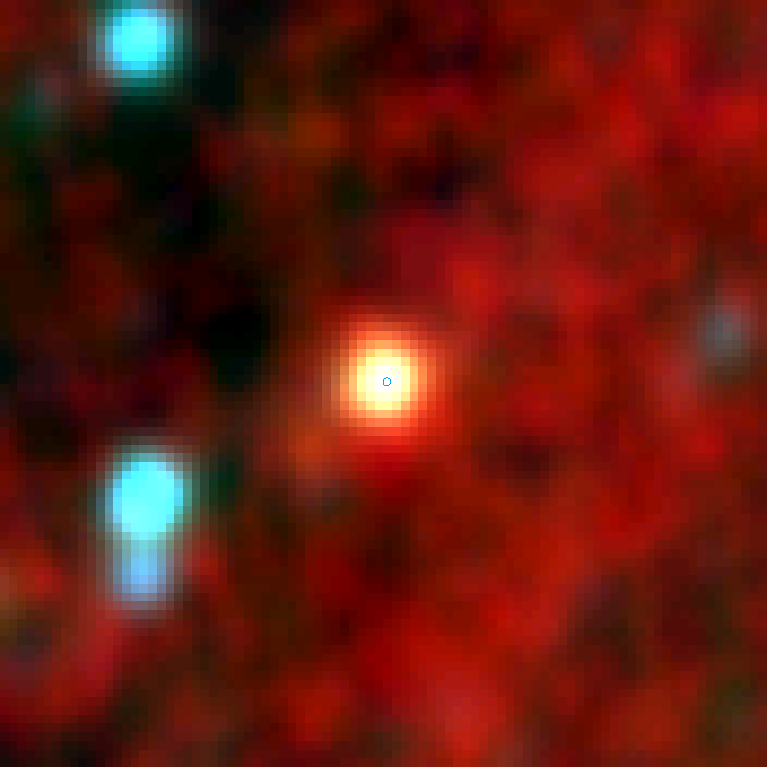
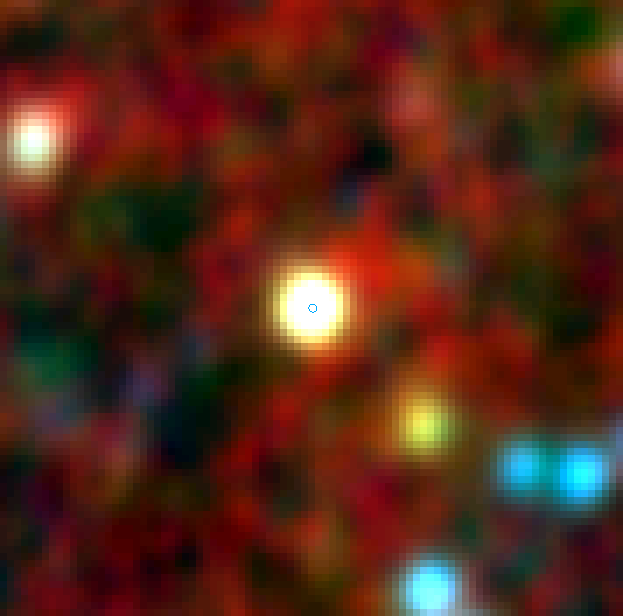
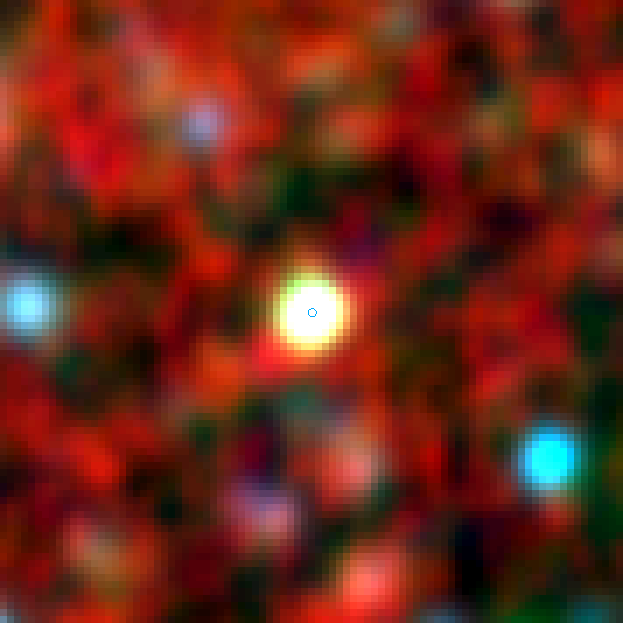
The VHQ with the bluest colour in (W1-W2) is SDSS J0927+2001, with (W1-W2) = --0.283 (i.e. 0.328 in Vega), and the WISE W1W2W3 color image is shown in Fig. 6 (a). The reddest object in (W1-W2) is PSO J135.3860+16.2518 with (W1-W2) = 0.721 (1.33 Vega).
The set of VHQ detected in WISE W3 and W4 contains 59 objects that are detected in the broad W3 filter and 10 objects that are formally detected in W4 (w4snr3.0). Three of the W3/4 objects are presented in Figure 6. UHS J0439+1634 (Fig. 6 (b)) with W4=7.1650.12 was discovered by Fan et al. (2019b) and is a strongly lensed quasar at 6.51. This high luminosity is mostly not intrinsic, but is boosted by an intervening redshift 0.7 galaxy. Other high-redshift quasars that are bright W3/4 objects e.g. SDWISE J0306+1853 (Fig. 6 (c)) may well also so be lensed (e.g., Glikman et al., 2018; Fan et al., 2019b; Pacucci & Loeb, 2019), but high-resolution follow-up is needed to confirm. SDSS J0100+2802 (redshift ; Fig. 6 (d)) does not have a formal W4 detection (w4snr=2.4), but as reported by Wu et al. (2015), has a detection in the 2MASS , and bands and is also the bluest object in both (W1-W3) and (W2-W3).
3.4 Variability
VHQs, if accreting at, or above the Eddington limit, might well have changing mass accretion rates, i.e., . A consequence of this would be that these quasars exhibit signs of variability, most likely showing up in their UV/optical rest-frame emission. We look for evidence of this variability signature in the NIR and MIR light-curves of the VHQs.
Quasars are known to have dramatically changing Balmer lines, especially H (e.g., LaMassa et al., 2015; Ruan et al., 2016; Runnoe et al., 2016; MacLeod et al., 2016; Gezari et al., 2017; Runco et al., 2016; Yang et al., 2018c; Assef et al., 2018; Stern et al., 2018; Ross et al., 2018; MacLeod et al., 2019; Graham et al., 2019). As a guide, we note that H is redshifted to 3.94m (i.e. W1) at and 5.57m, which is between the W2 and W3-bands at . H is redshifted to 2.92m, which is the blue edge of W1, at and 4.13m at . Less well understood is the temporal behaviour of the metal lines, in particular C iv and Mg ii . C iv enters the -band at redshift =5.32 and exits at =5.99, and enters the -band at redshift and exits at =7.57. Mg ii enters the -band at redshift and exits at and enters the -band at redshift and exits at .
One key point to note is that the NEOWISE-AllWISE match radius is 3.00’’ and the AllWISE (and 2MASS) source information included in the NEOWISE Source Database are associations not identifications.
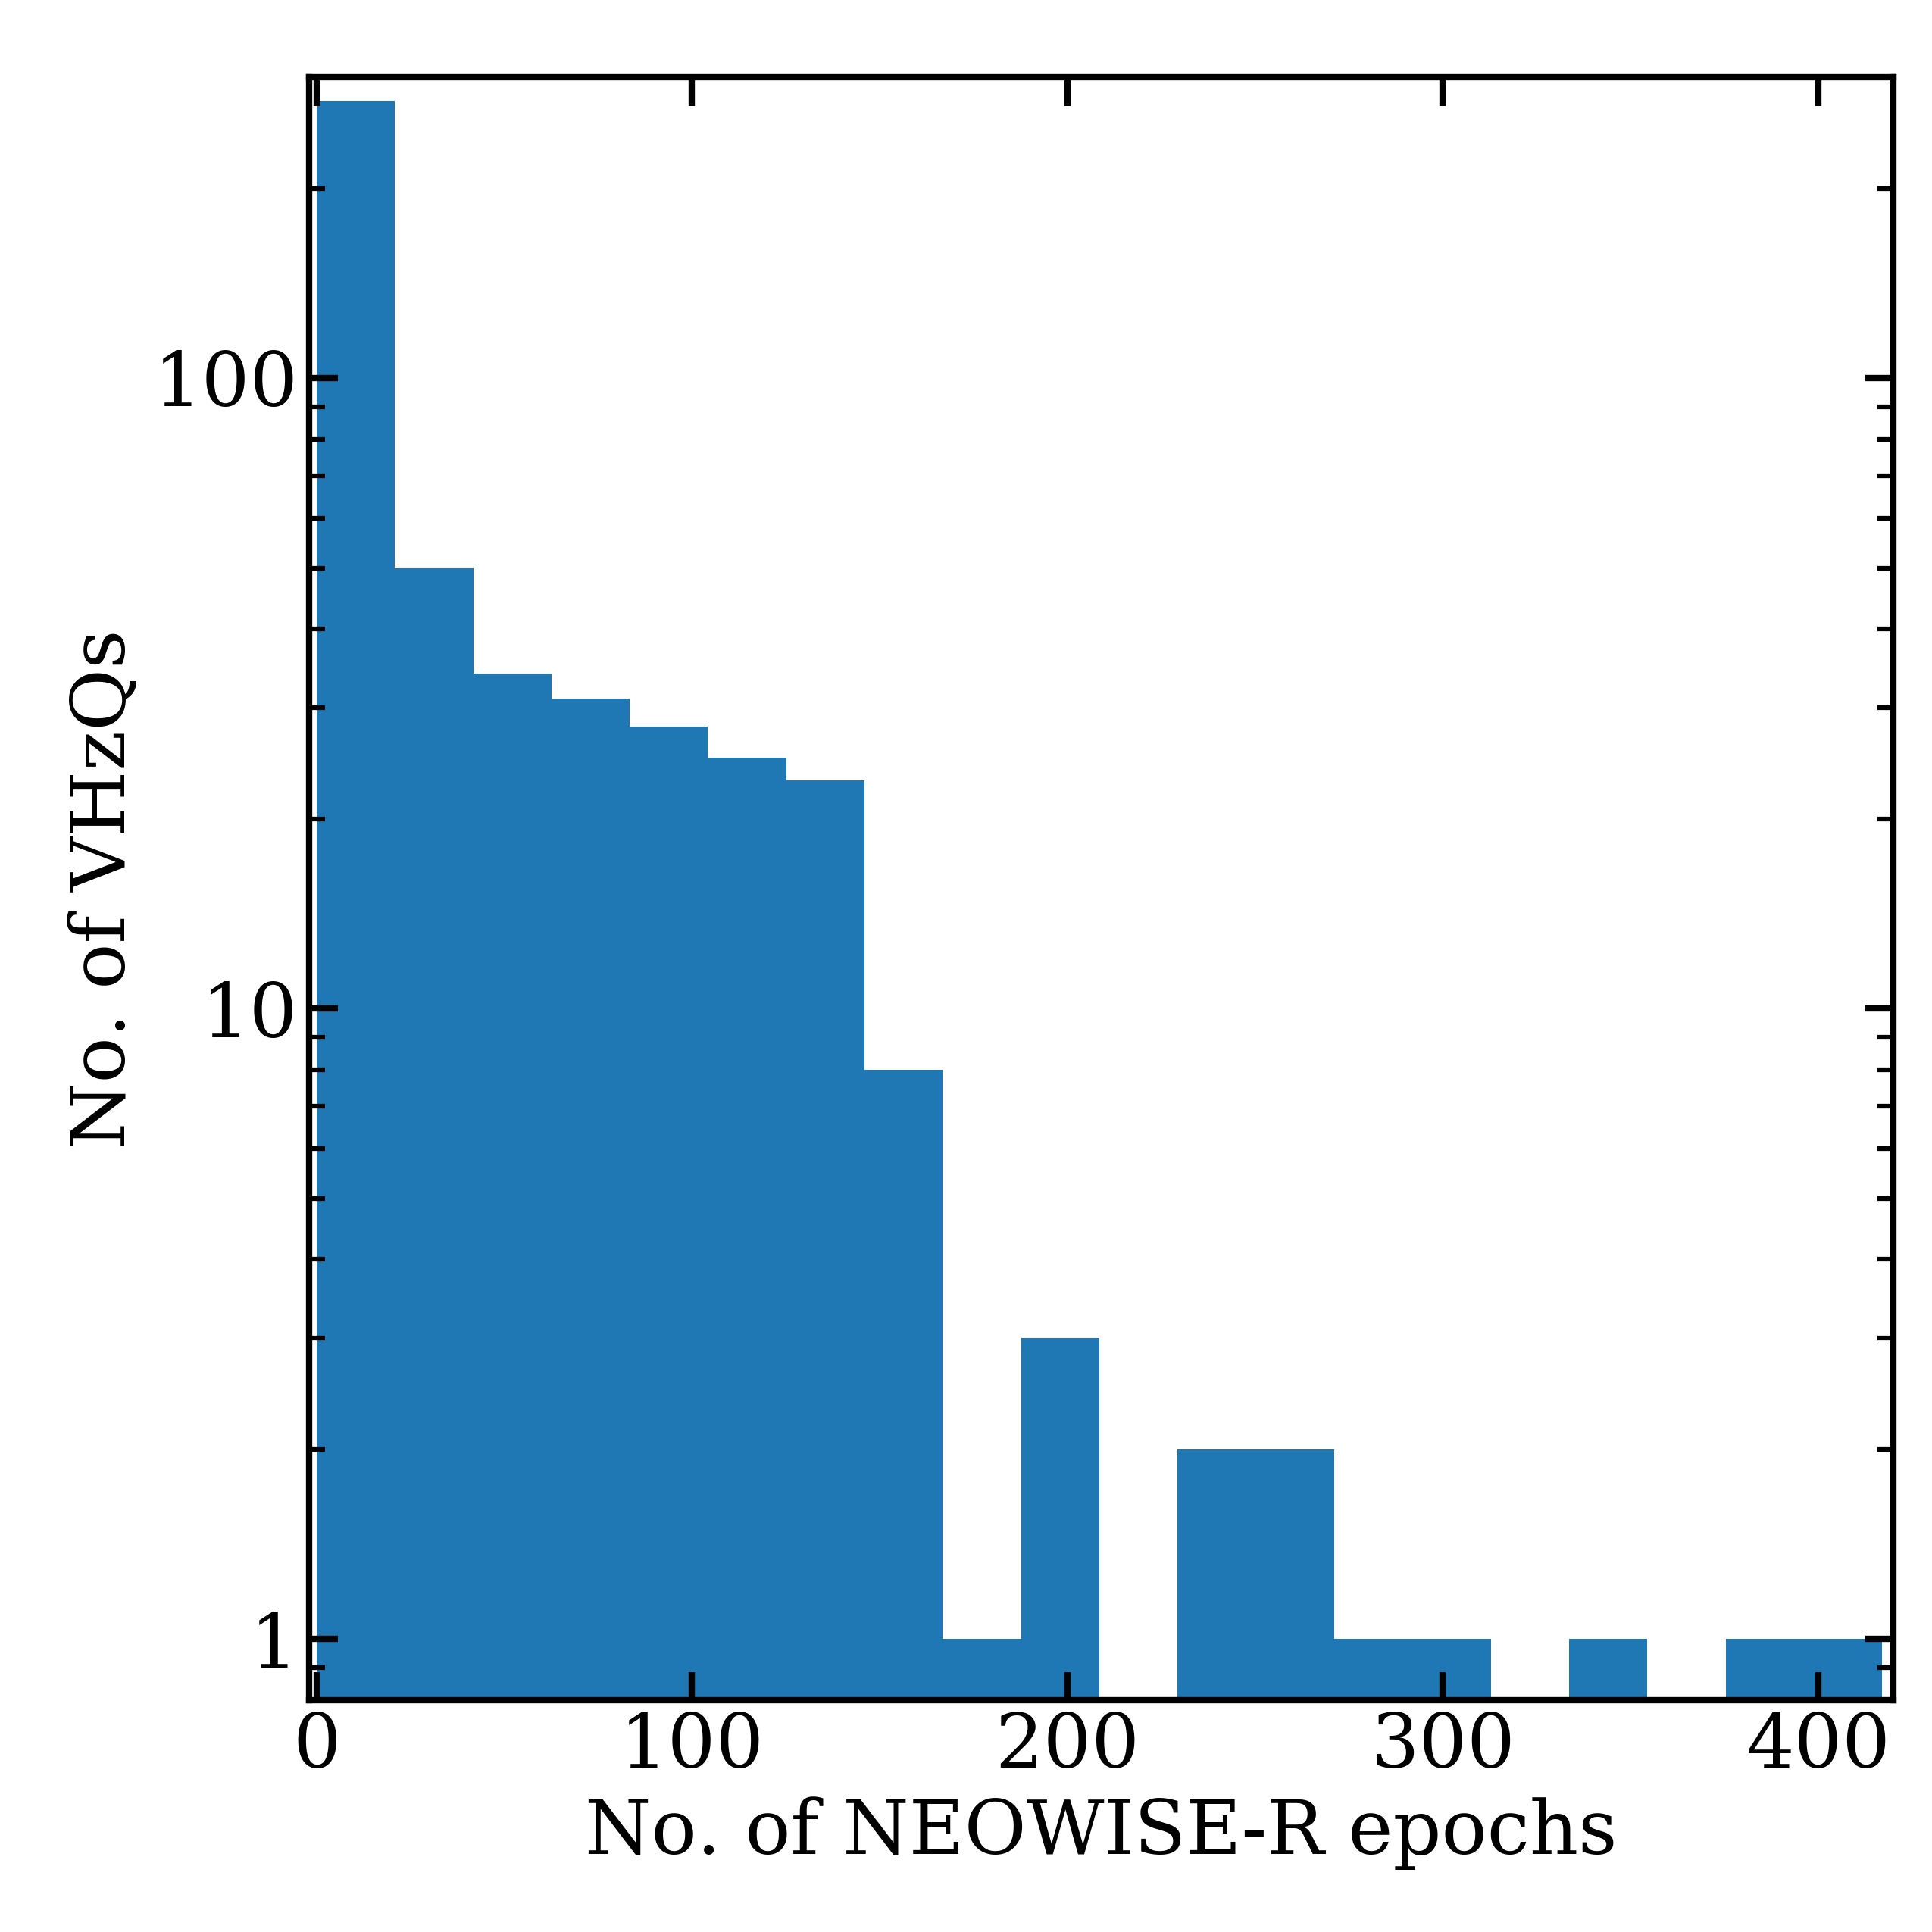
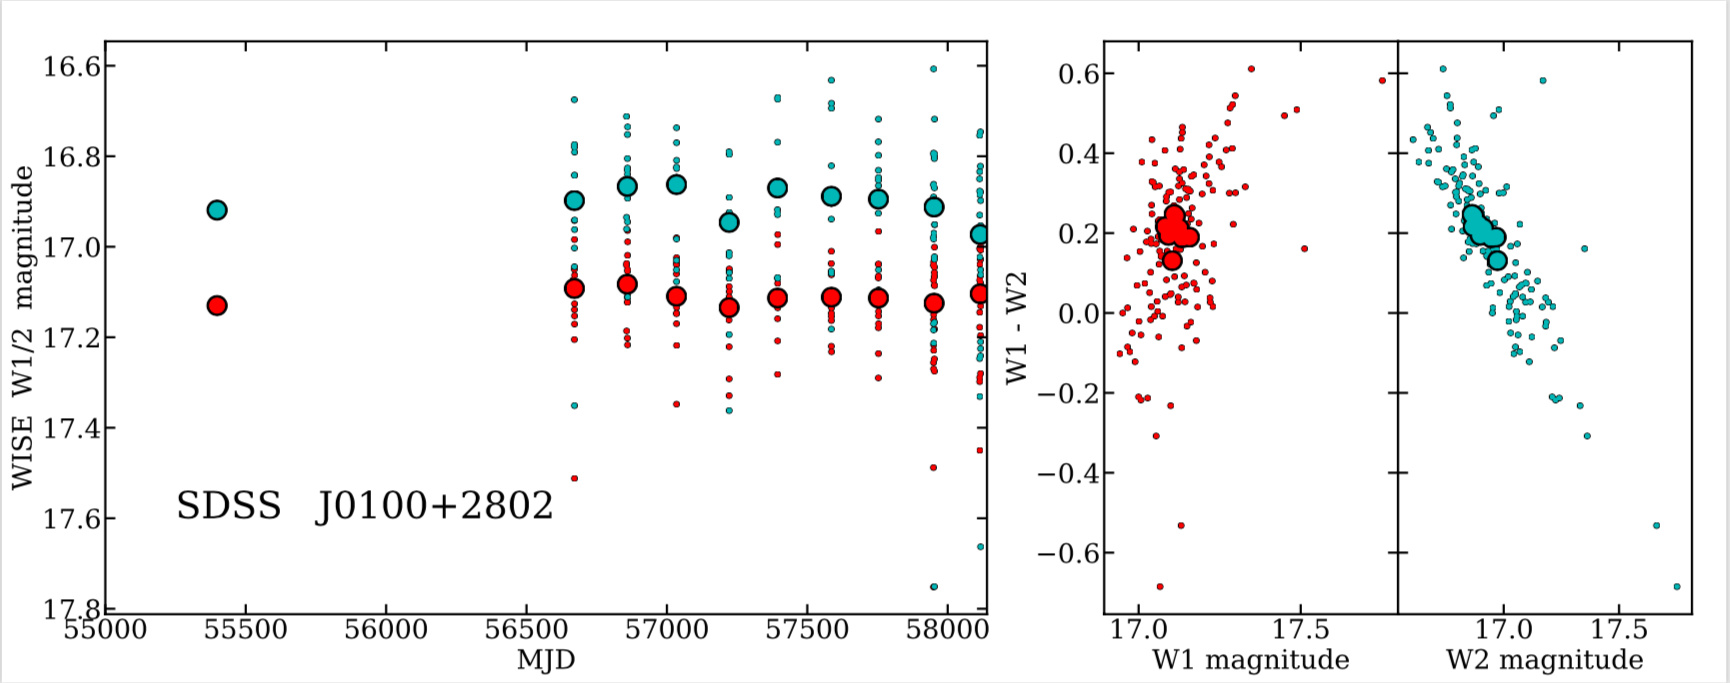
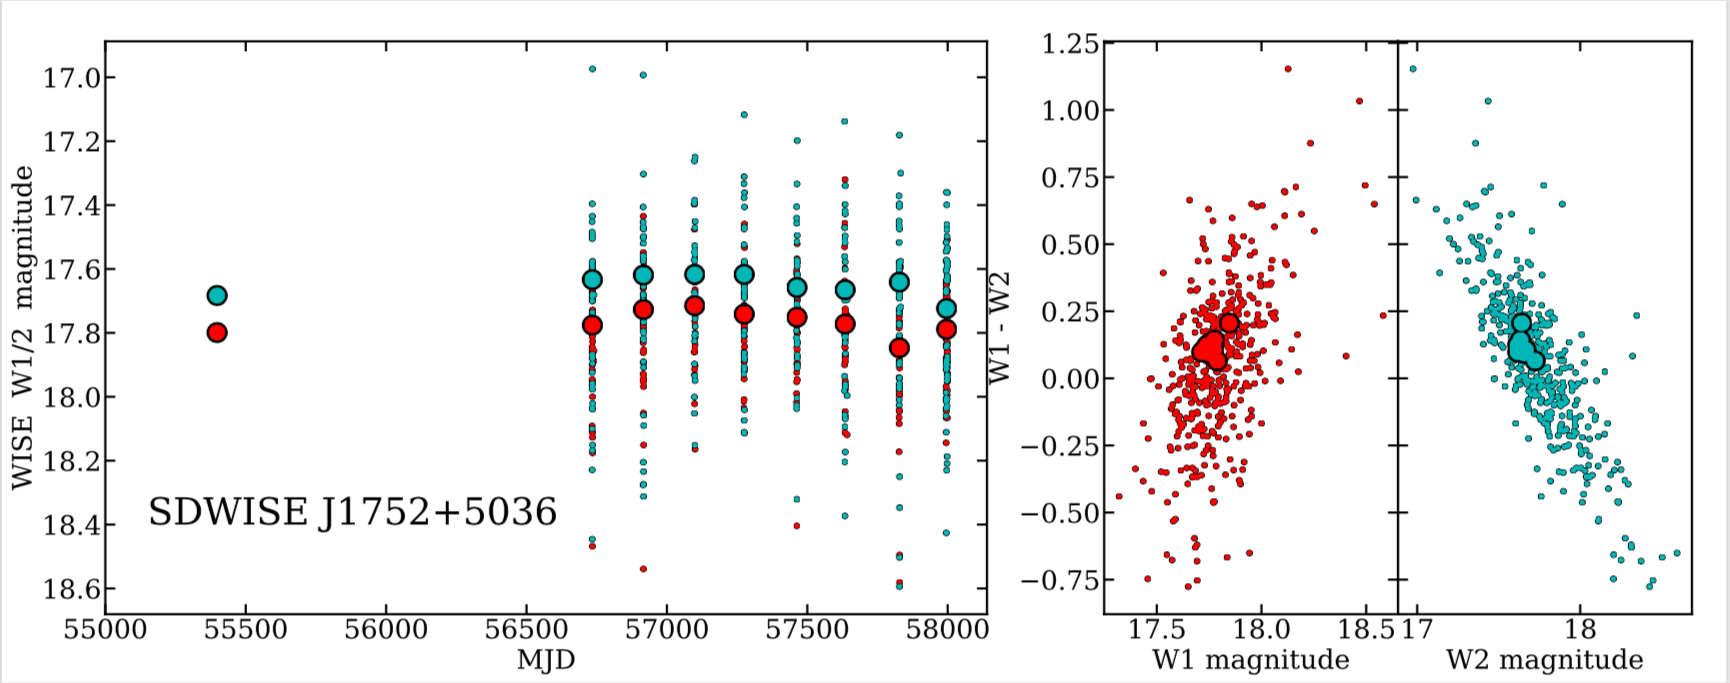
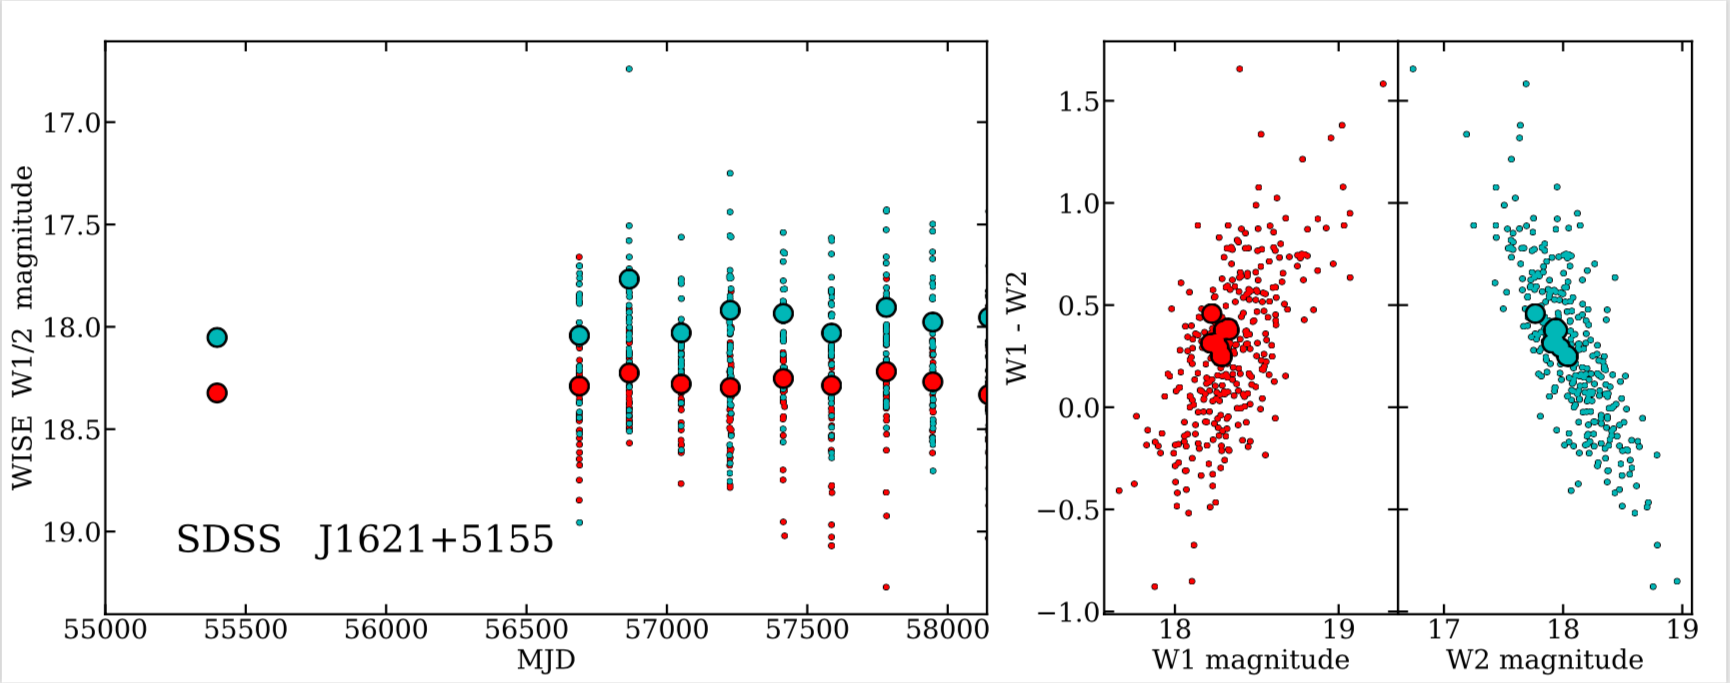
Figure 7 gives the number of NEOWISE-R epochs and detections for each VHQ. There are 74 quasars with over 100 NEOWISE-R epochs, nine with over 200 epochs and four with over 300. Figure 8 presents three examples of the brighter MIR objects with well-sampled MIR lightcurves and associated colour changes; SDSS J0100+2802 (Fig. 8 top), SDWISE J1752+5036 (middle), SDSS J1621+5155 (bottom). For the light curves, we show weighted means for every 6 month NEOWISE-R scan. Due to the WISE scanning pattern, objects close to the North Ecliptic Pole are well sampled, and indeed this is the area for further investigation time-domain investigation with upcoming large infrared space telescopes (Jansen & Windhorst, 2018; White et al., 2019).
Using the extended datasets described in Section 2.2, we select objects with at least 8 measurements observed with intervals of at least 30 days, in at least one filter. The the average calibrated flux over all epochs must be (i.e. aperJky3) with the signal-to-noise ratio is required to be (i.e. aperJky3/aperJky3Err8). With these criteria, there are 18 WFCAM and 12 VISTA objects with 2 objects (SDSSJ0221-0342B VIK J1148+0056) in common to both, and this sample of 28 is our starting point for variability investigations.
The clipped median and median absolute deviation is then calculated
| (3) |
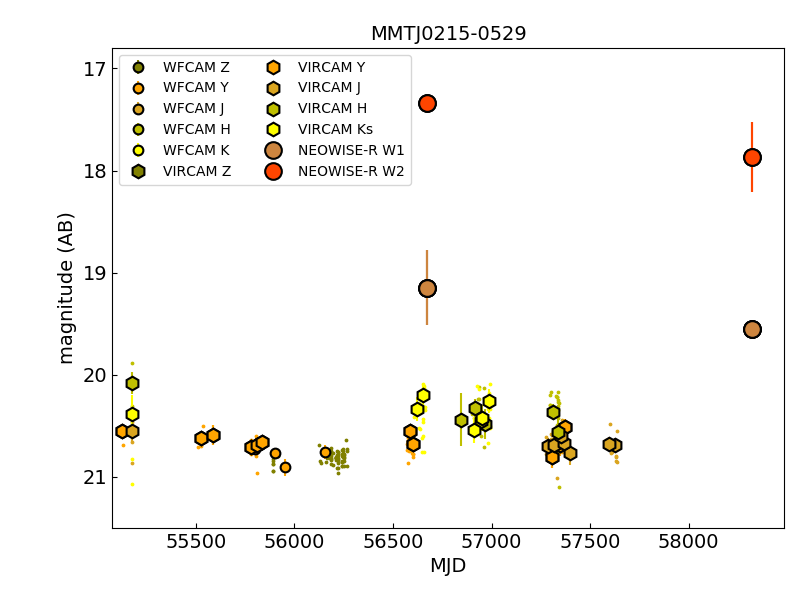
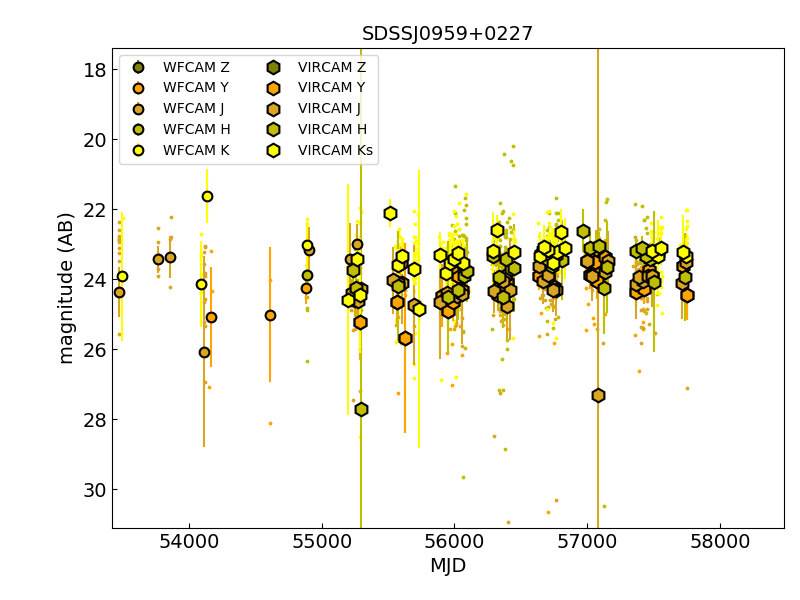
where is the index of variation, m.a.d. is the median absolute deviation, and is the mean of the error in each point in the light curve, divided by the total number of points. We apply the criteria to light-curves from the original measurements and also to light-curves where measurements have been averaged over different time-scales to improve the signal-to-noise ratio. We found that two quasars showed signs of variability: MMT J0215-0529 (see Fig. 10) in the -band with an average time-scale of 30 days and amplitude of 0.3 mag, and SDSS J0959+0227 (see Fig. 12) in the and -bands, with timescales of 1 year or 6 months for only. The -band amplitude was 0.7 mag and the -band amplitude was 1.2 mag if averaged over 6 months, or 0.9 mag if averaged over 1 year.
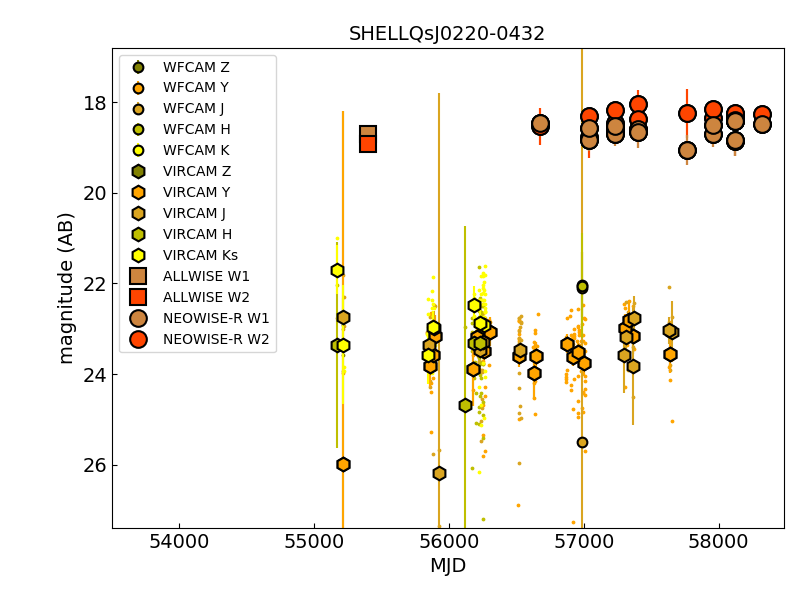
We present four objects that are particularly well-sampled in the NIR. These are: MMT J0215-0529 (; Figure 10), CFHQS J0216-0455 (; Figure 10), SHELLQs J0220-0432 (; Figure 12) and SDSS J0959+0227 (; Figure 12). We incorporate the MIR NEOWISE-R light curve data where available.
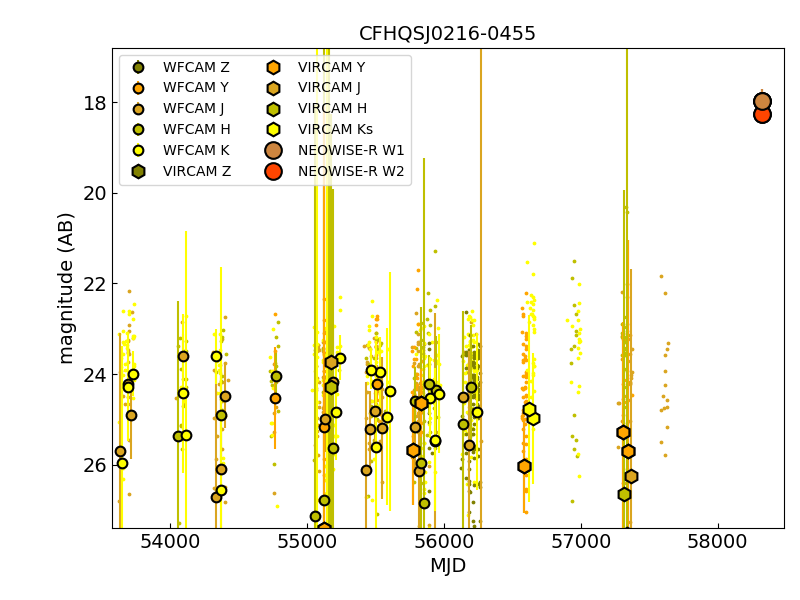
We note that sometimes the average flux is negative and so a default magnitude is reported. This is apparent for the average and flux for CFHQS J0216-0455 at MJD=56900. Interestingly this is evident in both the and filters, but with this quasar not much brighter than the detection limit, one must be very careful with any (over) interpretation.
Even with well sampled data across the 3000-4000 day observed time-scales that the WFCAM and VISTA surveys span, the time-dilation dramatically affects the sampled rest-frame timescales sampled, which are 300-700 days. Indeed, when sharp changes in a accretion rate are expected on the system’s dynamical timescale of several kiloyears (e.g., Regan et al., 2019), then seeing any variability signature is not expected. However, noting that (i) accretion onto supermassive black holes should be generally time invariant, and (ii) that in lower redshift quasars, which also have massive M⊙ black holes, dramatic changes in both continuum and line emission is seen on much shorter timescales, continued monitoring of these objects is definitely warranted.
We finally focus on SDSS J0959+0227 which is presented in Wang et al. (2016) but is first reported in Civano et al. (2011) as CID-2220 and a high-redshift, AGN, in the Chandra-COSMOS field. The spectrum from this object is presented in Ikeda et al. (2012) and shows SDSS J0959+0227 having a narrow Ly line, and would likely be a Lyman- emitting galaxy had it not been an X-ray source, The X-ray luminosity is 3 erg s-1 in the 2-10 keV rest-frame, so it is an AGN. This object is clearly not a regular broadline ‘‘Type 1’’ AGN. Noting that the redshift of for SDSS J0959+0227, the , , , -bands correspond to rest-wavelengths of 1690, 2055, 2690, 3515/3625Å i.e. the rest-frame UV/very blue, so, so the regular blue QSO continuum could be emerging. Thus, with the slightest hint of variability, this could potentially be a high- AGN transitioning from a narrow-line ‘‘Type 2’’ object to a broadline Type 1 quasar.
4 Conclusions
In this study, we have, for the first time, compiled the list of all spectroscopically confirmed quasars. We have assembled the NIR () and MIR (WISE W1/2/3/4) photometry for these objects and given their detection rates. We find that:
-
•
SDSS and Pan-STARRS1 together identified over half of the VHQ sample;
-
•
There remains a quasar ‘‘redshift desert’’ at , though efforts are being made to address this (e.g., Yang et al., 2018a);
-
•
96.9% of the VHQ sample is detected in one or more NIR () band;
-
•
The 15 objects that are not detected in the NIR are due to lack of coverage rather than lack of depth;
-
•
389 (79.7%) VHQs are detected by WISE, e.g. in the deeper unWISE W1 catalog.
-
•
All of the quasars are detected in both unWISE W1 and W2.
-
•
28 of the quasars had enough NIR measurements and sufficient NIR measurements and signal-to-noise ratio to look for variability. Weak variability was detected in multiple bands of SDSS J0959+0227, and very marginally in the Y-band of MMT J0215-0529. Only one quasar, SDSS J0349+0034 had significant differences between their WFCAM and VISTA magnitudes in one band, indicating variability.
The science reach of quasars will continue to be important well into the next decade (Becker et al., 2019; Fan et al., 2019a; Wang et al., 2019) and will provide key insights into direct collapse black holes, hydrogen reionization and the physics of accretion in the first 700 million years of the Universe.
Author Contributions
N.P.R. initiated the project, compiled the list of quasars, wrote most of the analysis code, developed the plotting scripts, and developed and wrote the initial and subsequent drafts of the manuscript.
N.J.G.C. supplied the critical near-infrared expertise and database for which the bulk of the project relies. N.J.G.C. also contributed directly to the writing of the manuscript.
Availability of Data and computer analysis codes
All materials, databases, data tables and code are fully available at: https://github.com/d80b2t/VHzQ
Acknowledgements
NPR acknowledges support from the STFC and the Ernest Rutherford Fellowship scheme.
We thank:
-
Mike Read at the ROE WFAU for help with the WFCAM Science Archive (WSA) and the VISTA Science Archive (VSA).
-
Aaron Meisner and Eddie Schlafly for facilitating early access to the unWISE Catalog.
-
Krisztina Perger for key discussions about missing objects after the pre-print appeared.
-
Tim Brooke at the IRSA Help Desk;
-
Bernie Shiao at STScI for help with the Pan-STARRS1 DR1 CasJobs interface.
-
Michael Cushing for supplying the Late Type stellar spectra and Beth Biller for useful discussion.
-
Nathan Secrest for useful discussions on the mid-IR AGN catalogues.
This paper heavily used TOPCAT (v4.4) (Taylor, 2005, 2011). This research made use of Astropy, a community-developed core Python package for Astronomy (Astropy Collaboration et al., 2013; The Astropy Collaboration et al., 2018).
The VISTA Data Flow System pipeline processing and science archive were used for the WFCAM and VISTA near infrared data are described in Irwin et al (2004), Hambly et al (2008) and Cross et al. (2012).
The Pan-STARRS1 Surveys (PS1) and the PS1 public science archive have been made possible through contributions by the Institute for Astronomy, the University of Hawaii, the Pan-STARRS Project Office, the Max-Planck Society and its participating institutes, the Max Planck Institute for Astronomy, Heidelberg and the Max Planck Institute for Extraterrestrial Physics, Garching, The Johns Hopkins University, Durham University, the University of Edinburgh, the Queen’s University Belfast, the Harvard-Smithsonian Center for Astrophysics, the Las Cumbres Observatory Global Telescope Network Incorporated, the National Central University of Taiwan, the Space Telescope Science Institute, the National Aeronautics and Space Administration under Grant No. NNX08AR22G issued through the Planetary Science Division of the NASA Science Mission Directorate, the National Science Foundation Grant No. AST-1238877, the University of Maryland, Eotvos Lorand University (ELTE), the Los Alamos National Laboratory, and the Gordon and Betty Moore Foundation.
This project used data obtained with the Dark Energy Camera (DECam) and the NOAO Data Lab, The Data Lab is operated by the National Optical Astronomy Observatory, the national center for ground-based nighttime astronomy in the United States operated by the Association of Universities for Research in Astronomy (AURA) under cooperative agreement with the National Science Foundation.
This publication makes use of data products from the Wide-field Infrared Survey Explorer, which is a joint project of the University of California, Los Angeles, and the Jet Propulsion Laboratory/California Institute of Technology, and NEOWISE, which is a project of the Jet Propulsion Laboratory/California Institute of Technology. WISE and NEOWISE are funded by the National Aeronautics and Space Administration.
CasJobs was originally developed by the Johns Hopkins University/ Sloan Digital Sky Survey (JHU/SDSS) team. With their permission, MAST used version 3.5.16 to construct CasJobs-based tools for GALEX, Kepler, the Hubble Source Catalog, and PanSTARRS.
This research has made use of the SVO Filter Profile Service (http://svo2.cab.inta-csic.es/theory/fps/) supported from the Spanish MINECO through grant AyA2014-55216 The SVO Filter Profile Service101010Rodrigo, C., Solano, E., Bayo, A. http://ivoa.net/documents/Notes/SVOFPS/index.html describes the Spanish VO Filter Profile Service. The Filter Profile Service Access Protocol. Rodrigo, C., Solano, E. http://ivoa.net/documents/Notes/SVOFPSDAL/index.html
Appendix A Near-Infrared WFCAM Science Archive SQL queries
Here we give the recipe and SQL that returned the near-infrared photometry for the VHQs from the WFCAM Science Archive.
The data are on the WFCAM Science Archive: wsa.roe.ac.uk. Access the User Login form wsa.roe.ac.uk/login.html with these credentials::
-
•
Username: WSERV1000
-
•
password: highzqso
-
•
community: nonsurvey
Then going to the Free Form SQL Query page the Database release WSERV1000v20200113 can be accessed which contains all the data we use here.
We nota bene a few things. First, the quantity aperJky3 and aperJky3Err are found in the wserv1000MapRemeasAver and wserv1000MapRemeasurement, so care has to be taken to return unique column names (otherwise e.g. astropy.io.fits will crash). As such, we alias aver.aperJky3 to aperJky3Aver and likewise for the error quantity. Aliases will be necessary in some cases anyway, because some queries can be done sensibly on multiple instances of the same table. Other times, one may join tables on quantities such as catalogueID or apertureID, where you are meaning the same thing, but aliases are then necessary for SQLServer to correctly comprehend the query.
Second, the RA and DEC values returned by the WSA are in radians, if used directly. To return values in degrees, use a selection with an alias, e.g. RA as RADeg and DEC as DECDeg. Other relevant query examples can be found in the GitHub repository, under WSA_VSA/SAMPLE_SQL_QUERIES, or the SQLCookbook in the WSA or VSA.
The following SQL will return the best magnitude in each band for each QSO.
Appendix B Near-Infrared VISTA Science Archive SQL queries
In a very similar manner to the WSA, we give here the details on how to access the VISTA Science Archive (VSA)
At the VSA Login, enter with these credentials::
-
•
Username: VSERV1000
-
•
password: highzqso
-
•
community: proprietary
Then the Freeform SQL Query page is where the database release to use is VSERV1000v20200113. The queries are the same as those used in the WSA, see Appendix A, but the names of the tables starting with wserv1000 should be replaced with vserv1000.
Appendix C Updated VHQ Sample
Between the journal submitted version of this paper (which was also the arXiv v1) we updated the sample of VHQs from a total of 463 objects to 488 objects. 16 of these objects were from Yang et al. (2018a) and 9 objects were added after discussions with Krisztina Perger, with the relevant catalog found at astro.elte.hu/perger/catalog.html. We do not include the object DES0141-54 (Belladitta et al., 2018), since we were unable to obtain arcsecond level coordinates to perform our matched-aperture photometry. We also update the positions of five objects, see Table 7.
One object in the Perger catalogue, VA-13492 we could not immediately cross-match. In this case the coordinates looked similar to SDSSJ1040-1155, and the stated redshift was identical, . Additionally the -band magnitude was equivalent to SDSS J1040-1155 ( mag). SDSS J1040-1155 is first reported in Douglas et al. (2007) and a transcription error seems to have occurred in Flesch (2015).
| Object Name | R.A. | Decl. | redshift | difference |
|---|---|---|---|---|
| / deg | / deg | arcsec | ||
| DELS J1048-0109 | +162.0795417 | --1.1611694 | 6.678 | 12.1 |
| SHELLQs J1429-0002 | +217.3342500 | --0.0353889 | 6.04 | 150.0 |
| DELS J1559+2212 | +239.7878750 | +22.2040083 | 6.07 | 3.0 |
| ATLAS J332.8017-32.1036 | +332.8017500 | --32.1035556 | 6.3394 | 3.2 |
| VIK J2318-3113 | +349.5764625 | --31.2295417 | 6.4435 | 239.9 |
References
- Agarwal et al. (2016) Agarwal B., Smith B., Glover S., Natarajan P., Khochfar S., 2016, MNRAS, 459, 4209
- Alexander & Natarajan (2014) Alexander T., Natarajan P., 2014, Science, 345, 1330
- Assef et al. (2012) Assef R. J., et al., 2012, arXiv:1209.6055v1,
- Assef et al. (2018) Assef R. J., Stern D., Noirot G., Jun H. D., Cutri R. M., Eisenhardt P. R. M., 2018, ApJS, 234, 23
- Astropy Collaboration et al. (2013) Astropy Collaboration et al., 2013, Astron. & Astrophys., 558, A33
- Bañados et al. (2014) Bañados E., et al., 2014, AJ, 148, 14
- Bañados et al. (2016) Bañados E., et al., 2016, ApJS, 227, 11
- Bañados et al. (2018a) Bañados E., et al., 2018a, Nat, 553, 473
- Bañados et al. (2018b) Bañados E., Carilli C., Walter F., Momjian E., Decarli R., Farina E. P., Mazzucchelli C., Venemans B. P., 2018b, ApJ Lett., 861, L14
- Becker et al. (1995) Becker R. H., White R. L., Helfand D. J., 1995, ApJ, 450, 559
- Becker et al. (2015) Becker G. D., Bolton J. S., Lidz A., 2015, PASA, 32, 45
- Becker et al. (2019) Becker G., D’Aloisio A., Davies F. B., Hennawi J. F., Simcoe R. A., 2019, in BAAS. p. 440 (arXiv:1903.05199)
- Belladitta et al. (2018) Belladitta S., Moretti A., Caccianiga A., Cicone C., Ghisellini G., Sbarrato T., Severgnini P., Della Ceca R., 2018, in AGN13: Beauty and the Beast. The 13th Italian meeting on Active Galactic Nuclei. p. 29, doi:10.5281/zenodo.1472838
- Bilicki et al. (2016) Bilicki R., et al., 2016, ApJS, 225, 5
- Blain et al. (2013) Blain A., et al., 2013, preprint, (arXiv:1310.2301)
- Bosman et al. (2017) Bosman S. E. I., et al., 2017, MNRAS, 470, 1919
- Brown et al. (2014) Brown M. J. I., Jarrett T. H., Cluver M. E., 2014, PASA, 31, 49
- Calura et al. (2014) Calura F., Gilli R., Vignali C., Pozzi F., Pipino A., Matteucci F., 2014, MNRAS, 438, 2765
- Carilli et al. (2007) Carilli C. L., et al., 2007, ApJ Lett., 666, L9
- Carilli et al. (2010) Carilli C. L., et al., 2010, ApJ, 714, 834
- Carnall et al. (2015) Carnall A. C., et al., 2015, MNRAS, 451, L16
- Casali et al. (2007) Casali M., et al., 2007, Astron. & Astrophys., 467, 777
- Chen et al. (2017) Chen S.-F. S., et al., 2017, ApJ, 850, 188
- Civano et al. (2011) Civano F., et al., 2011, ApJ, 741, 91
- Cool et al. (2006) Cool R. J., et al., 2006, AJ, 132, 823
- Cross et al. (2012) Cross N. J. G., et al., 2012, Astron. & Astrophys., 548, A119
- Cross et al. (2013) Cross N., Hambly N., Collins R., Sutorius E., Read M., Blake R., 2013, in Adamson A., Davies J., Robson I., eds, Astrophysics and Space Science Proceedings Vol. 37, Thirty Years of Astronomical Discovery with UKIRT. p. 193, doi:10.1007/978-94-007-7432-2_17
- Cushing et al. (2006) Cushing M. C., et al., 2006, ApJ, 648, 614
- Cutri et al. (2013) Cutri R. M., et al., 2013, Technical report, Explanatory Supplement to the AllWISE Data Release Products. IPAC/Caltech
- Dalton et al. (2006) Dalton G. B., et al., 2006, in Society of Photo-Optical Instrumentation Engineers (SPIE) Conference Series. p. 62690X, doi:10.1117/12.670018
- De Rosa et al. (2011) De Rosa G., Decarli R., Walter F., Fan X., Jiang L., Kurk J., Pasquali A., Rix H. W., 2011, ApJ, 739, 56
- Dey et al. (2018) Dey A., et al., 2018, preprint, (arXiv:1804.08657)
- Douglas et al. (2007) Douglas L. S., Bremer M. N., Stanway E. R., Lehnert M. D., 2007, MNRAS, 376, 1393
- Driver et al. (2016) Driver S. P., et al., 2016, ApJ, 827, 108
- Edge et al. (2013) Edge A., Sutherland W., Kuijken K., Driver S., McMahon R., Eales S., Emerson J. P., 2013, The Messenger, 154, 32
- Emerson et al. (2004) Emerson J. P., et al., 2004, in P. J. Quinn & A. Bridger ed., Society of Photo-Optical Instrumentation Engineers (SPIE) Conference Series Vol. 5493, Society of Photo-Optical Instrumentation Engineers (SPIE) Conference Series. pp 401--410, doi:10.1117/12.551582
- Emerson et al. (2006) Emerson J., McPherson A., Sutherland W., 2006, The Messenger, 126, 41
- Fan et al. (2000) Fan X., et al., 2000, AJ, 119, 1
- Fan et al. (2001) Fan X., et al., 2001, AJ, 122, 2833
- Fan et al. (2003) Fan X., et al., 2003, AJ, 125, 1649
- Fan et al. (2004) Fan X., et al., 2004, AJ, 128, 515
- Fan et al. (2006a) Fan X., Carilli C. L., Keating B., 2006a, ARA&A, 44, 415
- Fan et al. (2006b) Fan X., et al., 2006b, AJ, 132, 117
- Fan et al. (2018) Fan X., et al., 2018, preprint, (arXiv:1810.11924)
- Fan et al. (2019a) Fan X., et al., 2019a, in BAAS. p. 121 (arXiv:1903.04078)
- Fan et al. (2019b) Fan X., et al., 2019b, ApJ, 870, L11
- Flesch (2015) Flesch E. W., 2015, PASA, 32, e010
- Fukugita et al. (1996) Fukugita M., Ichikawa T., Gunn J. E., Doi M., Shimasaku K., Schneider D. P., 1996, AJ, 111, 1748
- Gezari et al. (2017) Gezari S., et al., 2017, ApJ, 835, 144
- Glikman (2018) Glikman E. o., 2018, ApJ, 861, 37
- Glikman et al. (2018) Glikman E., et al., 2018, arXiv e-prints, p. arXiv:1807.05434
- Goto (2006) Goto T., 2006, MNRAS, 371, 769
- Graham et al. (2019) Graham M. J., et al., 2019, arXiv e-prints, p. arXiv:1905.02262
- Haardt et al. (2016) Haardt F., Gorini V., Moschella U., Treves A., Colpi M., eds, 2016, Astrophysical Black Holes Lecture Notes in Physics, Berlin Springer Verlag Vol. 905, doi:10.1007/978-3-319-19416-5.
- Hambly et al. (2008) Hambly N. C., et al., 2008, MNRAS, 384, 637
- Hickox et al. (2017) Hickox R. C., Myers A. D., Greene J. E., Hainline K. N., Zakamska N. L., DiPompeo M. A., 2017, ApJ, 849, 53
- Hill et al. (2014) Hill A. R., Gallagher S. C., Deo R. P., Peeters E., Richards G. T., 2014, MNRAS, 438, 2317
- Hviding et al. (2018) Hviding R. E., et al., 2018, MNRAS, 474, 1955
- Ikeda et al. (2012) Ikeda H., et al., 2012, ApJ
- Ikeda et al. (2017) Ikeda H., Nagao T., Matsuoka K., Kawakatu N., Kajisawa M., Akiyama M., Miyaji T., Morokuma T., 2017, ApJ, 846, 57
- Jannuzi & Dey (1999) Jannuzi B. T., Dey A., 1999, in Weymann R., et al., eds, ASP Conf. Ser. 191: Photometric Redshifts and the Detection of High Redshift Galaxies. p. 111
- Jansen & Windhorst (2018) Jansen R. A., Windhorst R. A., 2018, PASP, 130, 124001
- Jiang et al. (2006) Jiang L., et al., 2006, AJ, 132, 2127
- Jiang et al. (2008) Jiang L., et al., 2008, AJ, 135, 1057
- Jiang et al. (2009) Jiang L., et al., 2009, AJ, 138, 305
- Jiang et al. (2010) Jiang L., et al., 2010, Nat, 464, 380
- Jiang et al. (2015) Jiang L., McGreer I. D., Fan X., Bian F., Cai Z., Clément B., Wang R., Fan Z., 2015, AJ, 149, 188
- Jiang et al. (2016) Jiang L., et al., 2016, ApJ, 833, 222
- Kaiser et al. (2002) Kaiser N., et al., 2002, in Tyson J. A., Wolff S., eds, Society of Photo-Optical Instrumentation Engineers (SPIE) Conference Series Vol. 4836, Survey and Other Telescope Technologies and Discoveries. pp 154--164, doi:10.1117/12.457365
- Kaiser et al. (2010) Kaiser N., et al., 2010, in Society of Photo-Optical Instrumentation Engineers (SPIE). p. 0, doi:10.1117/12.859188
- Kashikawa et al. (2015) Kashikawa N., et al., 2015, ApJ, 798, 28
- Khorunzhev et al. (2017) Khorunzhev G. A., Burenin R. A., Sazonov S. Y., Amvrosov A. L., Eselevich M. V., 2017, Astronomy Letters, 43, 135
- Kim et al. (2015) Kim Y., et al., 2015, ApJ Lett., 813, L35
- Kim et al. (2018) Kim Y., et al., 2018, preprint, (arXiv:1811.08606)
- Koptelova et al. (2017) Koptelova E., Hwang C.-Y., Yu P.-C., Chen W.-P., Guo J.-K., 2017, Scientific Reports, 7, 41617
- Kozłowski et al. (2019) Kozłowski S., et al., 2019, ApJ, 878, 115
- Krawczyk et al. (2013) Krawczyk C. M., Richards G. T., Mehta S. S., Vogeley M. S., Gallagher S. C., Leighly K. M., Ross N. P., Schneider D. P., 2013, ApJS, 206, 4
- Kurk et al. (2007) Kurk J. D., et al., 2007, ApJ, 669, 32
- Kurk et al. (2009) Kurk J. D., Walter F., Fan X., Jiang L., Jester S., Rix H.-W., Riechers D. A., 2009, ApJ, 702, 833
- LaMassa et al. (2015) LaMassa S. M., et al., 2015, ApJ, 800, 144
- LaMassa et al. (2017) LaMassa S. M., et al., 2017, ApJ, 847, 100
- LaMassa et al. (2019) LaMassa S. M., et al., 2019, ApJ, 876, 50
- Lacy et al. (2004) Lacy M., et al., 2004, ApJS, 154, 166
- Lang (2014) Lang D., 2014, AJ, 147, 108
- Latif et al. (2018) Latif M. A., Volonteri M., Wise J. H., 2018, arXiv:1801.07685v1,
- Lawrence et al. (2007) Lawrence A., et al., 2007, MNRAS, 379, 1599
- Le Fèvre et al. (2003) Le Fèvre O., et al., 2003, in Iye M., Moorwood A. F. M., eds, Proc. SPIEVol. 4841, Instrument Design and Performance for Optical/Infrared Ground-based Telescopes. pp 1670--1681, doi:10.1117/12.460959
- Leipski et al. (2014) Leipski C., et al., 2014, ApJ, 785, 154
- Lupi et al. (2016) Lupi A., Haardt F., Dotti M., Fiacconi D., Mayer L., Madau P., 2016, MNRAS, 456, 2993
- MacLeod et al. (2016) MacLeod C. L., Ross N. P., et al., 2016, MNRAS, 457, 389
- MacLeod et al. (2019) MacLeod C. L., et al., 2019, ApJ, 874, 8
- Madau et al. (2014) Madau P., Haardt F., Dotti M., 2014, ApJ Lett., 784, L38
- Mahabal et al. (2005) Mahabal A., Stern D., Bogosavljević M., Djorgovski S. G., Thompson D., 2005, ApJ Lett., 634, L9
- Mainzer et al. (2011) Mainzer A., et al., 2011, ApJ, 731, 53
- Mainzer et al. (2014) Mainzer A., et al., 2014, ApJ, 792, 30
- Mateos et al. (2012) Mateos S., et al., 2012, MNRAS, 426, 3271
- Matsuoka et al. (2016) Matsuoka Y., et al., 2016, ApJ, 828, 26
- Matsuoka et al. (2018a) Matsuoka Y., et al., 2018a, PASJ, 70, S35
- Matsuoka et al. (2018b) Matsuoka Y., et al., 2018b, ApJS, 237, 5
- Mazzucchelli et al. (2017) Mazzucchelli C., et al., 2017, ApJ, 849, 91
- McGreer et al. (2006) McGreer I. D., Becker R. H., Helfand D. J., White R. L., 2006, ApJ, 652, 157
- McGreer et al. (2013) McGreer I. D., et al., 2013, ApJ, 768, 105
- McGreer et al. (2018) McGreer I. D., Fan X., Jiang L., Cai Z., 2018, AJ, 155, 131
- Meisner et al. (2017) Meisner A. M., Lang D., Schlegel D. J., 2017, AJ, 153, 38
- Meisner et al. (2018a) Meisner A. M., Lang D., Schlegel D. J., 2018a, Research Notes of the American Astronomical Society, 2, 1
- Meisner et al. (2018b) Meisner A. M., Lang D. A., Schlegel D. J., 2018b, Research Notes of the American Astronomical Society, 2, 202
- Miyazaki et al. (2018) Miyazaki S., et al., 2018, PASJ, 70, S1
- Morganson et al. (2012) Morganson E., et al., 2012, AJ, 143, 142
- Mortlock (2016) Mortlock D., 2016, in Mesinger A., ed., Astrophysics and Space Science Library Vol. 423, Understanding the Epoch of Cosmic Reionization: Challenges and Progress. p. 187 (arXiv:1511.01107), doi:10.1007/978-3-319-21957-8_7
- Mortlock et al. (2009) Mortlock D. J., et al., 2009, Astron. & Astrophys., 505, 97
- Mortlock et al. (2011) Mortlock D. J., et al., 2011, Nat, 474, 616
- Oke & Gunn (1983) Oke J. B., Gunn J. E., 1983, ApJ, 266, 713
- Pacucci & Loeb (2019) Pacucci F., Loeb A., 2019, ApJ, 870, L12
- Pâris et al. (2018) Pâris I., et al., 2018, Astron. & Astrophys.
- Pezzulli et al. (2016) Pezzulli E., Valiante R., Schneider R., 2016, MNRAS, 458, 3047
- Pezzulli et al. (2017) Pezzulli E., Volonteri M., Schneider R., Valiante R., 2017, MNRAS, 471, 589
- Planck Collaboration (2016) Planck Collaboration 2016, Astron. & Astrophys., 594, A13
- Reed et al. (2015) Reed S. L., et al., 2015, MNRAS, 454, 3952
- Reed et al. (2017) Reed S. L., et al., 2017, MNRAS, 468, 4702
- Rees (1984) Rees M. J., 1984, ARA&A, 22, 471
- Regan et al. (2019) Regan J. A., et al., 2019, MNRAS, 486, 3892
- Richards et al. (2006) Richards G. T., et al., 2006, ApJS, 166, 470
- Ross et al. (2015) Ross N. P., et al., 2015, MNRAS, 453, 3932
- Ross et al. (2018) Ross N. P., et al., 2018, MNRAS, 480, 4468
- Ross et al. (2019) Ross N., Assef R. J., Kirkpatrick J. D., Graham M. J., 2019, in BAAS. p. 321 (arXiv:1904.06160)
- Ruan et al. (2016) Ruan J. J., et al., 2016, ApJ, 826, 188
- Runco et al. (2016) Runco J. N., et al., 2016, ApJ, 821, 33
- Runnoe et al. (2016) Runnoe J. C., et al., 2016, MNRAS, 455, 1691
- Sawicki (2002) Sawicki M., 2002, AJ, 124, 3050
- Saxena et al. (2018) Saxena A., et al., 2018, MNRAS, 480, 2733
- Schlafly et al. (2019) Schlafly E. F., Meisner A. M., Green G. M., 2019, ApJS, 240, 30
- Schneider et al. (2007) Schneider D. P., et al., 2007, AJ, 134, 102
- Secrest et al. (2015) Secrest N. J., et al., 2015, ApJS, 221, 12
- Shanks et al. (2015) Shanks T., et al., 2015, MNRAS, 451, 4238
- Simcoe et al. (2012) Simcoe R. A., Sullivan P. W., Cooksey K. L., Kao M. M., Matejek M. S., Burgasser A. J., 2012, Nat, 492, 79
- Stern et al. (2005) Stern D., et al., 2005, ApJ, 631, 163
- Stern et al. (2007) Stern D., et al., 2007, ApJ, 663, 677
- Stern et al. (2012) Stern D., et al., 2012, ApJ, 753, 30
- Stern et al. (2018) Stern D., et al., 2018, ApJ, 864, 27
- Stoughton et al. (2002) Stoughton C., et al., 2002, AJ, 123, 485
- Takeo et al. (2018) Takeo E., Inayoshi K., Ohsuga K., Takahashi H. R., Mineshige S., 2018, MNRAS, 476, 673
- Tang et al. (2017) Tang J.-J., et al., 2017, MNRAS, 466, 4568
- Taylor (2005) Taylor M. B., 2005, in Shopbell P., Britton M., Ebert R., eds, Astronomical Society of the Pacific Conference Series Vol. 347, Astronomical Data Analysis Software and Systems XIV. p. 29
- Taylor (2011) Taylor M., 2011, TOPCAT: Tool for OPerations on Catalogues And Tables, Astrophysics Source Code Library (ascl:1101.010)
- The Astropy Collaboration et al. (2018) The Astropy Collaboration et al., 2018, preprint, (arXiv:1801.02634v2)
- Tielens (2008) Tielens A. G. G. M., 2008, ARA&A, 46, 289
- Timlin et al. (2016) Timlin J. D., Ross N. P., et al., 2016, ApJS, 225, 1
- Tokunaga & Vacca (2005) Tokunaga A. T., Vacca W. D., 2005, PASP, 117, 421
- Väisänen et al. (2000) Väisänen P., Tollestrup E. V., Willner S. P., Cohen M., 2000, ApJ, 540, 593
- Valiante et al. (2018) Valiante R., Schneider R., Graziani L., Zappacosta L., 2018, MNRAS, 474, 3825
- Vanden Berk et al. (2001) Vanden Berk D. E., et al., 2001, AJ, 122, 549
- Venemans et al. (2007) Venemans B. P., McMahon R. G., Warren S. J., Gonzalez-Solares E. A., Hewett P. C., Mortlock D. J., Dye S., Sharp R. G., 2007, MNRAS, 376, L76
- Venemans et al. (2012) Venemans B. P., et al., 2012, ApJ Lett., 751, L25
- Venemans et al. (2013) Venemans B. P., et al., 2013, ApJ, 779, 24
- Venemans et al. (2015a) Venemans B. P., et al., 2015a, MNRAS, 453, 2259
- Venemans et al. (2015b) Venemans B. P., et al., 2015b, ApJ Lett., 801, L11
- Venemans et al. (2016) Venemans B. P., Walter F., Zschaechner L., Decarli R., De Rosa G., Findlay J. R., McMahon R. G., Sutherland W. J., 2016, ApJ, 816, 37
- Volonteri (2010) Volonteri M., 2010, A&ARv, 18, 279
- Volonteri et al. (2015) Volonteri M., Silk J., Dubus G., 2015, ApJ, 804, 148
- Wang et al. (2008) Wang R., et al., 2008, ApJ, 687, 848
- Wang et al. (2011) Wang R., et al., 2011, ApJ Lett., 739, L34
- Wang et al. (2016) Wang F., et al., 2016, ApJ, 819, 24
- Wang et al. (2017) Wang F., et al., 2017, ApJ, 839, 27
- Wang et al. (2018b) Wang F., et al., 2018b, arXiv:1810.11926v1,
- Wang et al. (2018a) Wang F., et al., 2018a, arXiv:1810.11925v1,
- Wang et al. (2019) Wang L., et al., 2019, in BAAS. p. 399 (arXiv:1903.06027)
- White et al. (2019) White C. W., Jones V., Jansen R. A., Windhorst R., Cohen S., Willmer C., Hasinger G., 2019, in American Astronomical Society Meeting Abstracts #233. p. 243.06
- Willott et al. (2007) Willott C. J., et al., 2007, AJ, 134, 2435
- Willott et al. (2009) Willott C. J., et al., 2009, AJ, 137, 3541
- Willott et al. (2010) Willott C. J., et al., 2010, AJ, 139, 906
- Willott et al. (2013) Willott C. J., Omont A., Bergeron J., 2013, ApJ, 770, 13
- Willott et al. (2015) Willott C. J., Bergeron J., Omont A., 2015, ApJ, 801, 123
- Wise et al. (2019) Wise J. H., Regan J. A., O’Shea B. W., Norman M. L., Downes T. P., Xu H., 2019, arXiv:1901.07563v1,
- Wright et al. (1994) Wright E. L., Eisenhardt P. E., Fazio G. G., 1994, ArXiv Astrophysics e-prints,
- Wright et al. (2010) Wright E. L., et al., 2010, AJ, 140, 1868
- Wu et al. (2015) Wu X.-B., et al., 2015, Nat, 518, 512
- Wyithe & Loeb (2003) Wyithe J. S. B., Loeb A., 2003, ApJ, 586, 693
- Yan et al. (2007) Yan L., et al., 2007, ApJ, 658, 778
- Yang et al. (2017) Yang J., et al., 2017, AJ, 153, 184
- Yang et al. (2018b) Yang J., et al., 2018b, arXiv:1811.11915v1,
- Yang et al. (2018a) Yang J., et al., 2018a, arXiv:1810.11927v1,
- Yang et al. (2018c) Yang Q., et al., 2018c, ApJ, 862, 109
- Zeimann et al. (2011) Zeimann G. R., White R. L., Becker R. H., Hodge J. A., Stanford S. A., Richards G. T., 2011, ApJ, 736, 57
- van Breugel et al. (1999) van Breugel W., De Breuck C., Stanford S. A., Stern D., Röttgering H., Miley G., 1999, ApJ Lett., 518, L61