Substructures in the Keplerian disc around the O-type (proto)star G17.640.16 ††thanks: The data presented in this article are available in electronic form at the CDS via anonymous ftp to cdsarc.u-strasbg.fr (130.79.128.5) or via http://cdsweb.u-strasbg.fr/cgi-bin/qcat?J/A+A/
We present the highest angular resolution (2015 mas - 4433 au) Atacama Large Millimeter/sub-millimeter Array (ALMA) observations currently possible of the proto-O-star G17.64+0.16 in Band 6. The Cycle 5 observations with baselines out to 16 km probes scales 50 au and reveal the rotating disc around G17.64+0.16, a massive forming O-type star. The disc has a ring-like enhancement in the dust emission, especially visible as arc structures to the north and south. The Keplerian kinematics are most prominently seen in the vibrationally excited water line, H2O 56 (=3461.9 K). The mass of the central source found by modelling the Keplerian rotation is consistent with 4510 M⊙. The H30 (231.9 GHz) radio-recombination line and the SiO (5-4) molecular line were detected at up to the level. The estimated disc mass is 0.62.6 M⊙ under the optically thin assumption. Analysis of the Toomre Q parameter, in the optically thin regime, indicates that the disc stability is highly dependent on temperature. The disc currently appears stable for temperatures 150 K, this does not preclude that the substructures formed earlier through disc fragmentation.
Key Words.:
stars: formation - stars: protostars - stars: massive - stars: winds, outflows - stars: pre-main sequence - submillimeter: stars1 Introduction
Spiral arms or rings and gaps in the discs of solar mass protostars are now common place, detectable at both IR and mm wavelengths (ALMA Partnership et al., 2015; Brandt et al., 2014; Andrews et al., 2016, 2018; Walsh et al., 2017; Monnier et al., 2019; de Boer et al., 2016). Ring-gap structures have been explained by planets, zonal-flows, snow-lines, or dust trapping (Nazari et al., 2019; Isella & Turner, 2018; Dipierro et al., 2015; Ruge et al., 2016; Zhang et al., 2015), while spiral structures could be caused by interactions with planets or stellar binaries, or due to a gravitational instability of the disc itself (Benisty et al., 2017; Quillen et al., 2005; Meru et al., 2017; Mayer et al., 2016). In the context of massive star formation, there are only a handful of sources that have convincing evidence of disc rotation on sub-1000 au scales (e.g. Johnston et al., 2015; Ilee et al., 2016; Ginsburg et al., 2018; Moscadelli & Goddi, 2014; Moscadelli et al., 2019; Zapata et al., 2019). The detection of discs and rotation can still be somewhat difficult to identify even in the few targets that have been probed at sub-100 au resolution. Work by Beuther et al. (2019) indicate a highly fragmented star formation region in G351.77-0.54, with 12 identified structures, and tentative evidence of rotation in a few cores, while Goddi et al. (2018) observed the W51 region and also indicate a highly clustered complex environment with little, if any, evidence for stable discs.

Theoretical works involving the formation of massive stars must invoke accretion discs. Simulations typically result in large-scale (5001000 au) spiral-like features or streamers that funnel the accretion flows (Meyer et al., 2018; Harries et al., 2017; Krumholz et al., 2009; Peters et al., 2010; Kuiper et al., 2011; Klassen et al., 2016; Rosen et al., 2016; Kuiper & Hosokawa, 2018), which themselves have recently been observed in a few cases (Maud et al., 2017; Izquierdo et al., 2018; Liu et al., 2015; Cesaroni et al., 2014). Multiple, or binary systems are clearly predicted by those simulations, and the substructures, either spirals, rings or fragmented discs around massive protostars should be possible to image using ALMA (e.g. Jankovic et al., 2019; Meyer et al., 2018).
Studies indicate that over 70 % of main-sequence OB stars (Sana et al., 2012; Almeida et al., 2017), and 50 % of massive young stellar objects (Pomohaci et al., 2019) are known to display binarity or multiplicity. In the deeply embedded star formation stages very high angular resolution (100 au scales) sub-mm observations are required to probe the natal environments. There is one recent example of a binary in a proto-O-star system where the secondary, separated by 1200 au, is still within the disc and thought to have formed by disc fragmentation (Ilee et al., 2018). Furthermore, Zhang et al. (2019) present ALMA long-baseline observations that resolve a high-mass binary system (total-mass 18 M⊙) with a physical separation of 180 au.
However, rings, gaps or spiral substructures below 500 au spatial scales have not yet been detected in discs around massive-protostars.
G17.640.16 (hereafter G17.64, also AFGL 2136, G017.6380+00.1566, CRL 2136, and IRAS 18196-1331) is a well-known massive young stellar object (MYSO) that we originally targeted with ALMA along with five other luminous O-type (proto)stars in search for evidence of discs (Cesaroni et al., 2017). Located at 2.2 kpc and with a bolometric luminosity of 1105 L⊙111Red MSX Survey: http://rms.leeds.ac.uk/cgi-bin/public/RMS_DATABASE.cgi (Lumsden et al., 2013) G17.64 is one of the closest O-type (proto)stars. It is a bright source at near- to mid-IR wavelengths (Kastner et al., 1992; Holbrook & Temi, 1998; de Wit et al., 2009; Murakawa et al., 2013) and is detected through to the cm regime (e.g. van der Tak et al., 2000; Menten & van der Tak, 2004; Lu et al., 2014). It drives an outflow (position-angle 135∘), illuminates a reflection nebulae, and excites H2O masers (Menten & van der Tak, 2004). Interferometric IR observations indicated G17.64 as a candidate compact (100 au) disc source (Boley et al., 2013). Maud et al. (2018) presented 0.2′′ resolution ALMA data probing scales down to 400 au. They did not resolve the continuum emission, but marginally resolved the SiO emission that is thought to trace a rotating disc and disc wind. Modelling the position-velocity profile they estimated a central source mass between 20 and 30 M⊙.
In this letter we report on the observations of G17.64 using the ALMA long-baselines at Band 6. Achieving a resolution of 2015 mas (4433 au), ten times higher than our previous study, we now fully resolve the dust and molecular line emission and for the first time uncover clear enhanced substructures in the disc around this massive forming O-star.
.
2 Observations
The ALMA 12 m observations consist of one execution block (EB) conducted during Cycle 5 on 4 October 2017 (project ID: 2017.1.00098.S - PI: Maud) in configuration C43-10, with 43 antennas. The on-source time was 30.6 minutes. The spectral setup covered the frequency range of our previous observations (see also Cesaroni et al., 2017). To provide maximal sensitivity to the dust continuum, all four spectral-windows (SPWs) were configured with the widest bandwidth of 1.875 GHz but covered previously detected lines, e.g. SiO (54) and H30. The resulting velocity resolution was of the order 1.3 km s-1, except in the SPW covering SiO which was 0.8 km s-1. We also covered the H2O 564,3 line in the same SPW as H30. The maximal angular resolution of 2015 mas at a position-angle (PA) of -88.4∘ in the continuum was achieved using a robust parameter of 0.0 (Briggs, 1995). Data calibration used the casa pipeline, version 5.1.1 (McMullin et al., 2007), while subsequent imaging and self-calibration used version 5.4.0. As G17.64 is comparably line weak (Cesaroni et al., 2017) all line-free regions were easily identifiable and continuum subtraction was undertaken in the u,v domain. Self-calibration was possible down to a solution time of 6 s in phase and 54 s for amplitude, improving the dynamic range from 405 to 640. The final continuum noise level achieved was 40.4 Jy beam-1. For the H2O images a robust value of 1.5 was used to boost surface brightness sensitivity. The resulting resolution was 2823 mas at a PA of 65.8∘ and achieved a sensitivity of 0.76 mJy bm-1 ch-1 (1.3 km s-1). We detected SiO (54) and the H30 radio-recombination line which are mentioned in the appendix. During self-calibration we shifted the phase centre of G17.64 to the position of peak emission, J2000 18h22m26.3862s 13∘30′11.9717′′, to centralise our images. All imaging and self-calibration steps were performed with and without shifting the phase centre to ensure the features detected are real and not interferometric side-lobe artefacts, no notable differences were seen in any of our images.
3 Results
3.1 Continuum emission
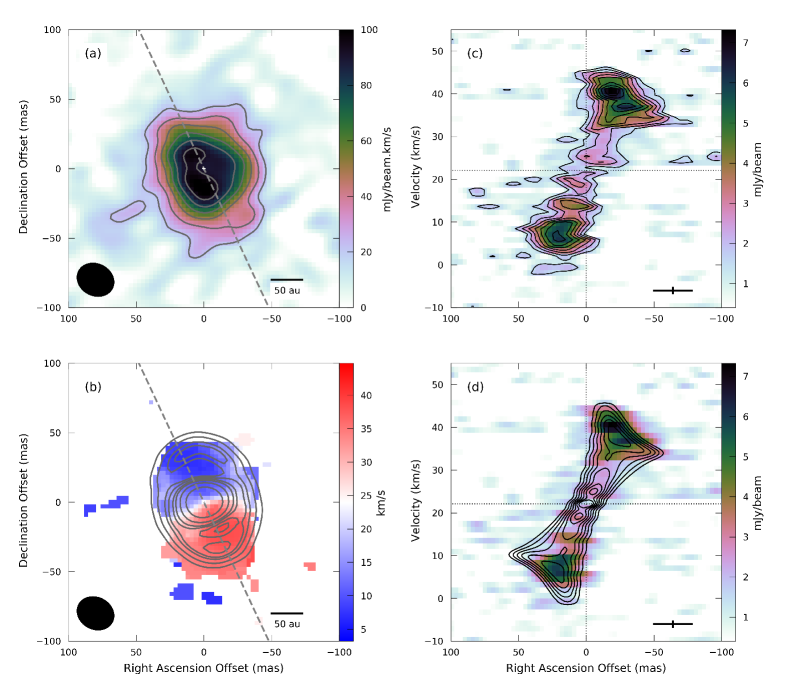
Figure 1a shows our image of the continuum emission from G17.64 in a logarithmic colour scaling to highlight the fainter emission. The continuum dust disc is well resolved and has a clear enhanced ring-like structure that is most readily visible to the north and south between 6597 au in the radial direction.
Fitting an ellipse to the 50 contour level (2.0 mJy beam-1) we find that the disc measures 9371 mas. Assuming a circular thin-disc where the mm-sized dust grains have settled to the mid-plane (e.g. Testi et al., 2014) we estimate the disc inclination as 404∘ (where 90∘ is edge-on). The uncertainty propagates from fitting the disc size at the 30 and 70 contours and calculation of the respective inclination angles. The peak flux is 25.12 mJy beam-1, while the enhanced arc regions peak at between 34 mJy beam-1. We recover an integrated flux of 79.14 mJy (within a 60 mas radius circle) which is entirely consistent with the previous ALMA observations (81.3 mJy before free-free subtraction, Maud et al., 2018) and confirms that we are not resolving out any emission and can attribute the total flux entirely to the disc. Using a minimum value of 250 m when considering the well sampled short baselines, we note our maximal recoverable scale is at least 0.64′′, much larger than the dust disc.
In Maud et al. (2018) we reported that the radio wavelength emission accounts for between 3.57 mJy and 29.5 mJy when extrapolated to the mm regime. Considering the peak flux is 25.12 mJy beam-1, this places an upper limit to the free-free contamination in the case that it fully represents the mm emission. In Fig. 1b we show the image of G17.64 after the subtraction of a point source, made in the visibility domain, using the upper limit of the free-free contamination. A point source assumption is consistent with the size (29 mas at 43 GHz) found by Menten & van der Tak (2004) and the reduction in angular size with increasing frequency (, Wright & Barlow 1975). Note, the removal of a point-source in the visibility domain can be understood as removing a 2D gaussian with the synthesised beam parameters in the image plane. After the removal of the maximal and minimal free-free components the resulting lower limit optically thin disc mass ranges from 0.6 to 2.6 M⊙ following Hildebrand (1983) and using dust temperatures of 50 K, 100 K and 150 K consistent with Maud et al. (2018) and Section 4.2 (see appendix for details).
Jankovic et al. (2019) report that total removal of a central gaussian feature can be a useful technique to highlight residual substructures. It is coincidental that the necessary removal of the free-free contamination from G17.64 has a similar effect. In Fig. 1b the brightest structure in the dust disc has a peak flux of 4.4 mJy beam-1. Although speculative, because the free-free contamination is uncertain, we tentatively reveal an enhanced inner ring or poorly resolved spiral-like structure.
3.2 H2O
Figure 2 presents the moment-0 and moment-1 maps of the H2O 56 line at 232.68670 GHz (=3461.9 K) in panels (a) and (b) and position-velocity (PV) diagrams over plotted with contours of the data and the best representative model in panels (c) and (d). The extreme excitation energy of this line makes it particularly suited for tracing very inner regions of a molecular disc (Hirota et al., 2014; Ginsburg et al., 2018). To our sensitivity and resolution limit the H2O emission appears devoid of any structure and does not extend beyond the outer radius of the disc as traced by the dust continuum emission (grey contours Fig.2b). In all velocity channels the peak of emission is away from the centre of the dust disc, while at the highest blue- and red-shifted velocities the H2O emission peaks between the enhanced continuum dust ring and the central location of G17.64. The moment-0 contours in Figure 2a shows how the H2O emission could appear like a disc with a central hole, or a single wide ring ranging from approximately half of the beam (30 au) to 120 au in radius, (e.g. like the SO emission in Yen et al., 2014). The cut for the PV diagram was taken at a position angle of 25.9∘ using a width of 5 pixels to encompass one beam of emission (grey dashed line in Fig.2a,b). The PA was established by fitting a line through the centres of Gaussian fits to independent moment-0 maps of the blue- (3.221.4 km s-1) and red-shifted (22.744.8 km s-1) emission and the central position of G17.64 from the dust continuum. The PV diagram depicts the clear pattern of Keplerian rotation, particularly the red-shifted emission 30 km s-1 where the highest velocities peak closer towards the central source. The H2O is undoubtedly tracing a rotating disc.
4 Discussion
4.1 Stellar mass
Based on its luminosity G17.64 is firmly positioned as an O-star (e.g. Vacca et al., 1996). However, previous estimates of the stellar mass, which are essential for understanding the disc stability, were not well constrained due to poorly resolved kinematics (Maud et al., 2018). Building from our previous representative models presented in Maud et al. (2018) we match the H2O PV diagram with only very minor changes. We use our ‘disc-only’ model for the H2O emission, as there is no evidence for extended structure, we fix the disc outer radius to 120 au as per the dust and H2O maps and also revise the inclination angle to 405∘. Now that the disc is fully resolved we have a measure of the system inclination which was a previously degenerate parameter (Maud et al., 2018). The inner radius is varied only between 2530 au in line with the lack of strong H2O emission at the centre (Fig.2a, see also Maud et al., 2018), and consistent with the potentially ionised inner disc seen in H30 emission (appendix). With these modifications, the modelled central mass must be increased to 4510 M⊙ to best match the observed PV diagram (Fig.2c,d), especially the red-shifted emission at higher velocities. The mass increase compared to Maud et al. (2018) is due to the revised inclination angle as the disc is more face-on. Following Maud et al. (2018), fitting is made by-eye matching equivalent contour levels (see also Ilee et al., 2018).
4.2 Disc stability
In discs undergoing Keplerian rotation, local regions may be unstable to axisymmetric perturbations if the Toomre parameter, Q, (Toomre, 1964) is:
| (1) |
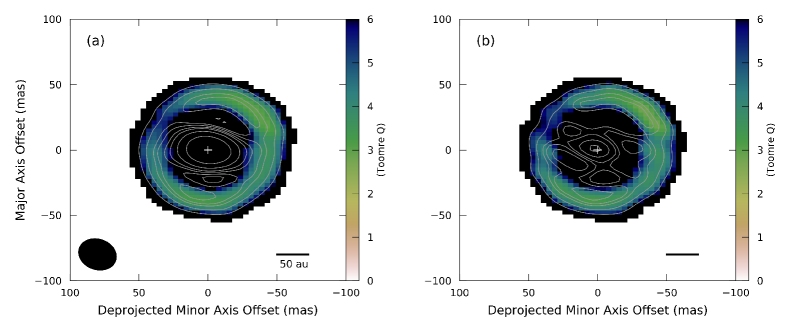
where is the sound speed, is the epicyclic frequency - orbital velocity for a Keplerian disc - G is the gravitational constant, and is the disc surface density. Figure 3a,b show the Toomre Q maps for G17.64 where the minimal and maximal free-free contamination is removed. A deprojection has been applied in the image plane for the minor disc axis after rotation (major axis is north-south). We follow the methods outlined in Beuther et al. (2017) and Ahmadi et al. (2018). Both the mass surface density, calculated from the column density (Eq 2. Schuller et al., 2009) multiplied by the mean molecular weight and mass of the hydrogen atom (, where = 2.3), and the sound speed use a radial temperature dependence and we directly calculate the orbital velocity from Keplerian rotation. The temperature of the disc is calculated using (Whitney et al., 2003) propagating from the outer radius and temperature of a 45 M⊙ main-sequence O-star from Hosokawa & Omukai (2009), where for G17.64 we estimated, 9.3 R⊙, 1.9105 L⊙ and 60000 K. At radii 150 au the disk temperature is 150 K.
The ring-like enhancement between radii 6597 au has the lowest Toomre Q values, between 2 and 4. There is little difference between the data with the minimal and maximal free-free contamination removed as the lowest Q regions are away from the central peak where the free-free contamination occurs. There are no current instabilities identified in the substructures (c.f. Fig.1b). If we use a steeper temperature profile (e.g. -0.5, Brinch & Hogerheijde, 2010) the temperature in the disc is below 150 K, and the overall cooler disc can become unstable Q1. Additionally, in an optically thick case, suggested by the continuum average brightness temperatures (see the appendix), the surface density will increase when correcting for opacity and Q would decrease. If considering a highly flared disc, the Toomre criterion is met where Q1.7 (Durisen et al., 2007), thus a proxy of the dust and gas disc scale heights and temperature estimation from radiative transfer are required to better constrain the stability. The presented Toomre Q analysis suggests that unless the dust is cold and significantly shielded the disc can remain stable against fragmentation. This does not preclude that the existing substructures may have formed from fragmentation. During formation, a more massive, cooler, and potentially largely flared disc combined with a reduced stellar mass would have yielded conditions where Q¡1.7.
4.3 Disc enhancements
G17.64 is the first massive O-type source in which substructure has been observed in the disc. Interestingly, recent IR interferometry and models by Frost et al. (2019) suggest that the MYSO G305.20+0.21 could be a massive transition disc, with an inner edge at 60 au, not dissimilar to the ring-enhancement in G17.64, although there are no high-resolution mm studies. Similar processes, such as radial drifts, could be at work in G17.64 as they are in low-mass sources (Pinilla et al., 2018). In this case dust grains become trapped in pressure maxima and can grow (see Sec.1), however, multi-wavelength observations are required to establish dust grain sizes and confirm the phenomena. Considering that most massive systems exist as binaries, it is plausible that a binary companion is the cause of the ring-like enhancements, much like the 1.8 M⊙ source HD 142527 (Price et al., 2018). We could interpret the brightest dust peak south-east of G17.64+0.16 as a binary companion, although there is no clearly separated source like in Ilee et al. (2018). The substructures could be spirals caused by instabilities occurring before this ‘stable’ disc phase as these would appear as arc or ring-like enhancements if not fully resolved. Higher-frequency observations may be the only way to probe 10 au scales, provided that substructures are still visible with increasing optical depth.
5 Conclusions
In this letter we present ALMA long baseline observations that reveal the disc in the proto-O-star G17.640.16. Through the PV analysis of the H2O emission using our disc model we confirm Keplerian rotation about a central mass of 4510 M⊙. We find that the continuum emission has a significant enhancement of dust emission in a ring-like, or possibly underlying spiral structure. The disc is found to be locally stable through a Toomre Q analysis in the optically thin case when disc temperature are 150 K.
Acknowledgements.
The authors thank the referee for their detailed comments that helped to improve this manuscript. MSNK acknowledges the support from Fundação para a Ciência e Tecnologia through Investigador contracts and exploratory project IF/00956/2015/CP1273/CT0002 HB and AA acknowledge support from the European Research Council under the European Community’s Horizon 2020 framework program (2014-2020) via the ERC Consolidator Grant ‘From Cloud to Star Formation (CSF)’ (project number 648505). RGM acknowledges support from UNAM-PAPIIT Programme IN104319. RK acknowledges financial support via the Emmy Noether Research Group funded by the German Research Foundation (DFG) under grant no. KU 2849/3-1 and KU 2849/3-2. VMR thanks the funding from the European Union’s Horizon 2020 research and innovation programme under the Marie Skłodowska-Curie grant agreement No 664931. This paper makes use of the least-squares fitting by Hammel & Sullivan-Molina (2019). This paper makes use of the following ALMA data: ADS/JAO.ALMA#2017.1.00098.S. ALMA is a partnership of ESO (representing its member states), NSF (USA) and NINS (Japan), together with NRC (Canada), NSC and ASIAA (Taiwan), and KASI (Republic of Korea), in cooperation with the Republic of Chile. The Joint ALMA Observatory is operated by ESO, AUI/NRAO and NAOJ.References
- Ahmadi et al. (2018) Ahmadi, A., Beuther, H., Mottram, J. C., et al. 2018, A&A, 618, A46
- ALMA Partnership et al. (2015) ALMA Partnership, Brogan, C. L., Pérez, L. M., et al. 2015, ApJL, 808, L3
- Almeida et al. (2017) Almeida, L. A., Sana, H., Taylor, W., et al. 2017, A&A, 598, A84
- Andrews et al. (2018) Andrews, S. M., Huang, J., Pérez, L. M., et al. 2018, ApJ, 869, L41
- Andrews et al. (2016) Andrews, S. M., Wilner, D. J., Zhu, Z., et al. 2016, ApJ, 820, L40
- Benisty et al. (2017) Benisty, M., Stolker, T., Pohl, A., et al. 2017, A&A, 597, A42
- Beuther et al. (2019) Beuther, H., Ahmadi, A., Mottram, J. C., et al. 2019, A&A, 621, A122
- Beuther et al. (2017) Beuther, H., Walsh, A. J., Johnston, K. G., et al. 2017, A&A, 603, A10
- Boley et al. (2013) Boley, P. A., Linz, H., van Boekel, R., et al. 2013, A&A, 558, A24
- Brandt et al. (2014) Brandt, T. D., Kuzuhara, M., McElwain, M. W., et al. 2014, ApJ, 786, 1
- Briggs (1995) Briggs, D. S. 1995, in Bulletin of the American Astronomical Society, Vol. 27, American Astronomical Society Meeting Abstracts, 1444
- Brinch & Hogerheijde (2010) Brinch, C. & Hogerheijde, M. R. 2010, A&A, 523, A25
- Cesaroni et al. (2014) Cesaroni, R., Galli, D., Neri, R., & Walmsley, C. M. 2014, A&A, 566, A73
- Cesaroni et al. (2017) Cesaroni, R., Sánchez-Monge, Á., Beltrán, M. T., et al. 2017, A&A, 602, A59
- de Boer et al. (2016) de Boer, J., Salter, G., Benisty, M., et al. 2016, A&A, 595, A114
- de Wit et al. (2009) de Wit, W. J., Hoare, M. G., Fujiyoshi, T., et al. 2009, A&A, 494, 157
- Dipierro et al. (2015) Dipierro, G., Pinilla, P., Lodato, G., & Testi, L. 2015, MNRAS, 451, 974
- Durisen et al. (2007) Durisen, R. H., Boss, A. P., Mayer, L., et al. 2007, in Protostars and Planets V, ed. B. Reipurth, D. Jewitt, & K. Keil, 607
- Frost et al. (2019) Frost, A. J., Oudmaijer, R. D., de Wit, W. J., & Lumsden, S. L. 2019, A&A, 625, A44
- Ginsburg et al. (2018) Ginsburg, A., Bally, J., Goddi, C., Plambeck, R., & Wright, M. 2018, ApJ, 860, 119
- Goddi et al. (2018) Goddi, C., Ginsburg, A., Maud, L., Zhang, Q., & Zapata, L. 2018, ArXiv e-prints [arXiv:1805.05364]
- Hammel & Sullivan-Molina (2019) Hammel, B. & Sullivan-Molina, N. 2019, bdhammel/least-squares-ellipse-fitting: Initial release
- Harries et al. (2017) Harries, T. J., Douglas, T. A., & Ali, A. 2017, MNRAS, 471, 4111
- Hildebrand (1983) Hildebrand, R. H. 1983, Quarterly Journal of the Royal Astronomical Society, 24, 267
- Hirota et al. (2014) Hirota, T., Kim, M. K., Kurono, Y., & Honma, M. 2014, ApJL, 782, L28
- Holbrook & Temi (1998) Holbrook, J. C. & Temi, P. 1998, ApJ, 496, 280
- Hosokawa & Omukai (2009) Hosokawa, T. & Omukai, K. 2009, ApJ, 691, 823
- Ilee et al. (2018) Ilee, J. D., Cyganowski, C. J., Brogan, C. L., et al. 2018, ApJ, 869, L24
- Ilee et al. (2016) Ilee, J. D., Cyganowski, C. J., Nazari, P., et al. 2016, MNRAS, 462, 4386
- Isella & Turner (2018) Isella, A. & Turner, N. J. 2018, ApJ, 860, 27
- Izquierdo et al. (2018) Izquierdo, A. F., Galván-Madrid, R., Maud, L. T., et al. 2018, MNRAS, 478, 2505
- Jankovic et al. (2019) Jankovic, M. R., Haworth, T. J., Ilee, J. D., et al. 2019, MNRAS, 482, 4673
- Johnston et al. (2015) Johnston, K. G., Robitaille, T. P., Beuther, H., et al. 2015, ApJL, 813, L19
- Kastner et al. (1992) Kastner, J. H., Weintraub, D. A., & Aspin, C. 1992, ApJ, 389, 357
- Klassen et al. (2016) Klassen, M., Pudritz, R. E., Kuiper, R., Peters, T., & Banerjee, R. 2016, ApJ, 823, 28
- Krumholz et al. (2009) Krumholz, M. R., Klein, R. I., McKee, C. F., Offner, S. S. R., & Cunningham, A. J. 2009, Science, 323, 754
- Kuiper & Hosokawa (2018) Kuiper, R. & Hosokawa, T. 2018, A&A, 616, A101
- Kuiper et al. (2011) Kuiper, R., Klahr, H., Beuther, H., & Henning, T. 2011, ApJ, 732, 20
- Liu et al. (2015) Liu, H. B., Galván-Madrid, R., Jiménez-Serra, I., et al. 2015, ApJ, 804, 37
- Lu et al. (2014) Lu, X., Zhang, Q., Liu, H. B., Wang, J., & Gu, Q. 2014, ApJ, 790, 84
- Lumsden et al. (2013) Lumsden, S. L., Hoare, M. G., Urquhart, J. S., et al. 2013, ApJS, 208, 11
- Maud et al. (2018) Maud, L. T., Cesaroni, R., Kumar, M. S. N., et al. 2018, A&A, 620, A31
- Maud et al. (2017) Maud, L. T., Hoare, M. G., Galván-Madrid, R., et al. 2017, MNRAS, 467, L120
- Mayer et al. (2016) Mayer, L., Peters, T., Pineda, J. E., Wadsley, J., & Rogers, P. 2016, ApJ, 823, L36
- McMullin et al. (2007) McMullin, J. P., Waters, B., Schiebel, D., Young, W., & Golap, K. 2007, in Astronomical Society of the Pacific Conference Series, Vol. 376, Astronomical Data Analysis Software and Systems XVI, ed. R. A. Shaw, F. Hill, & D. J. Bell, 127
- Menten & van der Tak (2004) Menten, K. M. & van der Tak, F. F. S. 2004, A&A, 414, 289
- Meru et al. (2017) Meru, F., Juhász, A., Ilee, J. D., et al. 2017, ApJ, 839, L24
- Meyer et al. (2018) Meyer, D. M. A., Kuiper, R., Kley, W., Johnston, K. G., & Vorobyov, E. 2018, MNRAS, 473, 3615
- Monnier et al. (2019) Monnier, J. D., Harries, T. J., Bae, J., et al. 2019, ApJ, 872, 122
- Moscadelli & Goddi (2014) Moscadelli, L. & Goddi, C. 2014, A&A, 566, A150
- Moscadelli et al. (2019) Moscadelli, L., Sanna, A., Cesaroni, R., et al. 2019, A&A, 622, A206
- Murakawa et al. (2013) Murakawa, K., Lumsden, S. L., Oudmaijer, R. D., et al. 2013, MNRAS, 436, 511
- Nazari et al. (2019) Nazari, P., Booth, R. A., Clarke, C. J., et al. 2019, MNRAS, 485, 5914
- Ossenkopf & Henning (1994) Ossenkopf, V. & Henning, T. 1994, A&A, 291, 943
- Peters et al. (2010) Peters, T., Mac Low, M.-M., Banerjee, R., Klessen, R. S., & Dullemond, C. P. 2010, ApJ, 719, 831
- Pinilla et al. (2018) Pinilla, P., Tazzari, M., Pascucci, I., et al. 2018, ApJ, 859, 32
- Pomohaci et al. (2019) Pomohaci, R., Oudmaijer, R. D., & Goodwin, S. P. 2019, MNRAS, 484, 226
- Price et al. (2018) Price, D. J., Cuello, N., Pinte, C., et al. 2018, MNRAS, 477, 1270
- Quillen et al. (2005) Quillen, A. C., Varnière, P., Minchev, I., & Frank, A. 2005, AJ, 129, 2481
- Rosen et al. (2016) Rosen, A. L., Krumholz, M. R., McKee, C. F., & Klein, R. I. 2016, MNRAS, 463, 2553
- Ruge et al. (2016) Ruge, J. P., Flock, M., Wolf, S., et al. 2016, A&A, 590, A17
- Sana et al. (2012) Sana, H., de Mink, S. E., de Koter, A., et al. 2012, Science, 337, 444
- Schuller et al. (2009) Schuller, F., Menten, K. M., Contreras, Y., et al. 2009, A&A, 504, 415
- Testi et al. (2014) Testi, L., Birnstiel, T., Ricci, L., et al. 2014, in Protostars and Planets VI, ed. H. Beuther, R. S. Klessen, C. P. Dullemond, & T. Henning, 339
- Toomre (1964) Toomre, A. 1964, ApJ, 139, 1217
- Vacca et al. (1996) Vacca, W. D., Garmany, C. D., & Shull, J. M. 1996, ApJ, 460, 914
- van der Tak et al. (2000) van der Tak, F. F. S., van Dishoeck, E. F., Evans, II, N. J., & Blake, G. A. 2000, ApJ, 537, 283
- Walsh et al. (2017) Walsh, C., Daley, C., Facchini, S., & Juhász, A. 2017, A&A, 607, A114
- Whitney et al. (2003) Whitney, B. A., Wood, K., Bjorkman, J. E., & Wolff, M. J. 2003, ApJ, 591, 1049
- Wright & Barlow (1975) Wright, A. E. & Barlow, M. J. 1975, MNRAS, 170, 41
- Yen et al. (2014) Yen, H.-W., Takakuwa, S., Ohashi, N., et al. 2014, ApJ, 793, 1
- Zapata et al. (2019) Zapata, L. A., Garay, G., Palau, A., et al. 2019, ApJ, 872, 176
- Zhang et al. (2015) Zhang, K., Blake, G. A., & Bergin, E. A. 2015, ApJ, 806, L7
- Zhang et al. (2019) Zhang, Y., Tan, J. C., Tanaka, K. E. I., et al. 2019, Nature Astronomy, 224
Appendix A Disc mass and other lines
Disc Mass
The disc mass is estimated in the standard fashion :
| (2) |
where is the source flux, g is the gas-to-dust ratio = 100, is the Planck function for a temperature, , is the source distance, and is the dust opacity coefficient. At 1.3 mm (220 GHz) we use = 1.0 cm2 g-1 as suggested for dust with thin ice mantles at densities of 10108 cm-3 (Ossenkopf & Henning 1994). As noted we use temperatures, , between 50-150 K. Even when using temperatures lower than the disc average continuum brightness temperature, 193 K and 138 K dependent on the free-free subtraction, or those found by scaling from the source temperature (where the inner radii are slightly hotter) the disc mass should be considered as a lower limit if we are in the optically thick regime. An optical depth of =1 would account for a disc mass increase by a factor of 1.6, to between 1.0 and 4.2 M⊙
Other Lines
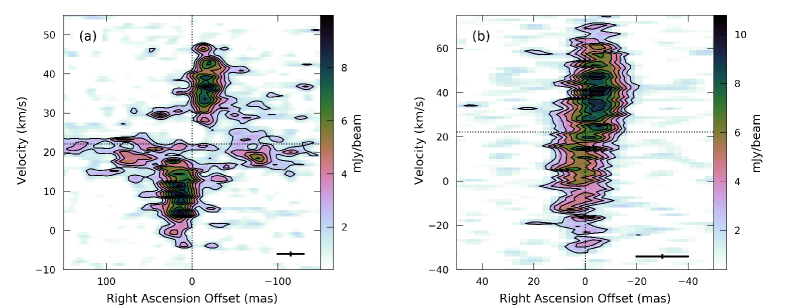
We detected the previously known, strong SiO (54) molecular line emission and the H30 radio-recombination line. The PV diagrams for these lines are shown in Fig.4. The SiO also well traces the disc structure following the H2O emission at disc radii of 120 au, however, at low velocities closer to the source VLSR the SiO is significantly more extended reaching out to at least 250 au in radius before the surface brightness sensitivity is too low. The map was made with robust 1.5, the resolution is 3024 mas at a PA of 64.9∘ and the sensitivity is 1.02 mJy beam-1 per 0.8 km s-1 channel. The extended emission was seen previously in our lower-resolution ALMA observations (Maud et al. 2018) and is thought to be tracing outflowing material in a disc wind.
The H30 emission appears unresolved per channel in the image cube and traces only the very central region of G17.64, although there is a marginal shift in spatial position from blue- to red-shifted velocities. We imaged using a robust 0.0 to provide the highest resolution (2018 mas, PA=-88.4∘). The resulting sensitivity is 1.11 mJy beam-1 per 1.3 km s-1 channel. In the PV diagram, Fig.4b, the slight shift in position with change in velocity is clearer, and is in the same rotation sense as the H2O and SiO emission. The H30 could be tracing a hot inner rotating structure inward of the molecular line region. We note that the total spectral coverage of our data are, SPW0: 216.746-218.621 GHz, SPW1: 218.854-220.746 GHz, SPW2: 230.938-232.812 GHz, SPW3: 233.048-234.94 GHz.