The Tibet AS Collaboration
First Detection of Photons with Energy Beyond 100 TeV
from an Astrophysical Source
Abstract
We report on the highest energy photons from the Crab Nebula observed by the Tibet air shower array with the underground water-Cherenkov-type muon detector array. Based on the criterion of muon number measured in an air shower, we successfully suppress 99.92% of the cosmic-ray background events with energies TeV. As a result, we observed 24 photon-like events with TeV against 5.5 background events, which corresponds to 5.6 statistical significance. This is the first detection of photons with TeV from an astrophysical source.
I Introduction
The Crab Nebula powered by a central spinning pulsar and a fluctuating magnetized relativistic pulsar wind [1] is one of the most energetic astrophysical sources in the entire sky, and the energy spectrum of photons from it has been measured in a wide energy range from radio up to nearly 100 TeV. However, the photons of energy TeV have never been detected so far.
Photons in the TeV energies from the Crab Nebula have been observed with many ground-based gamma-ray experiments [2, 3, 4, 5, 6, 7, 8, 9, 10, 11]. Among them, the HEGRA experiment had obtained the energy spectrum which can be approximately fitted by a single power-law shape in the highest energy range up to 75 TeV [12]. Alternatively, the H.E.S.S. experiment characterized the observed energy spectrum by , with the index and the exponential cutoff energy TeV between 440 GeV and 40 TeV [6]. At sub-PeV energies between 141 TeV and 646 TeV, the CASA-MIA experiment had set stringent flux upper limits by an air shower (AS) array and the underground muon detector (MD) array [13].
The Tibet AS experiment achieved the first successful observation of the Crab Nebula in the multi-TeV region in 1999, using the Tibet AS array with an area of 5,175 m2 [5]. Subsequently, the Tibet-III array with an area of 22,050 m2 has been operating since 1999. With this array, we measured the energy spectrum of the Crab Nebula at energies between 1.7 and 40 TeV [14]. In 2007, a prototype underground water-Cherenkov-type MD with a detection area of 100 m2 for two cells was built beneath the Tibet-III array. By this MD, we determined the most stringent flux upper limit for Crab photons TeV [15].
Since the beginning of 2014, a water-Cherenkov-type MD array with a total area of 3,400 m2 started operation. In this Letter, we report on the photon spectrum of the Crab in the highest energy range of 3 to 400 TeV observed by the Tibet AS array with this new MD array.
II Experiment of AS and MD Arrays
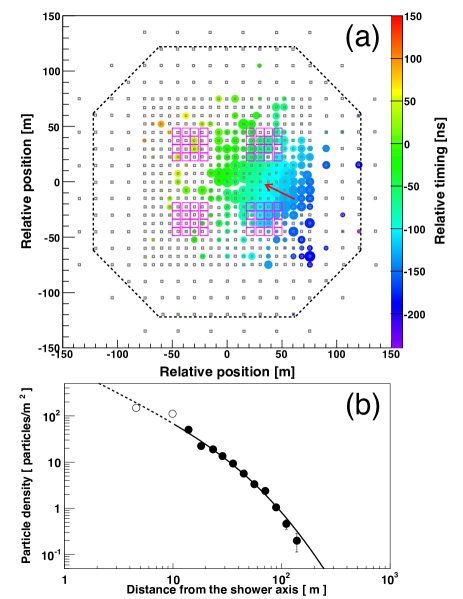
The Tibet AS array has been continuously observing very-high-energy cosmic rays above TeV at Yangbajing (90.522∘E, 30.102∘N; Altitude 4300 m) in Tibet, China [14]. The current AS array, covering an area of 65,700 m2, consists of 597 plastic scintillation detectors indicated by small dots in Fig. 1, each with 0.5 m2 detection area. This array detects the electromagnetic components in an AS, such as ’s and ’s, and each detector measures the arrival times and densities of the detected particles. With these data, the arrival direction and energy of the primary cosmic ray are then reconstructed event by event.
The Tibet MD array consists of 64 water-Cherenkov-type detectors located at 2.4 m underground beneath the AS array as shown by open squares in Fig. 1(a). Each detector is a waterproof concrete cell filled with water of 1.5 m in depth, 7.35 m 7.35 m in area, viewed by a 20-inch-diameter downward-facing photomultiplier tube (PMT) on the ceiling. The inner walls and floor are covered by white Tyvek sheets to efficiently collect water Cherenkov light produced by muons in water. The electromagnetic component is shielded by the soil overburden corresponding to 19 radiation lengths, while the energy threshold for muons to penetrate the soil is approximately 1 GeV. A primary photon induced AS produces much less muons than a primary cosmic ray induced AS does [16]. The Tibet MD array thus enables us to efficiently discriminate a cosmic-ray background event from a photon signal by means of counting muon number in an AS.
Operating these two arrays in parallel, we collected AS and muon data during 719 live days from 2014 February to 2017 May.
III Air Shower Data Analysis
The arrival direction of an AS is reconstructed using the relative timing recorded at each scintillation detector. The color and size of a circle in Fig. 1 (a) represent the relative timing () and the number of particle density () measured by each detector in a sample AS event, respectively. First, we obtain AS core location weighted by . The ’s in the AS front are fitted by a conical shape, and its cone angle is optimized by the Monte Carlo (MC) simulations depending on the AS size. The arrow head and direction indicate the reconstructed core position and incident direction of the AS, respectively. The angular resolutions (50% containment) are estimated to be approximately 0.5∘ and 0.2∘ for 10 TeV and 100 TeV photons, respectively.
The secondary particles in an AS deposit energy proportional to , in a scintillator. At each detector, is obtained from the PMT output charge divided by the single particle peak [17] which is monitored every 20 minutes to correct temperature dependence of each detector gain. For TeV, the energy of each AS is reconstructed using the lateral distribution of shown in Fig. 1 (b) by an example. As an energy estimator, we use defined as at a perpendicular distance of 50 m from the AS axis in the best-fit NKG function [18]. The conversion from to the energy is optimized as a function of zenith angle by the MC simulation. The energy resolutions with , which depend on AS core location and zenith angle (see Fig. S in the supplemental material), are roughly estimated to be 40% at 10 TeV and 20% at 100 TeV. At TeV, we estimate energy directly from , which is the sum of particle density measured by each scintillation detector, because it is difficult to apply the NKG fitting due to a limited number of hit detectors. The energy resolution with is estimated to be 100% at 3 TeV. The absolute energy scale uncertainty was estimated to be 12% from the westward shift of the Moon’s shadow center caused by the geomagnetic field [14].
Muons and a part of hadronic components in an AS penetrate into the underground MD array, while the electromagnetic cascade rapidly attenuates in the soil above. The number of muons detected in an MD () is obtained from the output charge divided by the single muon peak which is monitored every 20 minutes. The sum of detected particles in all 64 MDs (i.e. ) is taken as the parameter to distinguish photons from cosmic rays that generate ASs.
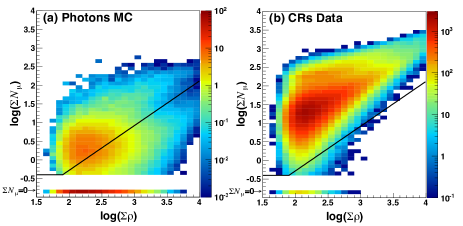
The trigger condition of an AS is issued at any 4-fold coincidence of scintillation detectors within the area enclosed by the dashed lines in Fig. 1, each recording more than 0.6 particles. The AS event selections and energy estimation below 10 TeV are carried out in the same way as our previous works [14] except for the muon cut. At TeV, the following event selection criteria are imposed to ensure better energy resolution: (1) zenith angle of arrival direction () is ; (2) number of available detectors for the AS reconstruction is ; (3) among 6 detectors recording the largest values, 5 are contained in the fiducial area enclosed by the dashed lines in Fig. 1; (4) log() is ; (5) age parameter () in the best-fit NKG function is between 0.3 and 1.3. (6) or as indicated by solid lines in Fig. 2. This muon cut condition is optimized by the MC simulations for the observation of the photon induced ASs (see next section).
In order to estimate the background contribution from cosmic rays, we adopt the Equi-Zenith Angle method which was used in our previous works [19, 14]. The number of cosmic-ray background events is estimated from the number of events averaged over 20 off-source windows located at the same zenith angle as the on-source window (but at different azimuth angle). The radius of the on/off-source window is set to (∘) [19]. In order to efficiently extract signals in the higher energy region at low background level, the lower limit of is set to 0.5∘, corresponding to 90% containment of photons with TeV.
IV MC Simulations
We simulate AS events in the atmosphere, using the CORSIKA code v7.4000 [20] with EPOS-LHC [21] for the high-energy hadronic interaction model and FLUKA code v2011.2b [22, 23] for the low-energy hadronic interaction model. The differential power-law index of photon spectrum takes to be above 0.3 TeV. The AS cores are located randomly within 300 m from the AS array center. The generated secondary particles in an AS are fed into the detector simulation of the AS array developed by using the GEANT4 code v4.10.00 [24]. The energy deposit and timing at each scintillation detector are converted to measurable charge and timing values considering the detector response and the calibrations. The simulated dataset is analyzed in the same way as the experimental data to reconstruct the energy and arrival direction of the primary cosmic rays that initiate ASs. We verified that our MC simulations reproduce the experimental AS data very well, regarding the cosmic-ray spectrum and zenith angle distribution as well as the air shower reconstruction (angular resolution, pointing accuracy, and absolute energy scale) determined from the Moon’s shadow analysis [19, 14].
The basic idea and the detailed study on the MC simulation of the underground MD array are described in [25]. The electromagnetic and hadronic cascades in the overburden soil, as well as the ray tracing of Cherenkov lights emitted in the water cell are simulated by the GEANT4 code. The number of photoelectrons detected in all MDs is converted to in the same way as the experimental data.
The muon cut condition described in the preceding section is optimized using the MC events of primary photons and real cosmic-ray data extracted from the same declination band as the Crab, but outside the Crab region, because distribution induced by the cosmic ray might depend on the hadronic interaction and chemical composition models assumed in the MC simulation. Figure 2 (a) and (b) show as a function of for photon signals generated by the MC simulation, and the real cosmic-ray background events, respectively. The absolute photon flux of the Crab is assumed in the photon MC simulation. The muon cut indicated by the solid lines in Fig. 2 is determined to maximize the figure of merit , where and denote the expected number of photons by the MC simulation and the number of background events in the data after the muon cut. The events remaining after the muon cut are regarded as the photon-like events. It is noted that the electron/photon discrimination is very difficult so far, because both electron and photon induced air showers consist of similar electromagnetic component. However, the expected ratio of electrons to cosmic rays at 10 TeV is estimated to be less than 0.1%, because of a steeper power-law index of the electron spectrum above 1 TeV. Furthermore, the diffuse electrons should be subtracted as isotropic background events by the Equi-Zenith Angle method.
V Results and Discussion
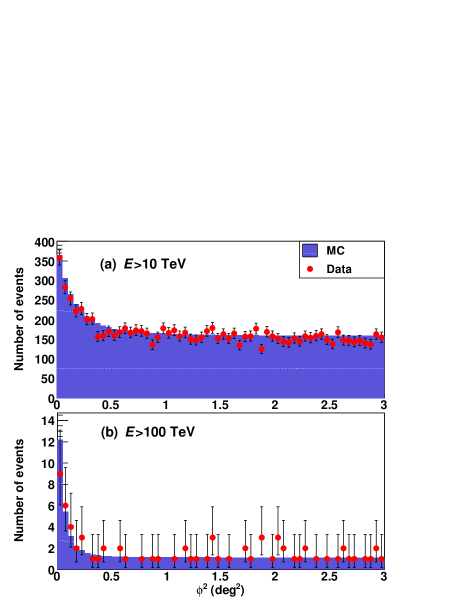
The cosmic-ray background events are reduced to 1.1% above 10 TeV with 70% of the photons remaining after the muon cut. We detected a clear excess from the Crab with 18.3 statistical significance. Figure 3 shows a distribution of events, where denotes incident angle measured from the Crab direction for (a) TeV and (b) TeV, respectively. The simulated distributions assuming a point source (blue shaded histograms) well reproduce the experimental data (red solid circles). The 2D photon images are available in Fig. S in the supplemental material.
With TeV, the cosmic-ray background events are significantly excluded by the muon cut down to 0.08% with 90% of the photons remaining. As a result, we detected 24 photon-like events with TeV against 5.5 cosmic-ray background events (the excess is 18.5 events), corresponding to 5.6 statistical significance, where the parameter used for calculating the Li-Ma significance is 0.05 (see Eq. of [26]).
The contamination from the lower energies below 100 TeV due to the finite energy resolution is estimated to be 3 events. The observed muon distribution for TeV after the muon cut is consistent with that estimated by the photon MC simulation as shown in Fig. S in the supplemental material.
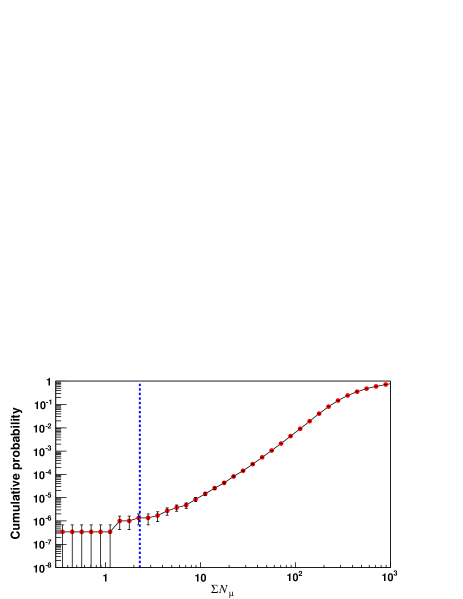
Figure 1 (a) and (b) show the event display and the lateral distribution, respectively, of a typical photon-like event observed with TeV. The total uncertainty of the energy, , is defined as the quadratic sum of the absolute energy-scale error (12%) [14] and the energy resolution which is estimated by using events of MC simulations with the same and core distance from the AS array center (), and is estimated to be TeV for this 251 TeV photon-like event. The MD array recorded only for this event, while the average of the cosmic-ray background events with similar energy is approximately 500. In order to evaluate the probability of such a low event, we examine the distribution in the real cosmic-ray events. Figure 4 shows the cumulative probability of with cosmic-ray events above 251 TeV, which are recorded with the similar and as the 251 TeV photon-like event. We estimate the chance probability of cosmic-ray event with to be , and the number of background events from the Crab without the muon cut is events above 251 TeV. Therefore, the probability of misidentifying a cosmic-ray event from the Crab as the observed 251 TeV photon-like event is calculated to be . Above 250 TeV, we found 4 photon-like events against 0.8 cosmic-ray background events corresponding to 2.4 statistical significance. The contamination from the lower energies below 250 TeV due to the finite energy resolution is estimated to be 0.4 events. The ’s and other parameters of these four events are summarized in Table 1. The ’s in Table 1 indicate that 3 events are highly photon-like, while the highest energy event is a borderline photon-like event which is consistent with cosmic-ray background event with a probability of 0.23.
| (TeV) | (TeV) | (∘) | (m) | (deg2) | |||
|---|---|---|---|---|---|---|---|
| 251 | 3248 | 2.3 | 29.8 | 35.1 | 0.00 | ||
| 313 | 2440 | 5.5 | 27.5 | 94.6 | 0.03 | ||
| 449 | 2307 | 11.3 | 35.4 | 93.3 | 0.12 | ||
| 458 | 2211 | 21.5 | 27.5 | 111.6 | 0.18 | 0.23 |
Finally, Fig. 5 shows the differential energy spectrum of Crab photons. The red solid circles indicate the energy spectrum measured by the Tibet AS+MD array, featuring by a single power law of in the energy range between 3 and 400 TeV. The unfolding procedure of the spectrum is basically the same as employed in the previous works [14], while the energy resolutions are improved at higher energies. The energy bin purities evaluated from the smearing by the energy resolution is estimated to be 83% (86%) for TeV ( TeV). In each bin, spillover fraction from lower and higher energy bins are 14% (12%) and 3% (2%), respectively, for TeV ( TeV). We found no clear evidence for the exponential cutoff below 100 TeV. The spectrum measured by the Tibet-III array up to 40 TeV [14] is shown by the red open circles. Both spectra are mutually consistent with each other in the overlapping energy range within statistical errors. The H.E.S.S. experiment measured spectra in 2003-2005 [6] and 2013 during the gamma-ray flare periods detected by -LAT [27]. The former appears to favor an exponential cutoff shape, while the latter seems to extend the power-law trend. The spectrum measured by the Tibet AS+MD well follows the data of the HEGRA experiment, and extends to the sub-PeV energy regime without cutoff sign. The integral fluxes observed by the Tibet AS+MD array are also calculated to be and , respectively, which are consistent with and lower than the previous upper limits given by the CASA-MIA experiment [13] and Tibet AS with 100 m2 prototype MD [15], respectively.
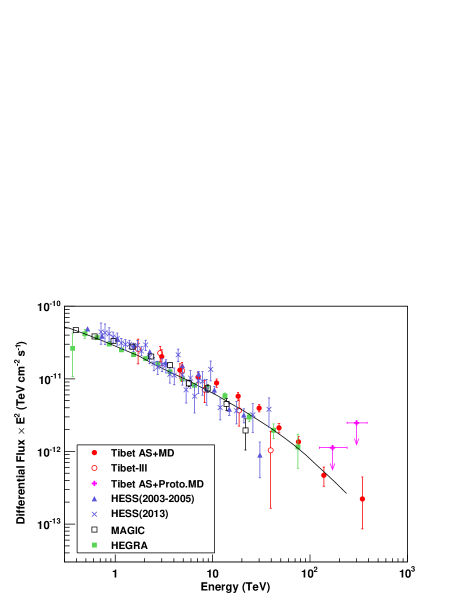
The emission mechanism for the multi-TeV photons from the Crab is thought to be the inverse-Compton (IC) scattering of ambient seed photons by relativistic electrons [29]. The model energy spectra have been calculated based on the IC scattering of various seed photons, such as the synchrotron emission, far-infrared, cosmic microwave background (CMB) radiation, and so on. The solid curve in Fig. 5 is the best-fit model for the HEGRA data [12]. Our spectrum above 100 TeV is consistent with the simple extrapolation up to a few hundred TeV of the HEGRA spectrum by the IC model. The origin of the photons exceeding 100 TeV might be sub-PeV electrons scattering off the low-energy CMB photons in the Crab Nebula. Such ultra-high energy electrons and positrons can be produced and sustained by forward and reverse magnetohydrodynamic shocks in inhomogeneous, magnetically striped, relativistic Crab pulsar wind mainly composed of electrons and positrons by number [30, 31].
VI Conclusions
We successfully observed 24 photon-like events with TeV from the Crab Nebula against 5.5 cosmic-ray background events, corresponding to 5.6 statistical significance, with the Tibet AS array and the underground water-Cherenkov-type MD array. This is the first detection of the highest energy photons beyond 100 TeV from an astrophysical source, and thus opens up the sub-PeV window in astronomy.
Acknowledgements.
The collaborative experiment of the Tibet Air Shower Arrays has been conducted under the auspices of the Ministry of Science and Technology of China and the Ministry of Foreign Affairs of Japan. This work was supported in part by a Grant-in-Aid for Scientific Research on Priority Areas from the Ministry of Education, Culture, Sports, Science, and Technology, by Grants-in-Aid for Science Research from the Japan Society for the Promotion of Science in Japan. This work is supported by the National Key R&D Program of China (No.2016YFE0125500). This work is supported by the Grants from the National Natural Science Foundation of China (Nos.11533007,11673041,11873065 and 11773019), and by the Key Laboratory of Particle Astrophysics, Institute of High Energy Physics, CAS. This work is supported by the Chinese Ministry of Education. This work is supported by the joint research program of the Institute for Cosmic Ray Research (ICRR), the University of Tokyo.Corresponding authors:
∗ kawata@icrr.u-tokyo.ac.jp
† chenxu@ihep.ac.cn
‡ takita@icrr.u-tokyo.ac.jp
§ huangjing@ihep.ac.cn
References
- Y.-Q. Lou [1993] Y.-Q. Lou, Astrophys. J. 414, 656 (1993).
- T. C. Weekes et al. [1989] T. C. Weekes et al., Astrophys. J. 342, 379 (1989).
- A. Konopelko et al. [1996] A. Konopelko et al., Astropart. Phys. 4, 199 (1996).
- T. Tanimori et al. [1998] T. Tanimori et al., Astrophys. J. 492, 33 (1998).
- M. Amenomori et al. [1999] M. Amenomori et al., Astrophys. J. 525, L93 (1999).
- F. Aharonian et al. [2006] F. Aharonian et al., Astron. & Astrophys. 457, 899 (2006).
- J. Albert et al. [2008] J. Albert et al., Astrophys. J. 674, 1037 (2008).
- A. A. Abdo et al. [2012] A. A. Abdo et al., Astrophys. J. 750, 63 (2012).
- B. Bartoli et al. [2013] B. Bartoli et al., Astrophys. J. 779, 27 (2013).
- E. Aliu et al. [2014] E. Aliu et al., Astrophys. J. 781, 11 (2014).
- A. U. Abeysekara et al. [2017] A. U. Abeysekara et al., Astrophys. J. 843, 39 (2017).
- F. Aharonian et al. [2004] F. Aharonian et al., Astrophys. J. 614, 897 (2004).
- A. Borione et al. [1997] A. Borione et al., Astrophys. J. 481, 313 (1997).
- M. Amenomori et al. [2009] M. Amenomori et al., Astrophys. J. 692, 61 (2009).
- M. Amenomori et al. [2015] M. Amenomori et al., Astrophys. J. 813, 98 (2015).
- T. K. Gaisser, T. Stanev, F. Halzen, W. F. Long and E. Zas [1991] T. K. Gaisser, T. Stanev, F. Halzen, W. F. Long and E. Zas, Physical Review D 43, 314 (1991).
- M. Amenomori et al. [2008] M. Amenomori et al., Astrophys. J. 678, 1165 (2008).
- K. Kawata, T. K. Sako, M. Ohnishi, M. Takita, Nakamura and K. Munakata [2017] K. Kawata, T. K. Sako, M. Ohnishi, M. Takita, Nakamura and K. Munakata, Exp. Astron. 44, 1 (2017).
- M. Amenomori et al. [2003] M. Amenomori et al., Astrophys. J. 598, 242 (2003).
- D. Heck, J. Knapp, J. N. Capdevielle, G. Shatz and T. Thouw [1998] D. Heck, J. Knapp, J. N. Capdevielle, G. Shatz and T. Thouw, CORSIKA: A Monte Carlo Code to Simulate Extensive Air Showers (FZKA 6019)(Karlsruhe: Forschungszentrum Karlsruhe) (1998).
- T. Pierog, Iu Karpenko, J. M. Katzy, E. Yatsenko and K. Werner [2015] T. Pierog, Iu Karpenko, J. M. Katzy, E. Yatsenko and K. Werner, Physical Review C 92, 034906 (2015).
- A. Ferrari, P. R. Sala, A. Fassò and J. Ranft [2005] A. Ferrari, P. R. Sala, A. Fassò and J. Ranft, FLUKA: a multi-particle transport colde, CERN-2005-10, INFN/TC_05/11, SLAC-R-773 (2005).
- T. T. Böhflen et al. [2014] T. T. Böhflen et al., Nuclear Data Sheets 120, 211 (2014).
- S. Agostinelli et al. [2003] S. Agostinelli et al., Nucl. Instrum. Methods Phys. Res. A 506, 250 (2003).
- T. K. Sako a, K. Kawata, M. Ohnishi, A. Shiomi, M. Takita and H. Tsuchiya [2009] T. K. Sako a, K. Kawata, M. Ohnishi, A. Shiomi, M. Takita and H. Tsuchiya, Astropart. Phys. 32, 177 (2009).
- T.-P. Li and Y.-Q. Ma [1983] T.-P. Li and Y.-Q. Ma, Astrophys. J. 272, 317 (1983).
- A. Abramowski et al. [2014] A. Abramowski et al., Astron. & Astrophys. 562, L4 (2014).
- J. Aleksić et al. [2015] J. Aleksić et al., J. of High Energy Astrophys. 5, 30 (2015).
- A. M. Atoyan and F. A. Aharonian [1996] A. M. Atoyan and F. A. Aharonian, Astron. & Astrophys. Suppl. Ser. 120, 453 (1996).
- Y.-Q. Lou [1996] Y.-Q. Lou, Mon. Not. Roy. Astron. Soc. 279, 129 (1996).
- Y.-Q. Lou [1998] Y.-Q. Lou, Mon. Not. Roy. Astron. Soc. 294, 443 (1998).