Enhanced spin state readout of Nitrogen-Vacancy centers in a diamond using IR fluorescence
Abstract
Nitrogen-Vacancy (NV) centers in diamond have been used in recent years for a wide range of applications, from nano-scale NMR to quantum computation. These applications depend strongly on the efficient readout of the NV center’s spin state, which is currently limited. Here we suggest a method of reading the NV center’s spin state, using the weak optical transition in the singlet manifold. We numerically calculate the number of photons collected from each spin state using this technique, and show that an order of magnitude enhancement in spin readout signal-to-noise ratio is expected, making single-shot spin readout within reach. Thus, this method could lead to an order of magnitude enhancement in sensitivity for ubiquitous NV based sensing applications, and remove a major obstacle from using NVs for quantum information processing.
Effective quantum state readout is a crucial component of almost every quantum computation or sensing device, and extensive research in a variety of fields is directed at improving quantum state measurements and increasing readout fidelity Reed et al. (2010); Myerson et al. (2008); Steiner et al. (2010); Morello et al. (2010). The Nitrogen-Vacancy (NV) color center in diamond is a promising system for various quantum based applications, such as quantum computation Fuchs et al. (2011) and sensitive measurements Clevenson et al. (2015); Acosta et al. (2010a); Dolde et al. (2011); Taylor et al. (2008); Loretz et al. (2014); Trusheim and Englund (2016), due to its unique optical and spin properties. Nevertheless, a fast and high fidelity spin state readout for the NV center is currently missing, and although extensive efforts have been invested in this context Wolf et al. (2015); Steiner et al. (2010); Shields et al. (2015); Robledo et al. (2011); Hopper et al. (2016), many repetitions of each measurement, cold temperatures or long measurement times are still needed for each experiment.
This work presents a novel approach for reading the NV’s spin state, based on fluorescence measurements of the singlet infrared (IR) transition. We first recalculate the standard red fluorescence based spin state readout with recently published ionization and recombination rates of NV- and NV0 Meirzada et al. (2018). Next, we detail our proposed method of reading the NV center’s spin state, using the weak fluorescence emitted in the singlet manifold, and calculate the expected signal-to-noise ratio (SNR) by numerically solving the relevant rate equations, for both surface and bulk NVs. From these results, we find a regime of excitation parameters for which a significant increase in the NV’s spin state readout SNR is expected. Finally, we suggest using a photonic crystal cavity to increase the radiative coupling of the singlet transition, and present the quality and Purcell factors, as well as the SNR expected using these structures coupled to a nanodiamond, a diamond membrane and bulk diamond.
The negatively charged NV center consists of 2 adjacent lattice sites occupied by a nitrogen atom and a vacancy inside a diamond crystal. The electronic ground state of the NV center is a spin triplet with a 2.87 GHz zero-field splitting between spin projections and . The electronic excited states contain a spin triplet with a strong radiative coupling and a spin singlet with a much weaker radiative coupling.
Figure 1 depicts a simplified energy level diagram of NV- and NV0, together with their main transitions. In the standard red fluorescence spin readout scheme, an NV in the triplet ground state () is excited to the triplet excited state () using green light, and the red fluorescence during the decay back to the ground state is collected. The number of photons collected from each of the spin states dictates the SNR, which is defined under the shot noise limit assumption as:
| (1) |
where denotes the number of photons collected when the NV is initialized to its state, where can be 0 or 1.
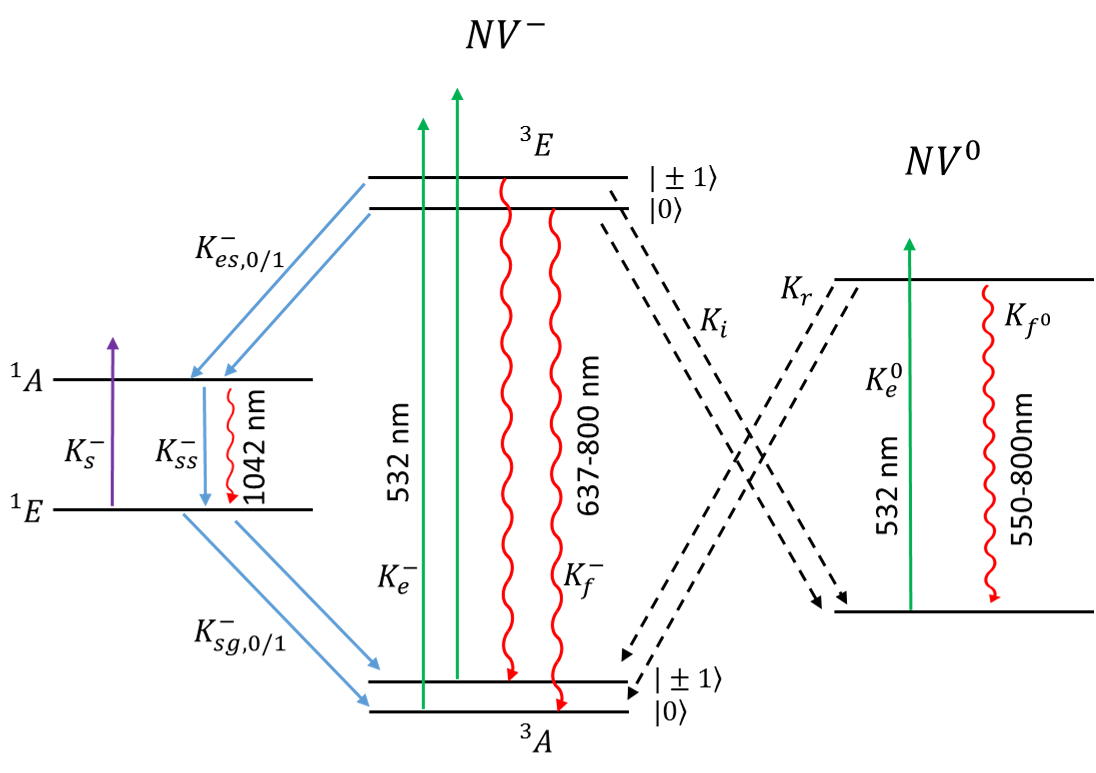
We first calculate the spin readout SNR using green excitation and red fluorescence detection, as a function of readout duration and excitation power for a confocal system, for both surface and bulk NVs, assuming perfect collection and detection efficiencies. In addition, fluorescence from NV0 is ignored, although it overlaps to some extent with the NV- fluorescence. The SNR is calculated numerically, using an 8 level model (based on the levels depicted in Fig. 1), over a wide range of parameters. The rate equations dictating the populations for Fig. 2, as well as for Fig. 3, are the following:
In the above equations and represent the population in the and triplet ground states of the negatively charged NV respectively, and represent the population in the and triplet excited states of the negatively charged NV respectively, and represent the populations of the neutral charge NV ground and excited states respectively, and and represent the populations in the ground and excited singlet states of the negatively charged NV respectively. and represent the green laser induced excitation rates of NV- and NV0 ground states to the excited states respectively, represents the IR laser induced excitation rate from the ground singlet state to the excited singlet state, and represent the fluorescence rate from the NV- and NV0 excited states to their ground states respectively, represents the decay rate of the excited singlet state to the ground singlet state, and represent the decay rates from the triplet excited states to the excited singlet state, respectively, and represent the decay rates from the ground singlet state to the NV- and triplet ground states respectively, and represent the green and IR excitation induced ionization rates respectively, and and represent the green and IR excitation induced recombination rates respectively (see Meirzada et al. (2018)).
Figure 2 illustrates the achievable red fluorescence spin readout SNR, assuming 100% collection and perfect detection without external noise sources (such as dark counts). Figures (a) and (b) depict the absolute SNR, described in Eq. 1, over a wide range of green excitation powers and readout durations. Figures (c) and (d) present the SNR for the same power and duration regimes normalized by the square root of the pulse duration in . The significant difference in SNR between bulk and surface NVs stems from differences in ionization cross section of the level.
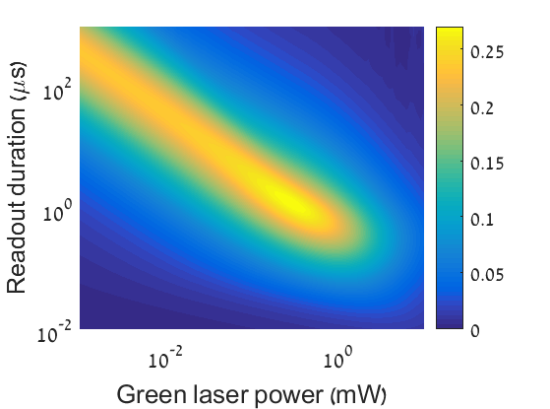
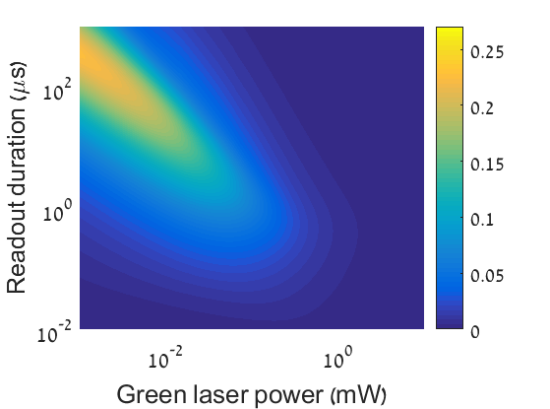
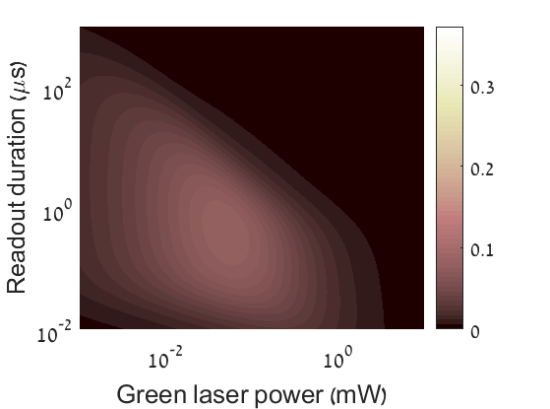
With the optimal parameters, the SNR rises slightly above 0.25 for bulk NVs and 0.22 for surface NVs. Thus, the red fluorescence spin readout demands a very high number of iterations before the spin state can be determined, even with perfect collection and detection, which limits the sensitivity and fidelity in NV based sensing and quantum information applications.
We now detail the IR fluorescence based spin readout scheme. The pulsed sequence, depicted in Fig. 3(a), starts with a short and strong green excitation, populating the singlet ground state (). Next, a short delay (represented by ) is introduced in order to avoid undesired ionization from the excited triplet state, followed by a strong and long 980 nm pulse that excites the NV from the ground singlet state () to the singlet excited state () while collecting the emitted 1042 nm fluorescence. Due to the fact that the IR laser does not excite the triplet ground state, no mixing processes are expected, enabling a relatively long measurement. By carefully tuning the green laser pulse power and duration, the sequence can be repeated 3 times before significant mixing (via the singlet manifold or ionization/recombination processes) takes place, thus enhancing the signal.
Despite the poor radiative coupling between the and levels, the fast decay rate from the state Ulbricht and Loh (2018) together with the relatively long shelving time in the state Acosta et al. (2010b), enable a large number of cycles before the NV decays back to the ground state without risking photo-ionization, allowing for a large enough number of photons to be collected during a single measurement, for high enough excitation powers.
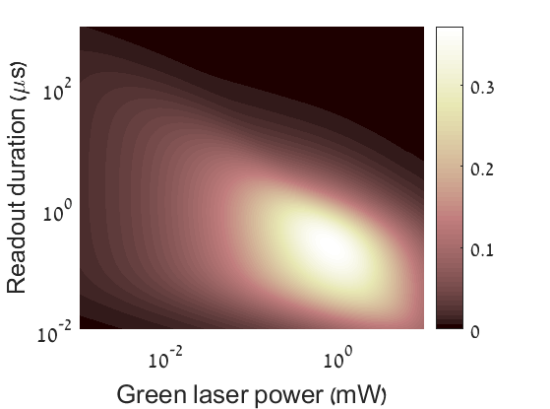
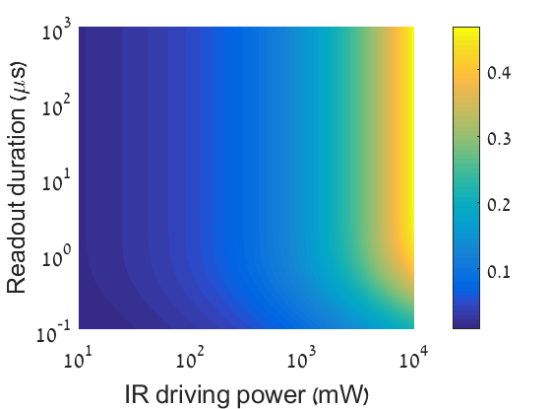
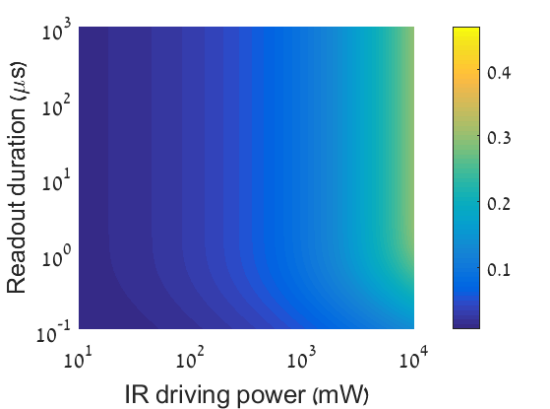
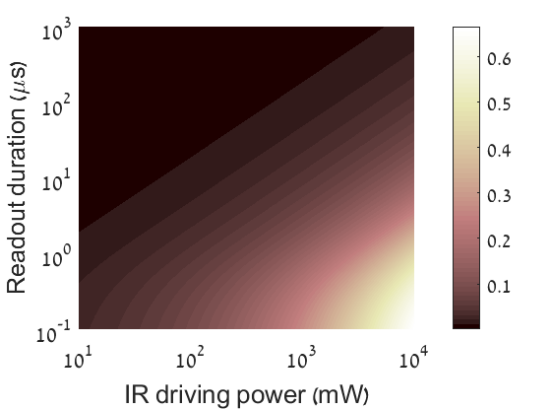
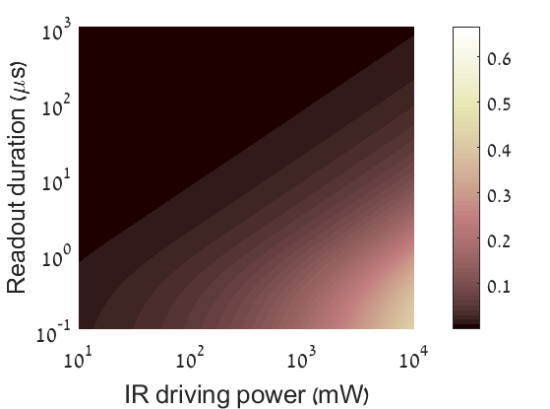
Figure 3 depicts the IR fluorescence spin readout SNR as a function of IR laser power and pulse duration of bulk and surface NVs, with delay duration = 10 ns (optimized with respect to the excited state lifetime). The laser power and pulse duration are scaled logarithmically in order to cover all of the relevant parameter space. Perfect collection and detection efficiencies are assumed for comparison with the results shown in Fig. 2. We neglect IR induced ionization from the singlet state, for which the cross section is currently unknown (but assumed to be small), and consider a radiative to non-radiative coupling ratio of Acosta et al. (2010b). Figures 3(b) and 3(c) present the calculated absolute SNR for bulk and surface NVs, showing an expected significant enhancement of the spin state readout SNR compared to the red fluorescence spin readout scheme for high enough IR power. In addition, in this scheme the SNR grows monotonically with readout duration due to the absence of spin mixing. Figures 3(d) and 3(e) present the calculated normalized SNR for bulk and surface NVs for the IR fluorescence method, showing that the normalized SNR can reach higher values than that of the red fluorescence spin readout SNR for bulk and surface NVs, for strong excitation powers.

To further improve the spin readout SNR shown in Fig. 3, while reducing the necessary IR excitation power, we need to overcome the weak fluorescence signal resulting from the non-radiative nature of the decay. Thus, we propose using optical/plasmonic antennas, hyperbolic-metamaterials (HMM) Wolf et al. (2015); Livneh et al. (2011); Harats et al. (2014) or a photonic crystal cavity Wan et al. (2018); Mouradian et al. (2017) to strengthen the radiative coupling between the and states and thus increase the singlet fluorescence signal.
Photonic crystal structures with small mode volumes () and high quality factors (high frequency-to-bandwidth ratio in the resonator Haroche and Kleppner (1989)) are now within reach Wan et al. (2018); Mouradian et al. (2017), and together with the relatively narrow IR fluorescence spectral width are expected to provide high Purcell factors, especially for nanodiamonds and diamond films, but also potentially for bulk diamonds.
The Purcell factor, an enhancement of the spontaneous emission rate from the excited state due to radiative coupling Haroche and Kleppner (1989), depends on the quality factor and mode volume in the following way:
| (2) |
where represents the wavelength, represents and quality factor, represents the refractive index and V represents the mode volume. In terms of the rate equations, the radiative part of the decay rate is multiplied by the Purcell factor. The fact that only approximately 0.1% of the decay results in photon emission, holds great potential for enhancing the signal level and thus the SNR. In addition, the high emission directionality induced by a photonic crystal structure may dramatically increase the collection efficiency, and thus the number of photons detected.
Figure 5(a) describes schematically the suggested experimental system. Green and detuned IR lasers excite the triplet () and singlet () ground states, respectively, while Acousto-Optic Modulators (AOMs) modulate them. Two dichroic mirrors with proper cutoff wavelengths (533 nm - 979 nm and 981 nm - 1041 nm for the green and IR lasers, respectively) direct the lasers onto the objective and enable fluorescence collection on a single-photon counter module (SPCM), after the unwanted red fluorescence and reflected green and IR lasers are filtered out. The objective focuses the light onto the diamond sample, here illustrated as a nanodiamond, to reach the high intensity IR excitation needed for driving the singlet transition efficiently. Figures 4.b and 4.c illustrate the electric field’s near-field and far-field energy densities, as well as the photonic crystal cavity structure, optimized for nanodiamonds. The cavity structure is a 250 nm thick Silicone-Nitride hexagonal PHC L3 cavity with five neighbouring hole positions shifted, as described in Minkov and Savona (2014). For this structure, the refractive index is 2, the lattice constant, , is 450 nm and hole radius is 125 nm, and the positions of the holes were shifted by , , , and . The far-field energy density enables approximately 45% collection efficiency with numerical aperture of 0.95, while the near-field simulations predict a quality factor of about 2650 for this structure. Considering the small mode volume of this structure, , the resulting Purcell factor according to Eq. 2, which is manifested by in Fig. 1, can reach up to 2343, and thus significantly enhance the emission and the number of photons collected. Similar calculations for diamond membranes and bulk diamonds predict quality factors of up to 13,300 and 790 with mode volumes of and , respectively, resulting in Purcell factors of up to 8355 for diamond membranes and 235 for bulk diamonds (see supplemental material).
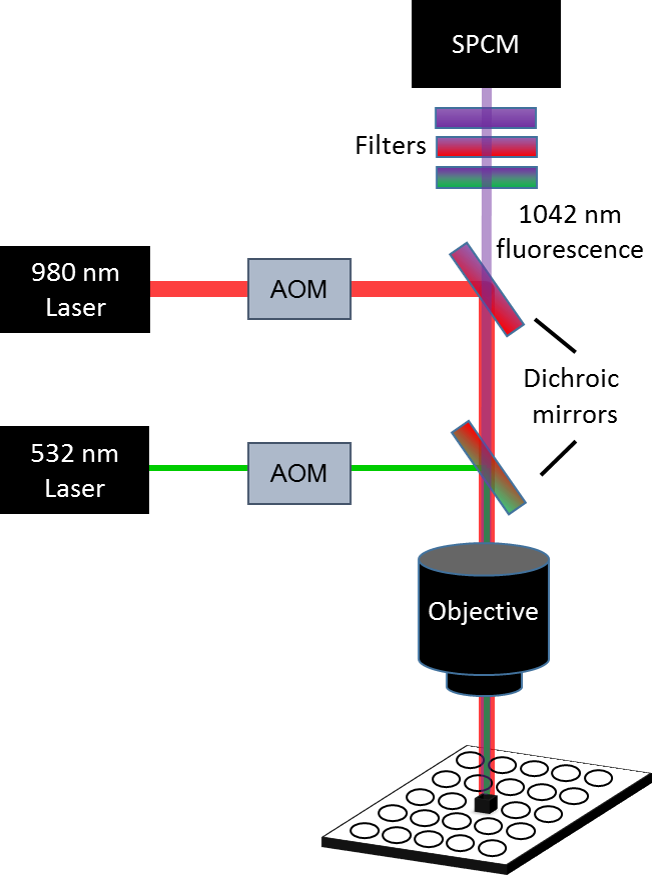
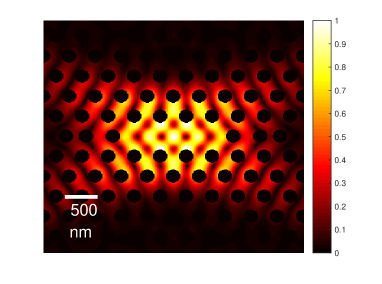
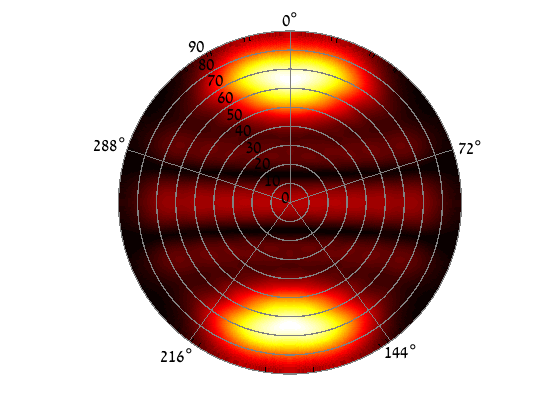
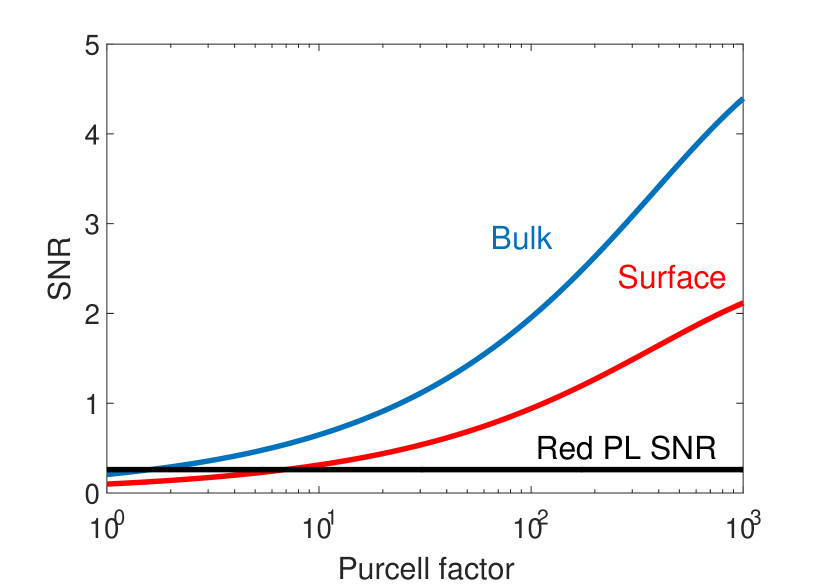
Figure 5 illustrates the expected spin readout SNR under 1W of IR excitation (inside the cavity) and a short readout duration (1 ), as a function of Purcell factor for both surface (red line) and bulk (blue line) NVs. For this calculation, the Purcell factor was manifested by the radiative part of the rate in Fig. 1. Based on the figure, the new scheme provides a 5 fold enhancement of the spin readout SNR for a feasible Purcell factor of 40, which was already achieved for Silicon-Vacancy centers Zhang et al. (2018), and more than an order of magnitude enhancement for and (which are significantly lower than the Purcell factors calculated for nano-diamonds and diamond membranes) for bulk and surface NVs, respectively, thus exceeding the single-shot readout threshold. The SNR can reach even higher values for readout duration 1 and higher excitation powers, as shown in the supplemental material. Thus, the magnetic field sensitivity, which obeys the following relation Taylor et al. (2008); Pham (2013):
| (3) |
could be reduced by more than an order of magnitude as well.
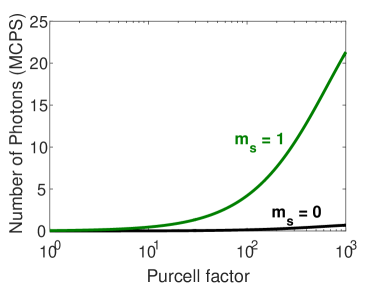
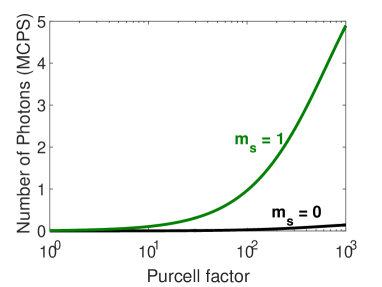
Figures 5(b) and 5(c) present a calculation of the number of photons emitted from the and spin states as a function of Purcell factor for the same excitation power during the 1 readout duration, showing that a higher number of photons is expected to be emitted during the readout sequence, while the contrast between the two spin states is sustained.
In this work we presented a new spin state readout scheme, based on the IR fluorescence emitted from the singlet manifold following IR excitation from the singlet ground state. Using numerical calculations, we showed that this scheme results in more than two orders of magnitude enhancement of the spin readout SNR compared to the commonly used red fluorescence spin readout scheme. The NV center’s singlet states were hardly addressed in NV center research Acosta et al. (2010b); Kehayias et al. (2013), and so far few references described applications based on singlet excitation (Dumeige et al. (2013); Shields et al. (2015)). Our readout method complements the absorption based magnetometry presented in Dumeige et al. (2013), as it generalizes it using the transitions for low concentrations of defects, enabling this transition to be used in a wider range of applications based on single or few NVs as well as for high density samples. Compared to other spin readout methods presented in recent years - spin-to-charge readout Shields et al. (2015); Hopper et al. (2016), nuclear spin coupling Steiner et al. (2010), and resonant excitation(Robledo et al. (2011) - our scheme could provide advantages in terms of measurement duration and the conditions required (1 s readout in room temperature vs. 100 ms readout or ultra-cold systems). The significant SNR enhancement is expected to have a dramatic effect on nearly every NV based application currently pursued: the fact that only a few repetitions are needed (instead of the usual tens of thousands) will result in significantly improved sensitivities in magnetometry and strain sensing, as they are measured with respect to experiment duration. In addition, the enhanced SNR may remove a major obstacle in using NVs for quantum information processing, due to the importance of readout fidelity in this field. We are currently realizing this scheme experimentally, aiming to demonstrate enhanced spin readout SNR and improved magnetic field sensitivity.
References
- Reed et al. (2010) M. D. Reed, L. DiCarlo, B. R. Johnson, L. Sun, D. I. Schuster, L. Frunzio, and R. J. Schoelkopf, Physical Review Letters 105 (2010), 10.1103/PhysRevLett.105.173601.
- Myerson et al. (2008) A. H. Myerson, D. J. Szwer, S. C. Webster, D. T. C. Allcock, M. J. Curtis, G. Imreh, J. A. Sherman, D. N. Stacey, A. M. Steane, and D. M. Lucas, Physical Review Letters 100 (2008), 10.1103/PhysRevLett.100.200502.
- Steiner et al. (2010) M. Steiner, P. Neumann, J. Beck, F. Jelezko, and J. Wrachtrup, Physical Review B 81 (2010), 10.1103/PhysRevB.81.035205.
- Morello et al. (2010) A. Morello, J. J. Pla, F. A. Zwanenburg, K. W. Chan, K. Y. Tan, H. Huebl, M. Möttönen, C. D. Nugroho, C. Yang, J. A. van Donkelaar, A. D. C. Alves, D. N. Jamieson, C. C. Escott, L. C. L. Hollenberg, R. G. Clark, and A. S. Dzurak, Nature 467, 687 (2010).
- Fuchs et al. (2011) G. D. Fuchs, G. Burkard, P. V. Klimov, and D. D. Awschalom, Nature Physics 7, 789 (2011).
- Clevenson et al. (2015) H. Clevenson, M. E. Trusheim, C. Teale, T. Schröder, D. Braje, and D. Englund, Nature Physics 11, 393 (2015).
- Acosta et al. (2010a) V. M. Acosta, E. Bauch, A. Jarmola, L. J. Zipp, M. P. Ledbetter, and D. Budker, Applied Physics Letters 97, 174104 (2010a).
- Dolde et al. (2011) F. Dolde, H. Fedder, M. W. Doherty, T. Nöbauer, F. Rempp, G. Balasubramanian, T. Wolf, F. Reinhard, L. C. L. Hollenberg, F. Jelezko, and J. Wrachtrup, Nature Physics 7, 459 (2011).
- Taylor et al. (2008) J. M. Taylor, P. Cappellaro, L. Childress, L. Jiang, D. Budker, P. R. Hemmer, A. Yacoby, R. Walsworth, and M. D. Lukin, Nature Physics 4, 810 (2008).
- Loretz et al. (2014) M. Loretz, S. Pezzagna, J. Meijer, and C. L. Degen, Applied Physics Letters 104, 033102 (2014).
- Trusheim and Englund (2016) M. E. Trusheim and D. Englund, New Journal of Physics 18, 123023 (2016).
- Wolf et al. (2015) S. A. Wolf, I. Rosenberg, R. Rapaport, and N. Bar-Gill, Physical Review B 92 (2015), 10.1103/PhysRevB.92.235410.
- Shields et al. (2015) B. Shields, Q. Unterreithmeier, N. de Leon, H. Park, and M. Lukin, Physical Review Letters 114 (2015), 10.1103/PhysRevLett.114.136402.
- Robledo et al. (2011) L. Robledo, L. Childress, H. Bernien, B. Hensen, P. F. A. Alkemade, and R. Hanson, Nature 477, 574 (2011).
- Hopper et al. (2016) D. A. Hopper, R. R. Grote, A. L. Exarhos, and L. C. Bassett, Physical Review B 94 (2016), 10.1103/PhysRevB.94.241201.
- Meirzada et al. (2018) I. Meirzada, Y. Hovav, S. A. Wolf, and N. Bar-Gill, Phys. Rev. B 98, 245411 (2018).
- Ulbricht and Loh (2018) R. Ulbricht and Z.-H. Loh, Phys. Rev. B 98, 094309 (2018).
- Acosta et al. (2010b) V. M. Acosta, A. Jarmola, E. Bauch, and D. Budker, Physical Review B 82 (2010b), 10.1103/PhysRevB.82.201202.
- Livneh et al. (2011) N. Livneh, A. Strauss, I. Schwarz, I. Rosenberg, A. Zimran, S. Yochelis, G. Chen, U. Banin, Y. Paltiel, and R. Rapaport, Nano Letters 11, 1630 (2011).
- Harats et al. (2014) M. G. Harats, N. Livneh, G. Zaiats, S. Yochelis, Y. Paltiel, E. Lifshitz, and R. Rapaport, Nano Letters 14, 5766 (2014).
- Wan et al. (2018) N. H. Wan, S. Mouradian, and D. Englund, Applied Physics Letters 112, 141102 (2018).
- Mouradian et al. (2017) S. Mouradian, N. H. Wan, T. Schröder, and D. Englund, Applied Physics Letters 111, 021103 (2017).
- Haroche and Kleppner (1989) S. Haroche and D. Kleppner, Physics Today 42, 24 (1989).
- Minkov and Savona (2014) M. Minkov and V. Savona, Scientific Reports 4, 5124 (2014).
- Zhang et al. (2018) J. L. Zhang, S. Sun, M. J. Burek, C. Dory, Y.-K. Tzeng, K. A. Fischer, Y. Kelaita, K. G. Lagoudakis, M. Radulaski, Z.-X. Shen, N. A. Melosh, S. Chu, M. Lončar, and J. Vučković, Nano Letters 18, 1360 (2018).
- Pham (2013) L. Pham, Magnetic Field Sensing with Nitrogen-Vacancy Color Centers in Diamond., Ph.D. thesis, Harvard University (2013).
- Kehayias et al. (2013) P. Kehayias, M. W. Doherty, D. English, R. Fischer, A. Jarmola, K. Jensen, N. Leefer, P. Hemmer, N. B. Manson, and D. Budker, Phys. Rev. B 88, 165202 (2013).
- Dumeige et al. (2013) Y. Dumeige, M. Chipaux, V. Jacques, F. Treussart, J.-F. Roch, T. Debuisschert, V. M. Acosta, A. Jarmola, K. Jensen, P. Kehayias, and D. Budker, Physical Review B 87 (2013), 10.1103/PhysRevB.87.155202.