In silico evidence that protein unfolding is as a precursor of the protein aggregation
Abstract
We present a computational study on the folding and aggregation of proteins in aqueous environment, as function of its concentration. We show how the increase of the concentration of individual protein species can induce a partial unfolding of the native conformation without the occurrence of aggregates. A further increment of the protein concentration results in the complete loss of the folded structures and induces the formation of protein aggregates. We discuss the effect of the protein interface on the water fluctuations in the protein hydration shell and their relevance in the protein-protein interaction.
keywords:
Protein folding; Protein aggregation; Protein-protein interaction; Solvated proteins; Biological water; Protein design1 Introduction
Proteins cover a range of fundamental functions in the human body: i) the enzymes and hormones are proteins; ii) proteins can carry other biomolecules within the cellular environment; iii) proteins are a source of energy; iv) proteins are necessary to build and repair tissues [1]. A protein is synthesized in the ribosome and, despite the fact that the cellular environment is very crowded, it is capable to reach its native conformation (mostly dictated by the protein sequence). This process is usually spontaneous–at least for small protein–or is driven by complex interactions with other biomolecules, like the chaperones. Proteins can aggregate after they folded in the native state — through the formation of chemical bonds or self-assembling — or via unfolded intermediate conformations and their propensity to aggregate is related to a series of factors, like the flexibility of the protein structure [2] or the sub-cellular volume where the protein resides [3]. In particular, non-native protein aggregates are commonly formed through a multi-step process and are composed by native-like–partially folded intermediate structures [4, 5, 6, 7]. Inappropriate protein aggregation represents a crucial issue in biology and medicine, being associated to a growing number of diseases such as Alzheimer’s and Parkinson’s disease [8, 9, 10, 11]. In order to guarantee the correct biological functions, proteins have evolved to have a low enough propensity to aggregate within a range of protein expression required for their biological activity, but with no margin to respond to external factors increasing/decreasing their expression/solubility [12, 13, 3]. Indeed, protein aggregation is mostly unavoidable when proteins are expressed at concentrations higher than the natural ones.
The mechanisms leading to the failure of the folding process and to the formation of potentially dangerous protein aggregates are matter of large scientific debate [14], where computational tools have largely contributed to elucidate some crucial aspects. Nevertheless, to date an extensive computational study of protein aggregation with all-atom simulations including the solvent explicitly remains not practicable, making the coarse-grain approach a valid tool to rationalize those complex systems [15, 16]. In particular, lattice models have been largely exploited to address fundamental questions on protein folding and aggregation [17, 18, 19, 20, 21, 22, 23, 24, 25, 26, 27]. According to these studies, the presence of more than one chain leads to aggregate—although each protein contains a considerable fraction of native structure—with consequent loss of the funnel-like free-energy landscape [17, 19, 24].
All these studies, usually performed with a fixed sequence [17, 15] of with Go-like models [19, 20], miss the explicit contribution of water, which instead is supposed to play an important role in the protein-protein recognition and aggregation [28, 29, 30, 31, 32, 33]. Moreover, works implicitly accounting for water show that proteins with hydrophobic amino acids on the surface are prone to aggregate [25], although in nature many proteins present a considerable fraction of hydrophobic and non-polar amino acids on their native surface.
Here we present a computational study on the folding, stability and aggregation of proteins optimized according to the environment. We consider a series of native protein structures and for each we determine one or more sequences designed to make the protein fold into the aqueous environment [34]. Each sequence exhibits a different ratio between the number of hydrophilic amino acids exposed to the solvent and the number of hydrophobic amino acids buried into the core of the protein in its native conformation. For each protein, we study its capability to fold as function of its concentration. We show that the propensity to aggregate is not strictly related to the hydrophobicity of the protein surface.
2 Simulation scheme
To perform this study we adopt a coarse-grained lattice representation of proteins which is computationally affordable and has been largely adopted in leterature [35, 36, 37, 38, 39, 40, 34]. A protein is represented as a self-avoiding heteropolymer, composed by 20 amino acids, interacting each other through a nearest-neighbour potential given by the Miyazawa Jernigan interaction matrix [41, 42, 43]111The matrix has been scaled of a factor 2, increasing the effective amino acid-amino acid interaction, to account for a lower surface-volume ratio in two dimensions..
The protein is embedded in water, explicitly modeled via the many-body water model which has been proven to reproduce, at least qualitatively, the thermodynamic and dynamic behavior of water [44, 45, 46, 47, 48], including its interplay with proteins [49, 50, 39, 51, 34]. The coarse-grain representation of the water molecules, adopted to describe water at constant number of molecules , constant temperature and constant pressure , replaces the coordinates and orientations of the water molecules by a continuous density field and discrete bonding variables, respectively. The discrete variables describe the local hydrogen-bond (HB) formation and its cooperativity, leading to a local open–tetrahedral structure of the water molecules.
Since the protein is composed by hydrophilic and hydrophobic amino acids, we assume that the first interact with water decreasing the local energy, while the second affect the water–water HB in the hydration shell 222The hydration shell is defined by the water molecules which are first-neighbors of the amino acids.. In particular, we assume that i) the water–water HB at the interface are stronger than HB formed in the bulk consistent with the observation that water-water HBs in the hydration shell are more stable and more correlated with respect to the bulk HBs [52, 53, 54, 55, 56, 57]; ii) the local density fluctuations at the interface are reduced upon pressurization, as observed in [58, 59, 60, 61].
Protein Protein Protein

Protein Protein Protein
Protein Protein
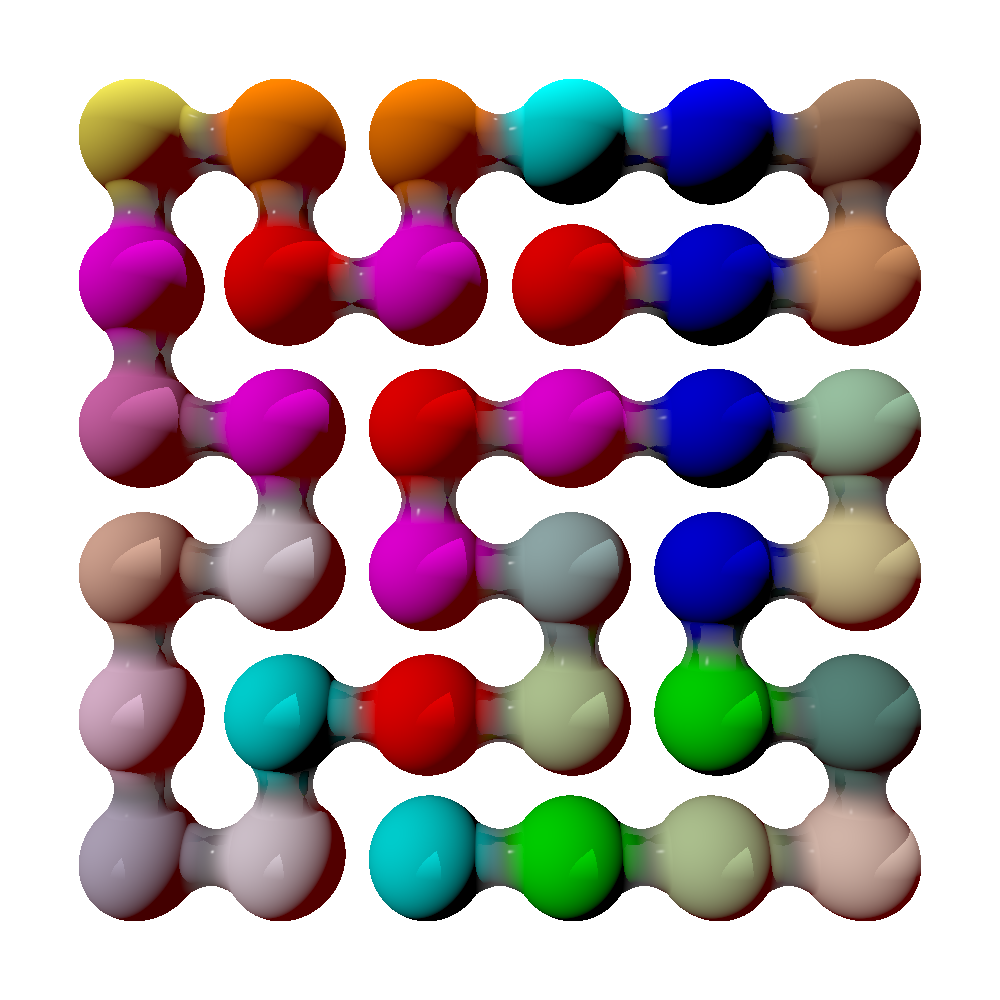
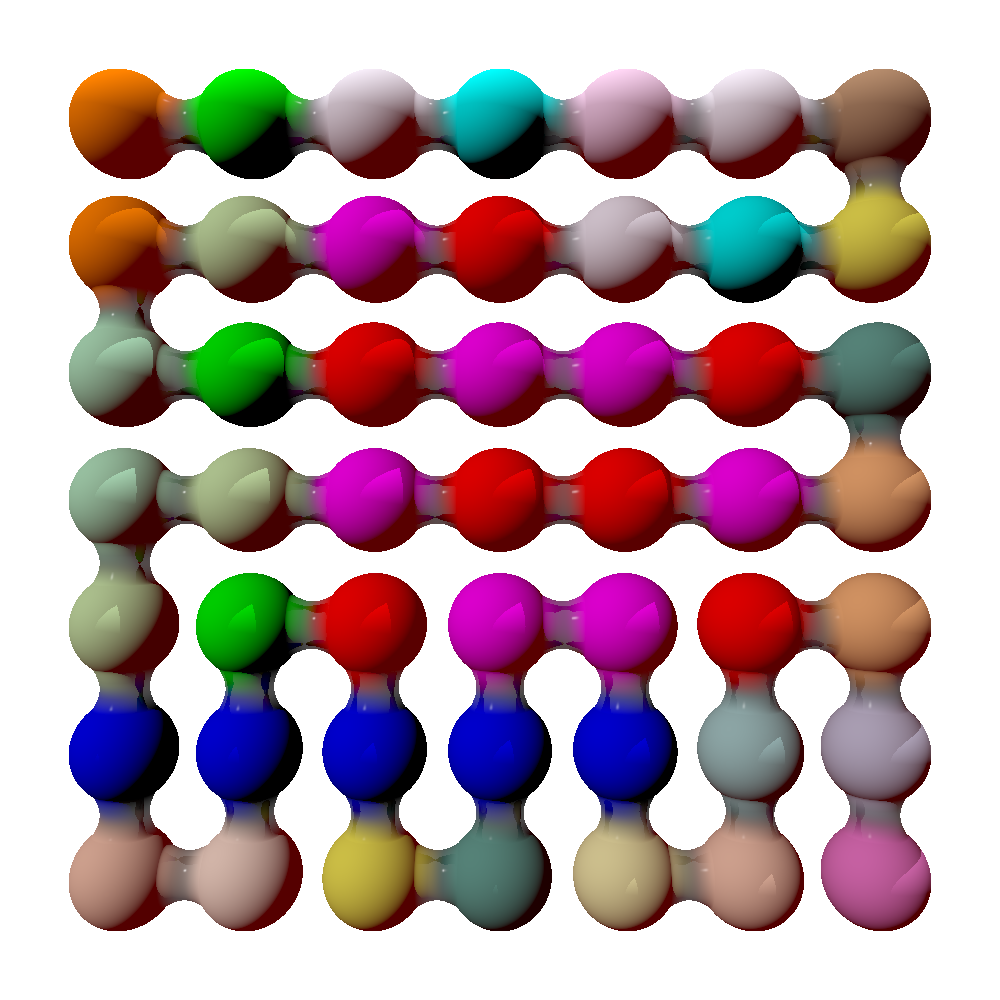

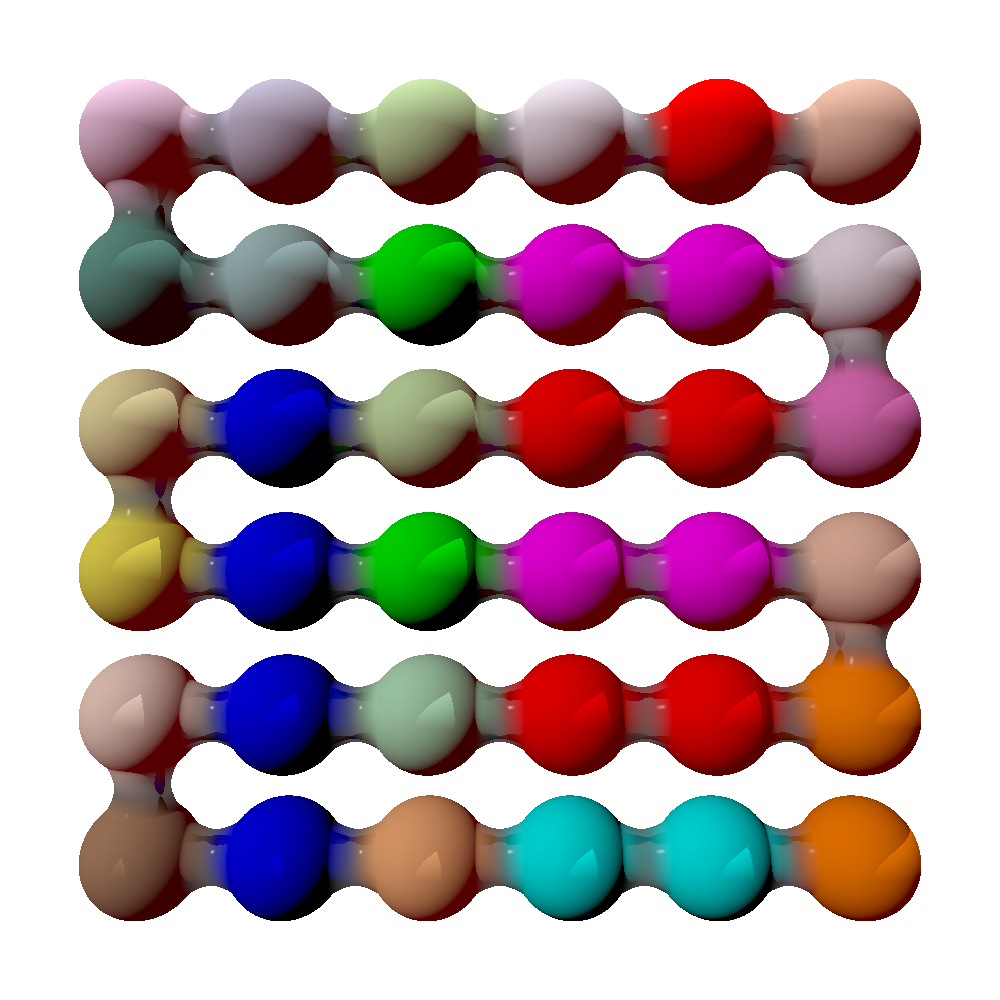
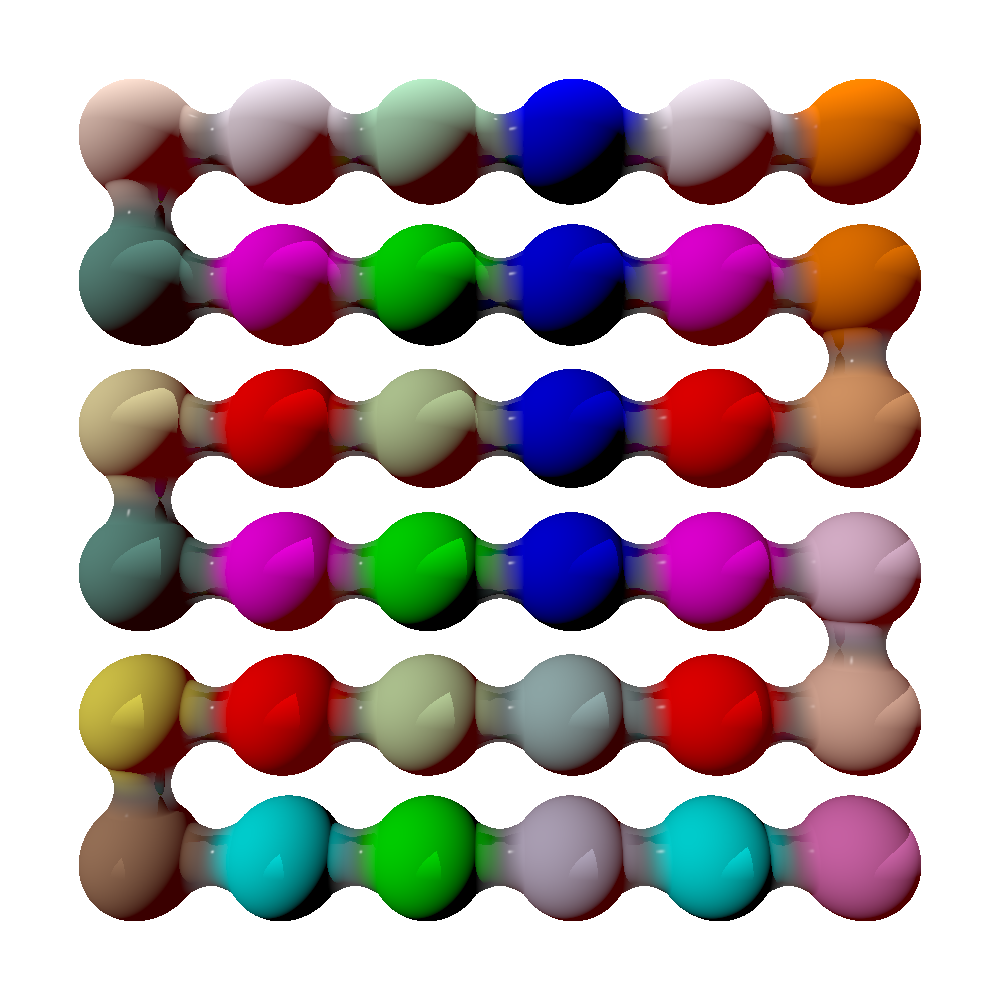
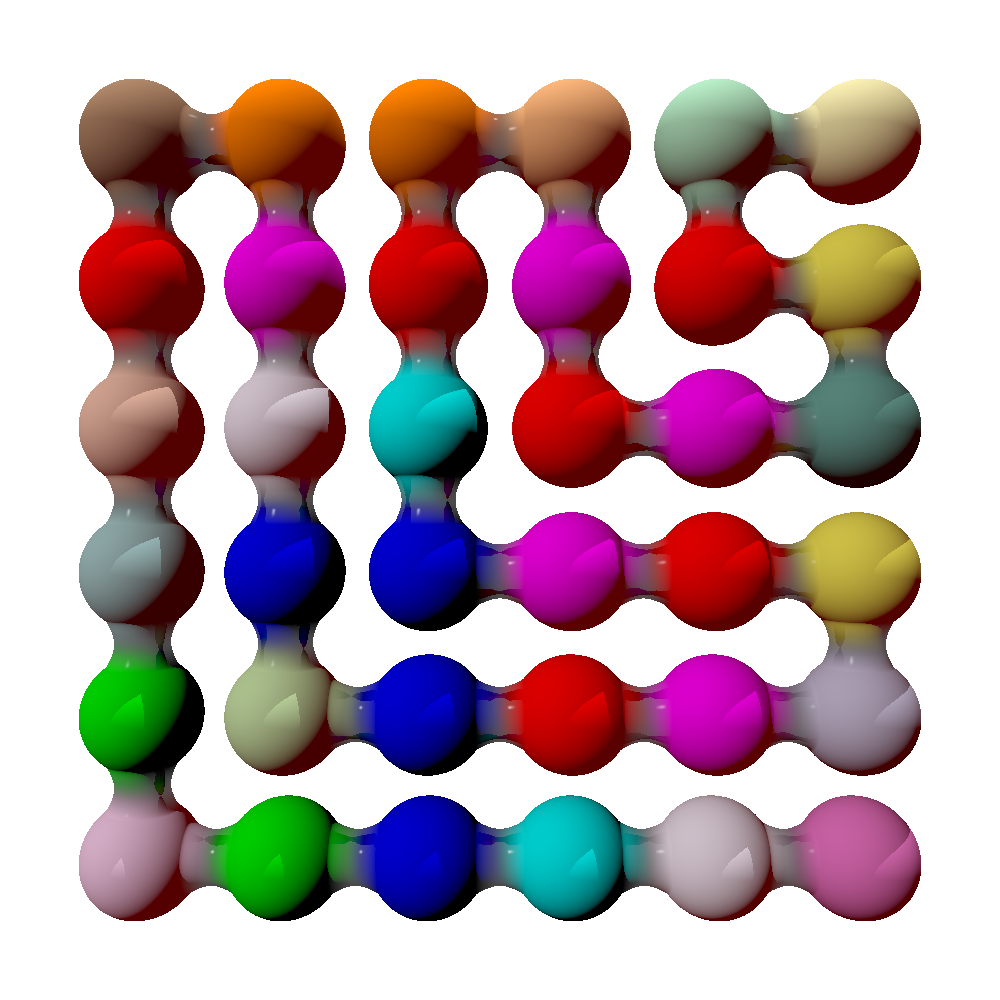
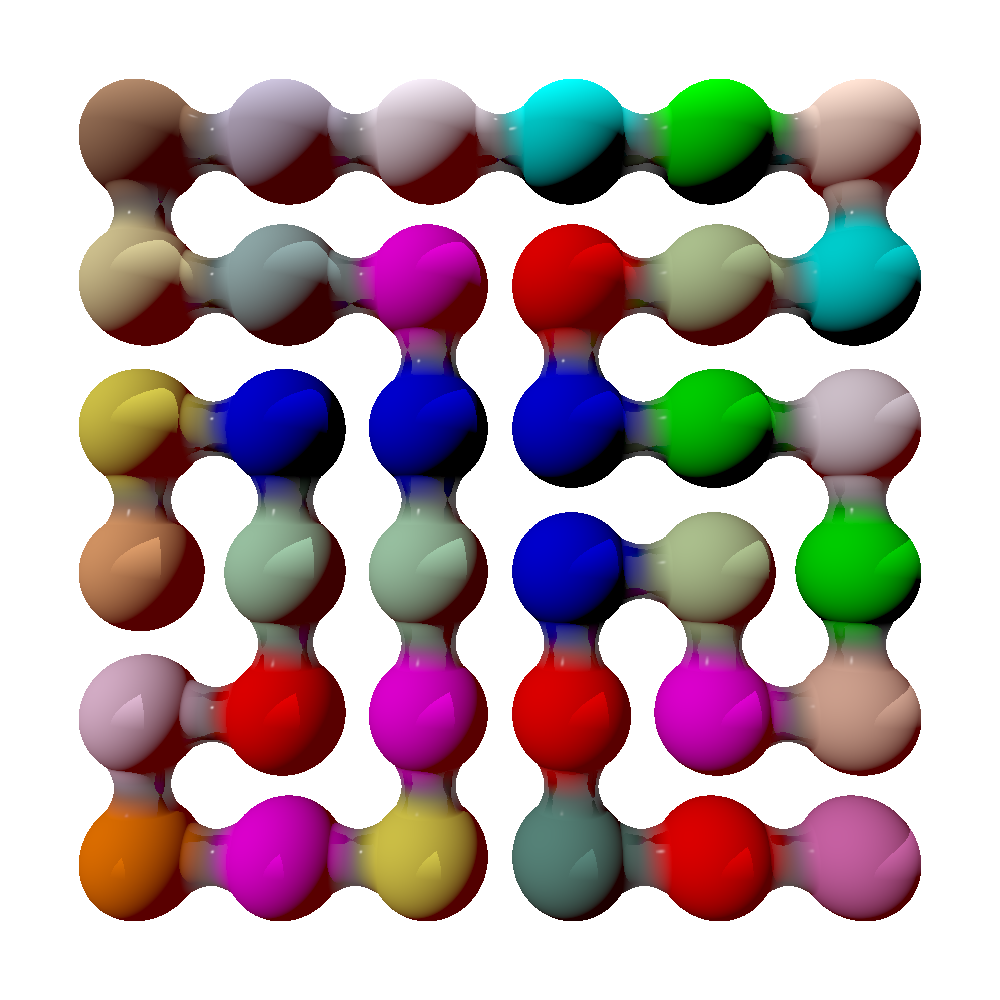
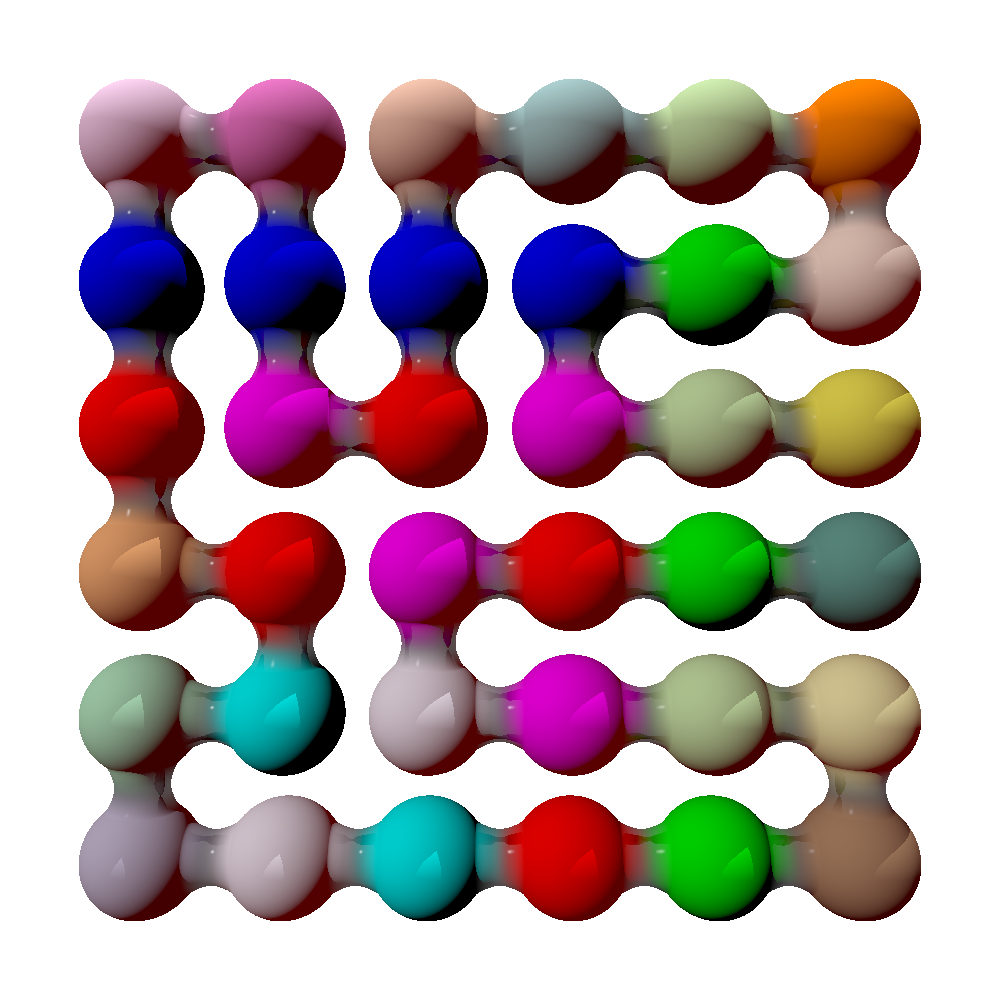
We consider 8 different proteins, which we label as , , , , , , and , which native states are shown in Fig. 1. Each capital letter in the protein label identifies a different native structure, while different subscript numbers refer to different sequences associated to the structure. Therefore, proteins , and share the same native structure, but have a different sequences. All the native structures have been selected considering maximally compact conformations, composed by 36 or 49 amino acids. Then, for each native structure, the protein sequence has been established through a design scheme, based on the standard approach introduced by Shakhnovich and Gutin [62, 63] and successfully adopted to design realistic off-lattice proteins [64, 65, 66, 67], but accounting explicitly for the water properties in the protein hydration shell [34]. We perform a Monte Carlo simulations in the isobaric–isothermal ensemble at ambient conditions, keeping fixed the protein conformation in its native state and mutating the amino acids, to explore the phase space of sequences. For each sequence the surrounding water is equilibrated and the average enthalpy of the hydrated protein (residue–residue energy plus the average enthalpy of the water molecules in the hydration shell) is computed. The sequence to whom correspond the minimum value of is selected as best folder. The design scheme leads to sequences which are not perfectly hydrophilic on the surface and hydrophobic into the core, consistent with what is observed in real proteins [68, 69]. The hydropathy of the designed protein surface and core is shown in Fig. 2, while the full amino acid composition composition of each sequence is shown in Fig. 6. It is worth to be noted that all the sequences generated differ each other, exhibiting different values for the hydrophilicity (hydrophobicity) of the protein surface (core), irrespective of the native structure, and the maximum overlap between the sequences is of 10 amino acids333The maximum overlap between two sequences is computed shifting and overlapping one sequence with respect to the other, and counting the number of amino acids on both sequences which coincides along the overlapped region.. Each designed sequence is folded alone at ambient conditions to prove its capability to reach the native state. Once the proteins have been designed, we simulate the folding of multi-protein systems in a range of concentrations , considering homogeneous solutions, i.e. when all the sequences are equal. Along the simulations we compute the free energy landscape as function of the total number of native contacts and inter-protein contacts to study the folding–aggregation competition.
3 Water Model
The coarse-grain representation of the water molecules replaces the coordinates and orientations of the water molecules by a continuous density field and discrete bonding variables, respectively. The density field is defined on top of a partition of the volume into a fixed number of cells, each with volume , being the water excluded volume and Å the water van der Waals diameter. The size of a cell is a stochastic variable and coincides, by construction, with the average distance between first-neighbour water molecules. The general formulation of the model envisages to each cell an index or according to the size (which varies a lot from the gas phase to the super-cooled one), to distinguish when the molecule can form hydrogen bonds (HBs) or not, respectively. Here, since we perform the study at ambient conditions, we assume that all the molecules can form HB, placing to all cells, therefore such an index is removed from the following expression for sake of simplicity (for general formulation see for example Ref. [44, 45, 46, 70, 47, 48, 49, 50, 71, 39, 51, 34, 72]).
The Hamiltonian of the bulk water is
| (1) |
The first term, summed over all the water molecules and at oxygen-oxygen distance , is given by for , for , and for (cutoff distance). We fix = 2.9 kJ/mol.
The second term of the Hamiltonian represents the directional component of the water-water hydrogen bonds (HB). By assuming that a molecule can form up to four HBs, we discretize the number of possible molecular conformations introducing four bonding indices for each water molecule . the variable describes the bonding conformation of the molecule with respect to the neighbour molecule . Each variable has possible states, and if an HB between the molecules and is formed, with the characteristic energy . The number of HB is then defined as , with if , 0 otherwise. A HB is broken if the oxygen-oxygen-hydrogen angle exceeds the 30∘, therefore only 1/6 of the entire range of values [0,360∘] of this angle is associated to a bonded state. Fixing we correctly account for the entropic loss due to the HB formation.
The third interaction term in Eq. (1) corresponds to the cooperative interaction of the HBs due to the oxygen-oxygen-oxygen correlation. This effect originates from quantum many-body interactions of the HB [73] and in the bulk leads the molecules toward an ordered tetrahedral configuration [74]. This term is modelled as an effective interaction–with coupling constant –between each of the six different pairs of the four indexes of a molecule . Hence, we have which defines the cooperativity of the water molecules. By assuming we guarantee the asymmetry between the two terms [44].
For any HB formed in the bulk the local volume increases of the quantity . The associated enthalpic variation is , being the pressure. It accounts for the disrupting effect on the HB network. Here represents the average volume increase between high-density ices VI and VIII and low-density ice Ih [44]. Hence, the volume of bulk molecules is given by
The water-water hydrogen bonding in the protein hydration shell depends on the hydrophobic (PHO) or hydrophilic (PHI) nature of the hydrated amino acids, and is described by the Hamiltonian
| (2) | |||
where , and indicate respectively the number of HB formed between two molecules hydrating two hydrophobic amino acids, two hydrophilic amino acids, one hydrophobic amino acid and one hydrophilic amino acid. Analogously , and represent the cooperative bonds at the hydrophobic, hydrophilic and mixed interface.
The hydrophobic interface strengthens the water-water hydrogen bonding in the first hydration shell [75, 76, 56, 54] and increases the local water density upon pressurization [54, 77, 78, 79]. The first effect is included by assuming and . This condition guarantees that the solvation free energy of a hydrophobic amino acid decreases at low temperature [80]. The second one is accounted assuming that the volume associate to the HB at the PHO interface decreases upon increasing , [39]. In this way, the density fluctuations at the PHO interface are reduced at high . The volume contribution to total volume due the HBs in the hydrophobic shell is . We assume that the water-water hydrogen bonding and the water density at the hydrophilic interface are not affected by the protein. Therefore, , and . Finally, we fix and .
Lastly, we assume that the protein-water interaction energy is or , depending if the residue is hydrophobic or hydrophilic, respectively. As reported in Ref. [34], we express the model parameters in units of , and fix the value to and (bulk water), and (water at hydrophilic interfaces), and (water at hydrophobic interfaces), or . Finally, we fix , and . These choices balance the water-water, the water-residue and the residue-residue interactions, making the proteins stable for thermodynamic conditions comprised in the (stable and metastable) liquid phase, including ambient conditions. Moreover, by enhancing the interface interactions we account for the lower surface volume ratio of the model (formulated in two dimensions) with respect to a three-dimensional system.
All the results presented in this work have been tested under the change of parameters. In particular, we have decreased the effect of the protein interface on the water-water interaction observing a decrease in the concentration thresholds at which the proteins unfold and aggregate, but the phenomenology observed is substantially the same.
4 Folding vs Aggregation in homogeneous protein solutions
Protein
Protein
Protein
(a) (b)
\begin{overpic}[scale={0.21}]{Free_energy_ProtA0-eps-converted-to.pdf}
\put(11.0,41.0){\includegraphics[scale={0.04}]{prot_A0.png}}
\end{overpic}
\begin{overpic}[scale={0.21}]{Free_energy_ProtB-eps-converted-to.pdf}
\put(10.0,13.0){\includegraphics[scale={0.04}]{prot_B.png}}
\end{overpic}
(c) (d)
\begin{overpic}[scale={0.21}]{Free_energy_ProtC-eps-converted-to.pdf}
\put(54.0,42.0){\includegraphics[scale={0.04}]{prot_C.png}}
\end{overpic}

(e) (f)


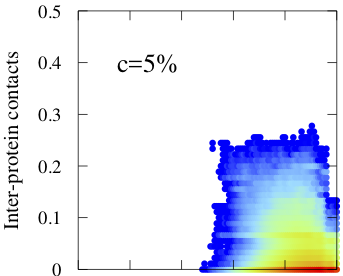
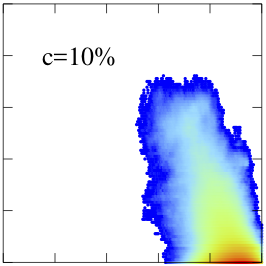
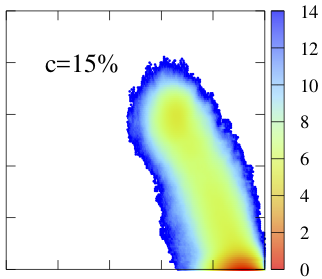
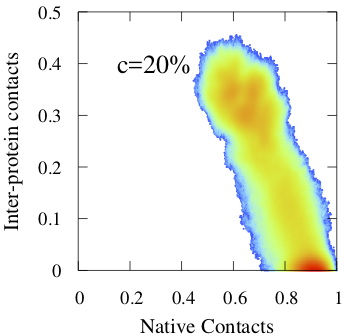
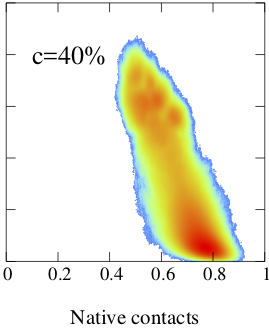
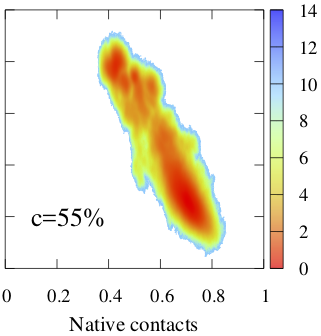
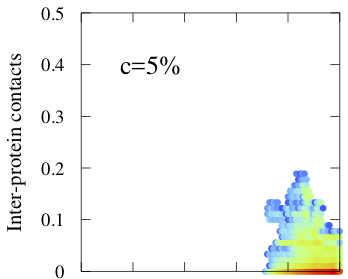
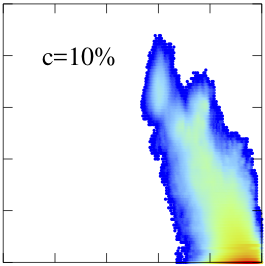
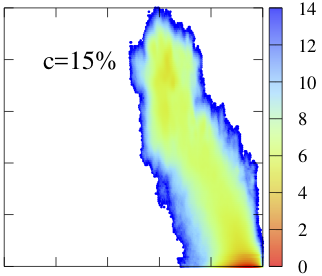
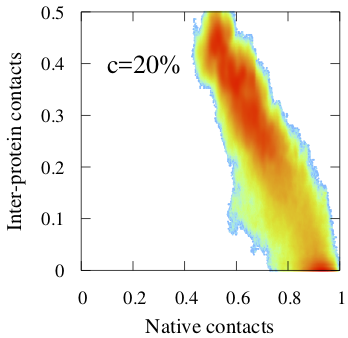
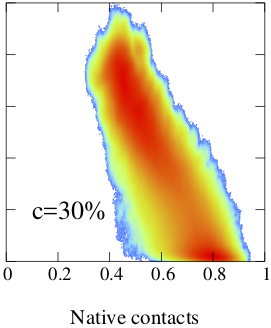
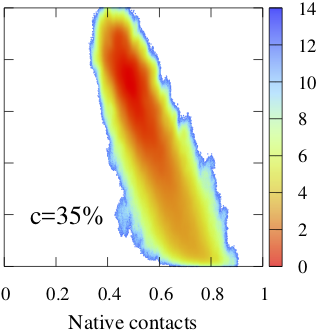
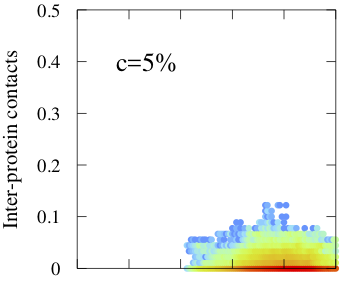
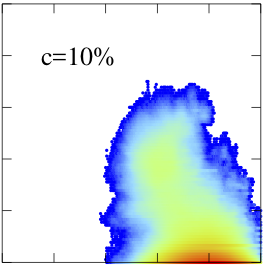
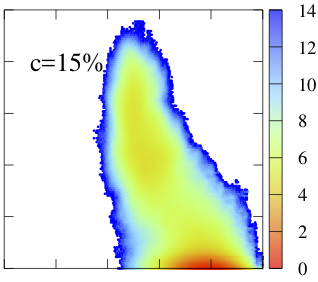
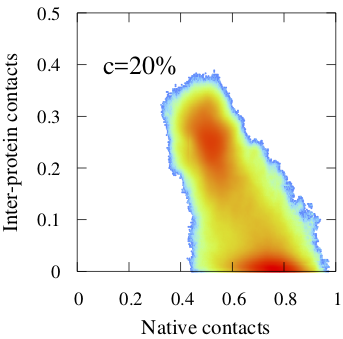
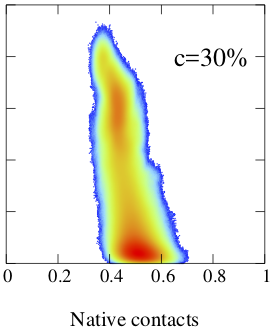
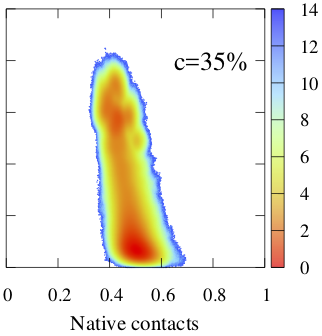
In Fig. 3 we show the free energy landscape of proteins , and as function of and simulated in a concentration range . In all the cases we observe that for low concentrations, , the minimum of the free energy correspond to and , i.e. all the proteins reach their native folded state and, on average, are not in contact to each other.
By looking at the separate free energy profile as function of (Fig. 4a,b,c) and (Fig. 4d,e,f) (obteined integrating the free energy profiles shown if Fig. 3 along the axes and respectively), respectively indicated with and , we can identify three different states for each protein: i) the native state ; ii) the unfolded and not aggregated state ; iii) the unfolded and aggregated state . The state occurs when all the proteins recover their native conformation and the minima and , respectively of the free energy profiles and , occur at and . The unfolded and not-aggregated state takes place when the protein looses part of its native contacts leading to for while the aggregated state is still less favourable being for . The peculiar characteristic of the state is that there are no inter-protein contacts ( remains by far the lowest free energy minima Fig.4b).
In Fig. 5 we prove that, for protein isolated pairs, the unfolding starts before the residues can interact directly. Since the proteins are not interacting directly, and there are no long-range interactions in the model the logical conclusion is that the water is mediating the interaction that stabilises the misfolded states compared to the folded one. When we switched off the water terms in the model the state disappears, and the systems go directly into the state at even lower concentrations (see Fig. 8 in the Supplementary Information). Hence, it is clear that the water is creating a barrier against aggregation.
Such an unexpected role of the water has to the best of our knowledge never been observed before.
The state holds for quite large values of , where protein gradually unfold by increasing . Eventually, at very high concentrations ( for protein ), we observe the appearance of a clear minimum in the free energy ( in Fig.3.d-f) signifying that we reached an aggregated state . The occurrence of aggregates comes with a loss of the native conformations () consistent with previous observations [19].
It is important to stress that the concentration thresholds of the and transitions, which we indicate with symbols and with , depend on the specific sequence (Fig. 4).
By comparing the transition points for proteins and (Fig. 4d,e), which have the same fraction of hydrophilic amino acids on the surface and hydrophobic amino acids into the core (Fig. 2), we observe that the protein is less prone to aggregate with respect to , since . On the other hand, by comparing the same transition points between proteins and (Fig. 4b,c), we find that both transitions occur at similar values of within the numerical error, although their surface and core composition are quite different, being the protein more hydrophobic on the surface and less hydrophobic into the core with respect to the protein . This interesting result points out that the propensity to aggregate of proteins is not strictly related to the hydrophobic content of its surface, as long as this amount has been “designed” according to the environment [34].
Similar and transitions are observed also in the proteins , , , and (not shown here). It is interesting to observe that, although proteins , and share the same native structure (the sequence of each proteins has been obteined with an independent design procedure), the concetration threshold fot the and transitions are different in each case.
5 Water-mediated protein-protein interaction

In this section we focus on the protein-protein interaction mediated by water molecules, for binary systems. In particular, we consider the cases – proteins and – proteins (homogeneous systems). In Fig. 5 we report the average number of native contact 444The average is calculated over all conformations hence the maximum average value will smaller compared to the global minimum that is for all proteins. as function of the minimum protein distance 555The minimum protein distance is the minimum value between all the possible distances among any amino acid of the first protein and any amino acid of the second protein.. We observe that the value of is constant for a wide range of of protein distances, with higher or lower values (respectively for the systems – and –) reflecting the width of the free energy minima and hence the intrinsic stability of the native conformation. The interesting feature in Fig. S5 occurs when starts decreasing linearly when the protein gets close to each other. These results demonstrate that the proteins start to unfold before interacting directly. Moreover, the transition distances correlate with the protein stability as (red square points), being overall more stable than the protein (blue circle points), show an interaction radius smaller () with respect the one of protein (). Our hypothesis is that the distance under which decreases can be considered as the water-mediated the interaction radius of a protein. With this respect, following a recent percolation mapping [72], we have performed a preliminary analysis of the extent of “water statistical fluctuations” at the protein interface, depending on the protein folded/unfolded state and on the protein-protein distance. Such an extent is a measure of the correlation length in water and quantify the perturbation exerted by the protein on the surrounding water. Our data, shown in Fig. 7 the Supplementary Information, reveal an increase of the water fluctuations when two proteins unfold upon approaching each other. It is also important to notice that the transition distances are close to the distance between proteins at the transition concentrations. Finally, the transition distances correlate with the protein stability as (red square points), being overall more stable than the protein (blue circle points), show a an interaction radius smaller () with respect the one of protein ().
6 Conclusions
We have presented a computational study on the competition between folding and aggregation of proteins in homogeneous solutions. By means of an efficient coarse-grain model we have designed a series of proteins according to the water environment at ambient condition. Then, we have tested the capability of each designed protein to fold alone, and in presence of multiple copies (i.e. changing the protein concentration). The main conclusion of this work is that proteins tend to fold uninfluenced by the presence of other proteins in the solution provided that their concentration is below their specific unfolding concentration . Our simulations predict an unexpected and not previously observed role of the water in the inducing the unfolded regime that is a precursor of the fully aggregated state . We believe that such prediction should be testable first in more detailed protein models and supports the need for new intriguing experiments.
Correlated to our study, there is an extensive literature about the role of cellular crowding on aggregation and folding. A sample of pioneering works in the field are [81, 82, 83, 84, 82, 85]. The central message of these studies is that the role of the steric crowding does not significantly affect the folding. However, when globular proteins replace crowding agents, the behaviour of the system becomes difficult to explain because of the influence of protein-protein. Our results offer a qualitative description of such an influence, separating the role of water, protein and steric interactions at different concentrations.
Acknowledgements
V.B. acknowledges the support from the Austrian Science Fund (FWF) project M 2150-N36 and from the European Commission through the Marie Skłodowska-Curie Fellowship No. 748170 ProFrost. V.B. and I.C. acknowledge the support from the FWF project P 26253-N27. Simulations have been performed using the Vienna Scientific Cluster (VSC-3).
References
-
[1]
A. V. Finkelstein, O. B. O. B. Ptitsyn,
Protein
physics, Elsevier, 2016.
URL https://www.elsevier.com/books/protein-physics/finkelstein/978-0-12-809676-5 -
[2]
A. De Simone, C. Kitchen, A. H. Kwan, M. Sunde, C. M. Dobson, D. Frenkel,
Intrinsic
disorder modulates protein self-assembly and aggregation., Proceedings of
the National Academy of Sciences of the United States of America 109 (18)
(2012) 6951–6956.
doi:10.1073/pnas.1118048109.
URL http://www.ncbi.nlm.nih.gov/pubmed/22509003http://www.pubmedcentral.nih.gov/articlerender.fcgi?artid=PMC3344965 -
[3]
G. G. Tartaglia, M. Vendruscolo,
Correlation between mRNA
expression levels and protein aggregation propensities in subcellular
localisations, Molecular BioSystems 5 (12) (2009) 1873.
doi:10.1039/b913099n.
URL http://xlink.rsc.org/?DOI=b913099n -
[4]
D. Eliezer, K. Chiba, H. Tsuruta, S. Doniach, K. O. Hodgson, H. Kihara,
Evidence of
an associative intermediate on the myoglobin refolding pathway, Biophysical
Journal 65 (2) (1993) 912–917.
doi:10.1016/S0006-3495(93)81124-X.
URL http://www.ncbi.nlm.nih.gov/pubmed/8218914http://www.pubmedcentral.nih.gov/articlerender.fcgi?artid=PMC1225792http://linkinghub.elsevier.com/retrieve/pii/S000634959381124X -
[5]
A. L. Fink,
Protein
aggregation: folding aggregates, inclusion bodies and amyloid, Folding and
Design 3 (1) (1998) R9–R23.
doi:10.1016/S1359-0278(98)00002-9.
URL http://www.sciencedirect.com/science/article/pii/S1359027898000029 -
[6]
C. J. Roberts, Non-native protein aggregation
kinetics, Biotechnology and Bioengineering 98 (5) (2007) 927–938.
doi:10.1002/bit.21627.
URL http://www.ncbi.nlm.nih.gov/pubmed/17705294http://doi.wiley.com/10.1002/bit.21627 -
[7]
P. Neudecker, P. Robustelli, A. Cavalli, P. Walsh, P. Lundström,
A. Zarrine-Afsar, S. Sharpe, M. Vendruscolo, L. E. Kay,
Structure
of an Intermediate State in Protein Folding and Aggregation, Science
336 (6079).
URL http://science.sciencemag.org/content/336/6079/362/tab-pdf -
[8]
C. A. Ross, M. A. Poirier,
Opinion: What is the
role of protein aggregation in neurodegeneration?, Nature Reviews Molecular
Cell Biology 6 (11) (2005) 891–898.
doi:10.1038/nrm1742.
URL http://www.nature.com/doifinder/10.1038/nrm1742 -
[9]
F. Chiti, C. M. Dobson, Protein
Misfolding, Functional Amyloid, and Human Disease, Annual Review of
Biochemistry 75 (1) (2006) 333–366.
doi:10.1146/annurev.biochem.75.101304.123901.
URL http://www.ncbi.nlm.nih.gov/pubmed/16756495http://www.annualreviews.org/doi/10.1146/annurev.biochem.75.101304.123901 -
[10]
A. Aguzzi, T. O’Connor,
Protein aggregation
diseases: pathogenicity and therapeutic perspectives, Nature Reviews Drug
Discovery 9 (3) (2010) 237–248.
doi:10.1038/nrd3050.
URL http://www.nature.com/doifinder/10.1038/nrd3050 -
[11]
T. P. J. Knowles, M. Vendruscolo, C. M. Dobson,
The amyloid state and its
association with protein misfolding diseases, Nature Reviews Molecular Cell
Biology 15 (6) (2014) 384–396.
doi:10.1038/nrm3810.
URL http://www.nature.com/articles/nrm3810 -
[12]
M. Schröder, R. Schäfer, P. Friedl,
Induction of protein
aggregation in an early secretory compartment by elevation of expression
level., Biotechnology and bioengineering 78 (2) (2002) 131–140.
URL http://www.ncbi.nlm.nih.gov/pubmed/11870603 -
[13]
G. G. Tartaglia, S. Pechmann, C. M. Dobson, M. Vendruscolo,
Life on the edge: a link
between gene expression levels and aggregation rates of human proteins.,
Trends in biochemical sciences 32 (5) (2007) 204–206.
doi:10.1016/j.tibs.2007.03.005.
URL http://www.ncbi.nlm.nih.gov/pubmed/17419062 -
[14]
C. M. Dobson,
Principles
of protein folding, misfolding and aggregation, Seminars in Cell &
Developmental Biology 15 (1) (2004) 3–16, protein Misfolding and Human
Disease and Developmental Biology of the Retina.
doi:https://doi.org/10.1016/j.semcdb.2003.12.008.
URL http://www.sciencedirect.com/science/article/pii/S1084952103001137 -
[15]
T. Cellmer, D. Bratko, J. M. Prausnitz, H. W. Blanch,
Protein
aggregation in silico., Trends in biotechnology 25 (6) (2007) 254–261.
doi:10.1016/j.tibtech.2007.03.011.
URL http://www.ncbi.nlm.nih.gov/pubmed/17433843http://www.pubmedcentral.nih.gov/articlerender.fcgi?artid=PMC2680282 -
[16]
J. Nasica-Labouze, P. H. Nguyen, F. Sterpone, O. Berthoumieu, N.-V. Buchete,
S. Coté, A. De Simone, A. J. Doig, P. Faller, A. Garcia, A. Laio, M. S.
Li, S. Melchionna, N. Mousseau, Y. Mu, A. Paravastu, S. Pasquali, D. J.
Rosenman, B. Strodel, B. Tarus, J. H. Viles, T. Zhang, C. Wang,
P. Derreumaux, Amyloid
$$ Protein and Alzheimer’s Disease: When Computer Simulations
Complement Experimental Studies, Chemical Reviews 115 (9) (2015)
3518–3563.
doi:10.1021/cr500638n.
URL http://pubs.acs.org/doi/abs/10.1021/cr500638n - [17] R. a. Broglia, G. Tiana, S. Pasquali, H. E. Roman, E. Vigezzi, Folding and aggregation of designed proteins., Proceedings of the National Academy of Sciences of the United States of America 95 (22) (1998) 12930–12933. doi:10.1073/pnas.95.22.12930.
-
[18]
L. Toma, S. Toma, A
Lattice Study of Multimolecular Ensembles of Protein Models. Effect of
Sequence on the Final State: Globules, Aggregates, Dimers, Fibrillae,
Biomacromolecules 1 (2) (2000) 232–238.
doi:10.1021/bm005506o.
URL http://pubs.acs.org/doi/abs/10.1021/bm005506o - [19] D. Bratko, H. W. Blanch, Competition between protein folding and aggregation: A three-dimensional lattice-model simulation, Journal of Chemical Physics 114 (1) (2001) 561–569. doi:10.1063/1.1330212.
-
[20]
N. Combe, D. Frenkel,
Phase behavior of a
lattice protein model, The Journal of Chemical Physics 118 (19) (2003)
9015–9022.
doi:10.1063/1.1567256.
URL http://aip.scitation.org/doi/10.1063/1.1567256 -
[21]
R. Dima, D. Thirumalai,
Exploring protein aggregation
and self-propagation using lattice models: Phase diagram and kinetics,
Protein Science 11 (5) (2002) 1036–1049.
doi:10.1110/ps.4220102.
URL http://doi.wiley.com/10.1110/ps.4220102 -
[22]
M. T. Oakley, J. M. Garibaldi, J. D. Hirst,
Lattice models of peptide
aggregation: Evaluation of conformational search algorithms, Journal of
Computational Chemistry 26 (15) (2005) 1638–1646.
doi:10.1002/jcc.20306.
URL http://www.ncbi.nlm.nih.gov/pubmed/16170797http://doi.wiley.com/10.1002/jcc.20306 -
[23]
Y.-Y. Ji, Y.-Q. Li, J.-W. Mao, X.-W. Tang,
Model study of
prionlike folding behavior in aggregated proteins, Physical Review E 72 (4)
(2005) 41912.
doi:10.1103/PhysRevE.72.041912.
URL http://www.ncbi.nlm.nih.gov/pubmed/16383425https://link.aps.org/doi/10.1103/PhysRevE.72.041912 -
[24]
T. Cellmer, D. Bratko, J. M. Prausnitz, H. Blanch,
Protein-folding
landscapes in multichain systems., Proceedings of the National Academy of
Sciences of the United States of America 102 (33) (2005) 11692–11697.
doi:10.1073/pnas.0505342102.
URL http://www.ncbi.nlm.nih.gov/pubmed/16081531%****␣Main_Arxive.tex␣Line␣575␣****http://www.pubmedcentral.nih.gov/articlerender.fcgi?artid=PMC1188005 -
[25]
L. Zhang, D. Lu, Z. Liu,
How
native proteins aggregate in solution: A dynamic Monte Carlo simulation,
Biophysical Chemistry 133 (1) (2008) 71–80.
doi:10.1016/j.bpc.2007.12.008.
URL http://www.sciencedirect.com/science/article/pii/S0301462207002931 -
[26]
S. Abeln, M. Vendruscolo, C. M. Dobson, D. Frenkel, C. Riekel,
A
simple lattice model that captures protein folding, aggregation and amyloid
formation., PloS one 9 (1) (2014) e85185.
doi:10.1371/journal.pone.0085185.
URL http://dx.plos.org/10.1371/journal.pone.0085185http://journals.plos.org/plosone/article?id=10.1371/journal.pone.0085185 -
[27]
A. Morriss-Andrews, J.-E. Shea,
Computational
Studies of Protein Aggregation: Methods and Applications, Annual Review of
Physical Chemistry 66 (1) (2015) 643–666.
doi:10.1146/annurev-physchem-040513-103738.
URL http://www.annualreviews.org/doi/10.1146/annurev-physchem-040513-103738 -
[28]
E. Y. Chi, S. Krishnan, T. W. Randolph, J. F. Carpenter,
Physical Stability
of Proteins in Aqueous Solution: Mechanism and Driving Forces in Nonnative
Protein Aggregation, Pharmaceutical Research 20 (9) (2003) 1325–1336.
doi:10.1023/A:1025771421906.
URL http://link.springer.com/10.1023/A:1025771421906 -
[29]
A. De Simone, G. G. Dodson, C. S. Verma, A. Zagari, F. Fraternali,
Prion
and water: tight and dynamical hydration sites have a key role in structural
stability., Proceedings of the National Academy of Sciences of the United
States of America 102 (21) (2005) 7535–7540.
doi:10.1073/pnas.0501748102.
URL http://www.ncbi.nlm.nih.gov/pubmed/15894615%****␣Main_Arxive.tex␣Line␣625␣****http://www.pubmedcentral.nih.gov/articlerender.fcgi?artid=PMC1140432 -
[30]
M. G. Krone, L. Hua, P. Soto, R. Zhou, B. J. Berne, J.-E. Shea,
Role of Water in
Mediating the Assembly of Alzheimer Amyloid-$$
A$$16−22 Protofilaments, Journal of the American Chemical
Society 130 (33) (2008) 11066–11072.
doi:10.1021/ja8017303.
URL http://pubs.acs.org/doi/abs/10.1021/ja8017303 -
[31]
D. Thirumalai, G. Reddy, J. E. Straub,
Role
of water in protein aggregation and amyloid polymorphism., Accounts of
chemical research 45 (1) (2012) 83–92.
doi:10.1021/ar2000869.
URL http://www.ncbi.nlm.nih.gov/pubmed/21761818http://www.pubmedcentral.nih.gov/articlerender.fcgi?artid=PMC3218239 -
[32]
Y. Fichou, G. Schirò, F.-X. Gallat, C. Laguri, M. Moulin, J. Combet,
M. Zamponi, M. Härtlein, C. Picart, E. Mossou, H. Lortat-Jacob, J.-P.
Colletier, D. J. Tobias, M. Weik,
Hydration
water mobility is enhanced around tau amyloid fibers., Proceedings of the
National Academy of Sciences of the United States of America 112 (20) (2015)
6365–6370.
doi:10.1073/pnas.1422824112.
URL http://www.ncbi.nlm.nih.gov/pubmed/25918405http://www.pubmedcentral.nih.gov/articlerender.fcgi?artid=PMC4443308 -
[33]
S. Arya, S. Mukhopadhyay,
Water
in Amyloidogenic Intrinsically Disordered Proteins: Interplay of
Conformational Preference and Amyloid Aggregation, Biophysical Journal
110 (3) (2016) 398a.
doi:10.1016/j.bpj.2015.11.2150.
URL http://linkinghub.elsevier.com/retrieve/pii/S0006349515033330 -
[34]
V. Bianco, G. Franzese, C. Dellago, I. Coluzza,
Role of Water in
the Selection of Stable Proteins at Ambient and Extreme Thermodynamic
Conditions, Physical Review X 7 (2) (2017) 021047.
doi:10.1103/PhysRevX.7.021047.
URL http://link.aps.org/doi/10.1103/PhysRevX.7.021047 -
[35]
G. Caldarelli, P. De Los Rios,
Cold and Warm
Denaturation of Proteins, Journal of Biological Physics 27 (2-3) (2001)
229–241.
doi:10.1023/A:1013145009949.
URL http://dx.doi.org/10.1023/A%3A1013145009949 -
[36]
M. I. Marqués, J. M. Borreguero, H. E. Stanley, N. V. Dokholyan,
Possible
Mechanism for Cold Denaturation of Proteins at High Pressure, Phys. Rev.
Lett. 91 (13) (2003) 138103.
doi:10.1103/PhysRevLett.91.138103.
URL http://link.aps.org/doi/10.1103/PhysRevLett.91.138103 -
[37]
B. A. Patel, P. G. Debenedetti, F. H. Stillinger, P. J. Rossky,
A
Water-Explicit Lattice Model of Heat-, Cold-, and Pressure-Induced Protein
Unfolding, Biophysical Journal 93 (12) (2007) 4116–4127.
doi:http://dx.doi.org/10.1529/biophysj.107.108530.
URL http://www.sciencedirect.com/science/article/pii/S0006349507716661 -
[38]
S. Matysiak, P. G. Debenedetti, P. J. Rossky,
Role of Hydrophobic
Hydration in Protein Stability: A 3D Water-Explicit Protein Model Exhibiting
Cold and Heat Denaturation, The Journal of Physical Chemistry B 116 (28)
(2012) 8095–8104.
doi:10.1021/jp3039175.
URL http://pubs.acs.org/doi/abs/10.1021/jp3039175 -
[39]
V. Bianco, G. Franzese, Contribution of Water to
Pressure and Cold Denaturation of Proteins, Physical Review Letters
115 (10) (2015) 1–12.
doi:10.1103/PhysRevLett.115.108101.
URL http://arxiv.org/abs/1505.07594http://dx.doi.org/10.1103/PhysRevLett.115.108101 -
[40]
E. van Dijk, P. Varilly, T. P. J. Knowles, D. Frenkel, S. Abeln,
Consistent
treatment of hydrophobicity in protein lattice models accounts for cold
denaturation, ArXiv e-prints 116 (7) (2015) 78101.
doi:10.1103/PhysRevLett.116.078101.
URL http://link.aps.org/doi/10.1103/PhysRevLett.116.078101http://journals.aps.org/prl/abstract/10.1103/PhysRevLett.116.078101 -
[41]
S. Miyazawa, R. L. Jernigan,
Estimation
of effective interresidue contact energies from protein crystal-structures -
quasi-chemical approximation, Macromolecules 18 (3) (1985) 534–552.
URL papers2://publication/uuid/71351A9B-3833-4129-A238-9ED8A1533949 - [42] I. Coluzza, D. Frenkel, Designing specificity of protein-substrate interactions., Physical Review. E 70 (5 Pt 1) (2004) 51917. doi:10.1103/PhysRevE.70.051917.
- [43] J. Kyte, R. F. Doolittle, A simple method for displaying the hydropathic character of a protein, J Mol Biol 157 (1982) 105–132.
- [44] K. Stokely, M. G. Mazza, H. E. Stanley, G. Franzese, Effect of hydrogen bond cooperativity on the behavior of water, Proceedings of the National Academy of Sciences of the United States of America 107 (2010) 1301–1306.
-
[45]
M. G. Mazza, K. Stokely, S. E. Pagnotta, F. Bruni, H. E. Stanley, G. Franzese,
More than one
dynamic crossover in protein hydration water, Proceedings of the National
Academy of Sciences 108 (50) (2011) 19873–19878.
doi:10.1073/pnas.1104299108.
URL http://www.pnas.org/content/108/50/19873.abstract -
[46]
F. de los Santos, G. Franzese,
Understanding Diffusion
and Density Anomaly in a Coarse-Grained Model for Water Confined between
Hydrophobic Walls, The Journal of Physical Chemistry Bdoi:10.1021/jp206197t.
URL http://pubs.acs.org/doi/abs/10.1021/jp206197t - [47] G. Franzese, V. Bianco, Water at Biological and Inorganic Interfaces, Food Biophysics 8 (3) (2013) 153–169.
- [48] V. Bianco, G. Franzese, Critical behavior of a water monolayer under hydrophobic confinement, Scientific Reports 4. doi:10.1038/srep04440.
- [49] G. Franzese, V. Bianco, S. Iskrov, Water at interface with proteins, Food Biophysics 6 (2) (2011) 186–198.
-
[50]
V. Bianco, S. Iskrov, G. Franzese,
Understanding the
role of hydrogen bonds in water dynamics and protein stability, J. Biol.
Phys. 38 (1) (2012) 27–48.
doi:10.1007/s10867-011-9235-7.
URL http://link.springer.com/10.1007/s10867-011-9235-7 -
[51]
V. Bianco, N. Pagès-Gelabert, I. Coluzza, G. Franzese,
How the
stability of a folded protein depends on interfacial water properties and
residue-residue interactions, Journal of Molecular Liquids 245 (2017)
129–139.
doi:10.1016/j.molliq.2017.08.026.
URL http://linkinghub.elsevier.com/retrieve/pii/S0167732217315416 -
[52]
C. L. Dias, T. Ala-Nissila, M. Karttunen, I. Vattulainen, M. Grant,
Microscopic Mechanism
for Cold Denaturation, Physical Review Letters 100 (11) (2008)
118101–118104.
URL http://link.aps.org/abstract/PRL/v100/e118101 -
[53]
C. Petersen, K.-J. Tielrooij, H. J. Bakker,
Strong temperature
dependence of water reorientation in hydrophobic hydration shells., The
Journal of chemical physics 130 (21) (2009) 214511.
doi:10.1063/1.3142861.
URL http://www.ncbi.nlm.nih.gov/pubmed/19508080 -
[54]
S. Sarupria, S. Garde,
Quantifying
Water Density Fluctuations and Compressibility of Hydration Shells of
Hydrophobic Solutes and Proteins, Phys. Rev. Lett. 103 (3) (2009) 37803.
doi:10.1103/PhysRevLett.103.037803.
URL http://link.aps.org/doi/10.1103/PhysRevLett.103.037803 -
[55]
Y. I. Tarasevich,
State and
structure of water in vicinity of hydrophobic surfaces, Colloid Journal
73 (2) (2011) 257–266.
doi:10.1134/S1061933X11020141.
URL http://link.springer.com/10.1134/S1061933X11020141 -
[56]
J. G. Davis, K. P. Gierszal, P. Wang, D. Ben-Amotz,
Water structural transformation
at molecular hydrophobic interfaces, Nature 491 (7425) (2012) 582–585.
doi:10.1038/nature11570.
URL http://dx.doi.org/10.1038/nature11570 -
[57]
D. Laage, T. Elsaesser, J. T. Hynes,
Water
Dynamics in the Hydration Shells of Biomolecules, Chemical Reviews (2017)
acs.chemrev.6b00765doi:10.1021/acs.chemrev.6b00765.
URL http://pubs.acs.org/doi/abs/10.1021/acs.chemrev.6b00765 -
[58]
S. Sarupria, S. Garde,
Quantifying
Water Density Fluctuations and Compressibility of Hydration Shells of
Hydrophobic Solutes and Proteins, Phys. Rev. Lett. 103 (3) (2009) 37803.
doi:10.1103/PhysRevLett.103.037803.
URL http://link.aps.org/doi/10.1103/PhysRevLett.103.037803 -
[59]
P. Das, S. Matysiak,
Direct Characterization
of Hydrophobic Hydration during Cold and Pressure Denaturation, The Journal
of Physical Chemistry B 116 (18) (2012) 5342–5348.
doi:10.1021/jp211832c.
URL http://pubs.acs.org/doi/abs/10.1021/jp211832c -
[60]
T. Ghosh, A. E. García, S. Garde,
Molecular dynamics simulations of
pressure effects on hydrophobic interactions, Journal of the American
Chemical Society 123 (44) (2001) 10997–11003.
doi:10.1021/ja010446v.
URL http://dx.doi.org/10.1021/ja010446v - [61] C. L. Dias, H. S. Chan, Pressure-dependent properties of elementary hydrophobic interactions: Ramifications for activation properties of protein folding, Journal of Physical Chemistry B 118 (27) (2014) 7488–7509. doi:10.1021/jp501935f.
-
[62]
E. Shakhnovich, A. Gutin,
A
new approach to the design of stable proteins, ”Protein Engineering, Design
and Selection” 6 (8) (1993) 793–800.
doi:10.1093/protein/6.8.793.
URL http://peds.oxfordjournals.org/content/6/8/793.abstracthttps://academic.oup.com/peds/article-lookup/doi/10.1093/protein/6.8.793 -
[63]
E. I. Shakhnovich, a. M. Gutin,
Engineering of stable
and fast-folding sequences of model proteins., Proceedings of the National
Academy of Sciences 90 (15) (1993) 7195–7199.
doi:10.1073/pnas.90.15.7195.
URL papers2://publication/uuid/E46F4571-68E5-4675-835F-37D95A099CBBhttp://www.pubmedcentral.nih.gov/articlerender.fcgi?artid=47103&tool=pmcentrez&rendertype=abstracthttp://www.pnas.org/cgi/doi/10.1073/pnas.90.15.7195 - [64] C. Cardelli, V. Bianco, L. Rovigatti, F. Nerattini, L. Tubiana, C. Dellago, I. Coluzza, The role of directional interactions in the designability of generalized heteropolymers, Scientific Reports 7 (1). doi:10.1038/s41598-017-04720-7.
- [65] C. Cardelli, L. Tubiana, V. Bianco, F. Nerattini, C. Dellago, I. Coluzza, Heteropolymer design and folding of arbitrary topologies reveals an unexpected role of alphabet size on the knot population, Macromolecules 51 (21) (2018) 8346–8356. doi:10.1021/acs.macromol.8b01359.
- [66] C. Cardelli, F. Nerattini, L. Tubiana, V. Bianco, C. Dellago, F. Sciortino, I. Coluzza, General methodology to identify the minimum alphabet size for heteropolymer design, Advanced Theory and Simulations 0 (0) 1900031. doi:10.1002/adts.201900031.
- [67] F. Nerattini, L. Tubiana, C. Cardelli, V. Bianco, C. Dellago, I. Coluzza, Design of protein–protein binding sites suggests a rationale for naturally occurring contact areas, Journal of Chemical Theory and Computation 15 (2) (2019) 1383–1392. doi:10.1021/acs.jctc.8b00667.
- [68] L. Lins, A. Thomas, R. Brasseur, Analysis of accessible surface of residues in proteins., Protein science : a publication of the Protein Society 12 (7) (2003) 1406–1417. doi:10.1110/ps.0304803.ondary.
-
[69]
S. Moelbert, E. Emberly, C. Tang,
Correlation
between sequence hydrophobicity and surface-exposure pattern of database
proteins., Protein science : a publication of the Protein Society 13 (3)
(2004) 752–762.
doi:10.1110/ps.03431704.
URL http://www.ncbi.nlm.nih.gov/pubmed/14767075http://www.pubmedcentral.nih.gov/articlerender.fcgi?artid=PMC2286732 -
[70]
E. G. Strekalova, J. Luo, H. E. Stanley, G. Franzese, S. V. Buldyrev,
Confinement of
anomalous liquids in nanoporous matrices, Phys. Rev. Lett. 109 (2012)
105701.
doi:10.1103/PhysRevLett.109.105701.
URL https://link.aps.org/doi/10.1103/PhysRevLett.109.105701 -
[71]
M. G. Mazza, K. Stokely, S. E. Pagnotta, F. Bruni, H. E. Stanley, G. Franzese,
More than one dynamic
crossover in protein hydration water, Proceedings of the National Academy of
Sciences 108 (50) (2011) 19873–19878.
arXiv:https://www.pnas.org/content/108/50/19873.full.pdf, doi:10.1073/pnas.1104299108.
URL https://www.pnas.org/content/108/50/19873 - [72] V. Bianco, G. Franzese, Hydrogen bond correlated percolation in a supercooled water monolayer as a hallmark of the critical region, Journal of Molecular Liquids 285 (2019) 727–739.
-
[73]
L. Hernández de la Peña, P. G. Kusalik,
Temperature dependence of quantum
effects in liquid water, Journal of the American Chemical Society 127 (14)
(2005) 5246–5251, pMID: 15810860.
arXiv:https://doi.org/10.1021/ja0424676, doi:10.1021/ja0424676.
URL https://doi.org/10.1021/ja0424676 -
[74]
A. K. Soper, M. A. Ricci,
Structures of
high-density and low-density water, Phys. Rev. Lett. 84 (2000) 2881–2884.
doi:10.1103/PhysRevLett.84.2881.
URL https://link.aps.org/doi/10.1103/PhysRevLett.84.2881 -
[75]
N. Giovambattista, P. J. Rossky, P. G. Debenedetti,
Effect of pressure
on the phase behavior and structure of water confined between nanoscale
hydrophobic and hydrophilic plates, Phys. Rev. E 73 (4) (2006) 41604.
doi:10.1103/PhysRevE.73.041604.
URL http://link.aps.org/doi/10.1103/PhysRevE.73.041604 -
[76]
C. L. Dias, T. Ala-Nissila, M. Karttunen, I. Vattulainen, M. Grant,
Microscopic Mechanism
for Cold Denaturation, Physical Review Letters 100 (11) (2008)
118101–118104.
URL http://link.aps.org/abstract/PRL/v100/e118101 -
[77]
P. Das, S. Matysiak,
Direct Characterization
of Hydrophobic Hydration during Cold and Pressure Denaturation, The Journal
of Physical Chemistry B 116 (18) (2012) 5342–5348.
doi:10.1021/jp211832c.
URL http://pubs.acs.org/doi/abs/10.1021/jp211832c -
[78]
T. Ghosh, A. E. Garc’ia, S. Garde,
Molecular Dynamics Simulations of
Pressure Effects on Hydrophobic Interactions, Journal of the American
Chemical Society 123 (44) (2001) 10997–11003.
URL http://dx.doi.org/10.1021/ja010446v -
[79]
C. L. Dias, H. S. Chan,
Pressure-Dependent Properties of
Elementary Hydrophobic Interactions: Ramifications for Activation Properties
of Protein Folding., The journal of physical chemistry. B 118 (27) (2014)
7488–7509.
doi:10.1021/jp501935f.
URL http://dx.doi.org/10.1021/jp501935f -
[80]
M. S. Moghaddam, H. S. Chan,
Pressure
and temperature dependence of hydrophobic hydration: Volumetric,
compressibility, and thermodynamic signatures, The Journal of Chemical
Physics 126 (11) (2007) 114507.
doi:10.1063/1.2539179.
URL http://scitation.aip.org/content/aip/journal/jcp/126/11/10.1063/1.2539179 -
[81]
B. van den Berg, R. J. Ellis, C. M. Dobson,
Effects
of macromolecular crowding on protein folding and aggregation, The EMBO
Journal 18 (24) (1999) 6927–6933.
doi:10.1093/emboj/18.24.6927.
URL http://emboj.embopress.org/cgi/doi/10.1093/emboj/18.24.6927 - [82] A. H. Gorensek-Benitez, A. E. Smith, S. S. Stadmiller, G. M. Perez Goncalves, G. J. Pielak, Cosolutes, Crowding, and Protein Folding Kinetics, Journal of Physical Chemistry B 121 (27) (2017) 6527–6537. doi:10.1021/acs.jpcb.7b03786.
- [83] P. H. Schummel, A. Haag, W. Kremer, H. R. Kalbitzer, R. Winter, Cosolvent and Crowding Effects on the Temperature and Pressure Dependent Conformational Dynamics and Stability of Globular Actin, Journal of Physical Chemistry B 120 (27) (2016) 6575–6586. doi:10.1021/acs.jpcb.6b04738.
- [84] M. Feig, I. Yu, P. H. Wang, G. Nawrocki, Y. Sugita, Crowding in Cellular Environments at an Atomistic Level from Computer Simulations, Journal of Physical Chemistry B 121 (34) (2017) 8009–8025. doi:10.1021/acs.jpcb.7b03570.
-
[85]
H.-X. X. Zhou, Protein
folding and binding in confined spaces and in crowded solutions, J. Mol.
Recognit. 17 (5) (2004) 368–375.
doi:10.1002/jmr.711.
URL papers2://publication/doi/10.1002/jmr.711
Supplementary Information

(a) (b)


(c) (d)


(a) (b)

