Photometry of Lyrae in 2018 by the BRITE satellites
Abstract
Observations of Lyr in four months of 2018 by three BRITE Constellation satellites (the red-filter BTr and BHr, and the blue-filter BLb) permitted a first, limited look into the light-curve variability in two spectral bands. The variations were found to be well correlated outside the innermost primary minima with the blue variations appearing to have smaller amplitudes than the red; this reduction may reflect their presumed origin in the cooler, outer parts of the accretion disk. This result must be confirmed with more extensive material as the current conclusions are based on observations spanning slightly less than three orbital cycles of the binary. The assumption of an instrumental problem and the applied corrections made to explain the unexpectedly large amplitude of the red-filter light-curve observed with the BTr satellite in 2016 are fully confirmed by the 2018 results.
1 Introduction
The eclipsing binary Lyr (HD 174638, HR 7106; mag, mag) was a target of an extensive, dedicated study of its light-curve variations by the BRITE Constellation satellites by Rucinski et al. (2018, Paper I). The BRITE Constellation was described by Weiss et al. (2014), Pablo et al. (2016), and Popowicz et al. (2017). The current paper can be considered as a companion and addendum to Paper I. A successful further re-observation of Lyr is not guaranteed in view of the progressive deterioration of the CCD detectors of the red filter BRITE satellites (see the text below) so we present here the extant results.
The light-curve variations of Lyr were interpreted in Paper I in terms of unstable accretion of the matter shed by the B6-8 II bright giant () unto an invisible, much more massive companion () in the interacting binary system with orbital period of day. Paper I utilized a long series of the almost continuous data from the satellite “Toronto” (BTr), aided in part by the satellite Uni-BRITE (UBr); both satellites used red filters. The observations were done in 2016 and extended over more than 10 revolutions of the binary with uniform, 100-minute sampling. The study led to characterization of the variations as a stochastic Gaussian process with the dominant variability time scale of about days ( in orbital phase), showing slightly stronger correlation than the red-noise signal. It was found that the signal decorrelation time scale days (or in phase) follows the same accretor-mass dependence as that observed for active galactic nuclei and quasi-stellar objects.
While Paper I was successful in terms of the temporal characterization of the stochastic variability of Lyrae, it had two deficiencies: (1) it addressed the light-curve variations in only the red-filter spectral band, (2) an important assumption was made to correct the extensive BTr satellite data for a newly discovered instrumental problem. This problem was later identified to affect the BRITE red-filter satellites due to the radiation detector damage. It was detected mostly thanks to the large amplitude of the Lyr eclipses which had extended the required dynamic range of the CCD response for a single object. The problem found a successful explanation in terms of charge-transfer inefficiency (CTI) effects (Pigulski et al., 2018; Popowicz, 2018) as a loss of a constant fraction of the CCD charge leading to a stronger modulation of the remaining part of the signal. A linear transformation was proposed in Paper I and led to a good agreement with simultaneous data from the BTr and UBr satellites. However, the UBr observations had a limited time span so that a direct confirmation on the correctness of the applied transformation was felt as necessary with the same BTr satellite.
Section 2 describes the 2018 observations while Section 3 presents the phased, seasonal light curves needed for determination of deviations from them caused by the variability of Lyrae which are presented for the red and blue spectral bands in Section 4. Conclusions in Section 5 close the paper.

2 2018 observations
The new observations of Lyrae were obtained between 5 June 2018 and 23 October 2018 using the red-filter satellites BRITE-Toronto (BTr) and BRITE-Heweliusz (BHr), and the blue-filter satellite BRITE-Lem (BLb). The individual exposures (three per minute) have been grouped into much better defined satellite-orbit average data, permitting brightness sampling at 98.4 min for BTr, 97.7 min for BHr and 99.5 min for BLb. The BTr satellite was oriented to place the Lyr image in a different CCD location than in 2016 to avoid the CTI-affected area which complicated analysis of the otherwise excellent data acquired previously.
The 2018 data turned out to be compromised by stabilization problems occurring for all the three satellites. This forced the run to be partitioned into several satellite setups111A satellite “setup” is a set of positioning instructions for the satellite and for the CCD windowing system, as described in the Appendix of Popowicz et al. (2017)., each with a possibility of a small shift in the magnitude scale zero-point. The more extensive and denser BTr observations were divided into four setups (numbers 2 – 5), while the BHr and BLb observations were split into two setups (for each, the numbers 2 – 3). The initial, position-acquisition setups (number 1) were discarded. In terms of the binary orbits, the coverage provided by the satellites was respectively seven (BTr), seven (BHr) and five (BLb) binary orbits long with a very uneven distribution of the data points for BHr. The data are shown in Figure 1 and are listed in Table 1.
3 The seasonal light curves
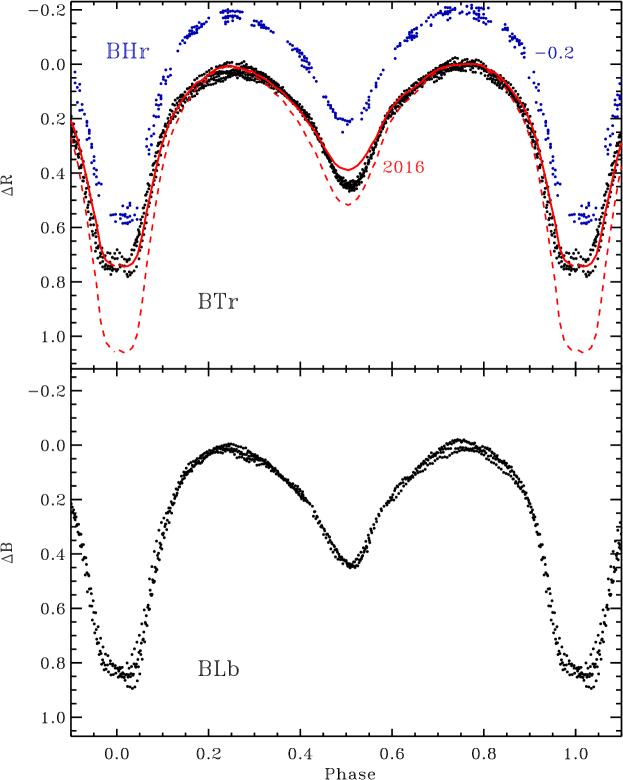
Although three BRITE satellites were used to observe Lyrae in 2018, the frequent disruptions (Figure 1) prevent an equally detailed temporal analysis of the light-curve variability as for the 2016 BTr data presented in Paper I. Thus, none of the modern statistical tools utilized in Paper I could be applied for the new data although the light-curve variations were definitely present. In the light curves plotted versus orbital phase (Figure 2) the eye can separate variations taking place during individual orbital cycles of the binary. We note that the variations were smaller during the secondary eclipse confirming the conclusions in Paper I. The orbital phases for Lyrae were calculated from the same quadratic ephemeris as used in Paper I, by Ak et al. (2007), with the locally linear elements set for at and d.
The stochastic variability observed in the Lyrae light curve was characterized in Paper I by the standard deviation mag, but averaging of several binary cycles and the high uniformity of the BTr observations in 2016 resulted in reduction of the median standard error of the mean, seasonal light curve to 0.0036 mag per 0.01 phase interval. The 2018 data are poorer than the 2016 data, mostly because of the smaller number of data points per phase bin (median numbers 12, 4 and 8 points per 0.01 phase interval for BTr, BHr and BLb, respectively). While the median errors were increased moderately compared with the 2016 seasonal light curve, to 0.0043, 0.0064, and 0.0053 mag, the uncertainties for some of the phase intervals reached as much as 0.017, 0.021, and 0.021 mag (BTr, BHr and BLb, respectively) in the deepest parts of the eclipses, mostly due to the use of the magnitude scale which exaggerates errors when the star is relatively faint – see the next Section 4 where the brightness levels are discussed in terms of flux units. The BHr seasonal light curve was poorly covered with some of the 0.01 phase intervals having only one or no data points. The uncertainties for some phases of the BTr and BLb seasonal light curves have a dominating impact on the accuracy with which variations in the individual light curves could be determined (Section 4). The mean light curves are listed in Table 2.
Irrespectively of the above qualifications, an encouraging result of the 2018 observations is a verification of the assumptions in Paper I, made to correct the BTr 2016 data for the instrumental CTI problem. We assumed in Paper I that 25.5% of the unmodulated signal had been lost, increasing the variability amplitude in the modulated part. While we did not use the light curves for an eclipsing-model analysis, a correction for the CTI problem was needed to evaluate the scale for the light-curve variations. The magnitude of the CTI-effect correction was determined in Paper I from the parallel UBr satellite observations. However, it was felt necessary to verify our assumptions with observations done with the same BTr satellite, with the image of Lyrae shifted to an unaffected area of its CCD. The 2018 BTr data agree with the corrected 2016 light curve, as shown by a comparison of the data points and lines in Figure 2; the BHr mean light curve also fully agrees with that result. The amplitude is very well reproduced, including the light-curve sections in the deeper minimum, which led us – for the 2016 data – to detection of the CTI problem. The agreement in the detail of the light-curve shape is somewhat less satisfactory, particularly during the secondary minimum, which is otherwise best defined thanks to the diminished magnitude of the light-curve physical variations in that phase interval. The slightly imperfect fit around the secondary minimum may indicate that a linear correction for the CTI effect may need some adjustment although a nonlinearity would present a considerable challenge for the mission in terms of possible ways to diminish its influence on the final results. However, a much simpler solution for this relatively minor discrepancy would be to resort to the slow variations in the Lyrae system and the well established – but still unexplained – 283 day periodicity expected to be exactly in anti-phase relative to the 2016 season with 2.5 cycles separating the two BRITE runs (for the list of references relating to the 283-day periodicity, see Sec. 3 in Paper I). The cycle was found by Van Hamme at al. (1995) to have a semi-amplitude of about 0.02 mag in the red part of the spectrum which could easily accommodate the remaining slight light-curve shape discord.
4 Simultaneous observations in the red and blue spectral bands
While the BHr 2018 data were too sparse for a reliable definition of the light-curve physical variations (Figure 1), the BTr and and BLb observations offered a possibility of seeing correlation of light-curve variations in the red and blue spectral bands. Unfortunately, the simultaneous successful operations lasted a relatively short time, (Figure 1), i.e. about three orbital cycles of the binary. During that time the blue observations were more uniform in time than the red data so that sufficiently simultaneous data from both satellites (within an interval of one satellite orbit) could be determined for only 394 epochs.

The magnitude scale in Figures 1 and 2 has been useful for pointing out the technical problem caused by the CTI defect, but this scale is not appropriate for consideration of the light-curve variations: It is unphysical and nonlinear, and – when the magnitudes are related to the maximum light of the binary – it emphasizes the variations during the low-brightness light-curve sections dominated by geometrical eclipse effects. For analysis of the light-curve variations and for consistency with Paper I, the light curves for BTr and BLb were transformed into fluxes and then used to find the light-curve flux deviations as the differences between the individual flux and the mean, seasonal light curve, following the definition in Paper I. The maximum light of the binary was estimated (to mag) for use as the flux unit in the respective spectral ranges at and 3.515 for the BTr and BLb satellites. The deviations are listed in Table 1. The individual uncertainties of were estimated as quadratically added uncertainties of the mean light curves (increased by to account for interpolation and smoothing) and the uncertainties of the satellite-orbit flux averages. The resulting uncertainties are dominated by those of the seasonal light curves with median standard errors of 0.0051 and 0.0064 (in flux units) for the BTr and BLb satellites. The maximum errors, particularly at the slopes of the eclipses reached 0.0119 and 0.0130 for the two satellites, respectively.
The deviations with their estimated uncertainties are listed in Table 3 and are shown in the two-color correlation diagram in Figure 3. Since light-curve variations appeared to be larger within the innermost primary eclipses, the deviations within the phase interval are marked in Figure 3 as filled circles. The red-color variations appeared to be very large and poorly correlated with the blue variations in the deepest parts of the primary eclipses. However, we note that the seasonal light curves in both filters were particularly poorly defined exactly within the phases of the deepest primary eclipse.
The two color variations at the phases outside of the interval , 324 in number, correlate moderately well with the correlation coefficients: Spearman , Kendall (rank): . A least-squares (LSQ) fit to the deviations assuming the errors to affect both coordinates, with weights calculated from the error estimates as described above, gave: . This result is confirmed by the bootstrap technique (repeated multiple LSQ solutions with random data sampling): . It is well recognized that the LSQ is sensitive to outliers; a more robust estimate can be provided by the least-absolute-deviation (LAD) technique. The LAD does not provide algorithmic estimates of the parameter errors, so that a standard approach to handle the outliers in both coordinates is mutual inversion of coordinates as independent variable. The LAD fits are: for the direct solution versus (orientation as in Figure 3), and from the inverted solution ( as the independent variable), after the back-transformation of the variables. The three fits are shown in Figure 3 as lines with the LAD results bracketing the LSQ fit. We believe that the spread of the two LAD solutions is more representative of the level of uncertainty in this problem than the LSQ errors so that slope close to one is not fully excluded, although the formal result – which definitely requires observational confirmation – is that the blue filter light-curve variations are smaller than those in the red. Although this result may be considered as unexpected in view of the blue color of the star, we should note that Hubeny & Plavec (1991) in their careful analysis of spectrophotometric properties of the complex spectrum of Lyr assigned a cooler spectral component – identified as having A8 II characteristics – to be produced at the rim of the accretion disk. Thus, any instabilities produced by the ongoing accretion and taking place at or within the rim may be expected to be redder than the average color of the binary system which is dominated by the B6-8 II bright giant. If our finding is repeated by more extensive observations, this will be a confirmation that by studying the light-curve variations we almost directly see the accretion phenomena in Lyr.
5 Conclusions
The 2018 data for Lyr were less uniform than the red-filter data analyzed in Paper I and thus did not permit an equally extensive variability analysis as in that paper. But they offered a first look – unfortunately only during three orbital cycles of the binary – into the mutual relation of the two-color light-curve variations in the dominant range of the temporal scales of 0.65 – 4 days. Most interestingly, the blue-band variations appear to have smaller amplitudes than the red variations, although this result definitely needs confirmation. In 2016, the blue-filter satellite BLb was not functional at that time so that we had no choice but to base the analysis for Paper I solely on the red-filter data from the BTr satellite. These data were extensive and uniform, but suffered from an unwelcome and initially puzzling amplitude problem, later explained by a CTI instrumental effect. Yet – if the larger amplitude of the variation is confirmed – these data have been fortuitously obtained in the better-suited of the two available spectral ranges. The result of the diminished magnitude of the blue light curve variations compared with the red ones is new and definitely must be verified observationally by more extensive observations. In terms of a possible physical explanation, the effect is in agreement with the rim of the Lyr secondary-component accretion disk as a location for the light-curve variability.
The 2018 data for the red-filter satellite BTr fully confirm the validity of the assumed corrections for the instrumental CTI effect as applied in Paper I to the 2016 data.
References
- Ak et al. (2007) Ak, H., Chadima, P., Harmanec, P.,, Demircan, O., Yang, S., Koubsky, P., Škoda, P., Šlechta, M., Wolf, M., Božić, H., , Ruždjak, D., & Sudar, D. 2007, A&A, 463, 233
- Hubeny & Plavec (1991) Hubeny, I. & Plavec, M. 1991, AJ, 102, 1156
- Pablo et al. (2016) Pablo, H., Whittaker, G. N., Popowicz, A., Mochnacki, S. M., et al. 2016, PASP, 128, 125001
- Pigulski et al. (2018) Pigulski, A, Popowicz, A., Kuschnig, R. 2018, 3rd BRITE Science Conference, Lac Taureau, Canada, eds. G. A. Wade, D. Baade, J. A. Guzik, R. Smolec (Polish Astron. Soc., Warsaw), 8, 106;
- Popowicz et al. (2017) Popowicz, A., Pigulski, A., Bernacki, K., Kuschnig, R., et al. 2017, A&A, 605, A26
- Popowicz (2018) Popowicz, A. 2018, Sensors, 18(2), 479
- Rucinski et al. (2018) Rucinski, S. M., Pigulski, A., Popowicz, A., Kuschnig, R. et al. 2018, AJ, 156, 12
- Van Hamme at al. (1995) Van Hamme, W., Wilson, R. E. & Guinan, E. F. 1995, AJ, 110, 1350
- Weiss et al. (2014) Weiss, W. W., Rucinski, S. M., Moffat, A. F. J., Schwarzenberg-Czerny, A., et al. 2014, PASP, 126, 573
———————————————————————————
| Sat | |||||
|---|---|---|---|---|---|
| (1) | (2) | (3) | (4) | (5) | (6) |
| 1 | 2274.6697 | 0.4110 | 3.4914 | 0.0016 | 29 |
| 1 | 2274.7375 | 0.4163 | 3.5055 | 0.0009 | 26 |
| 1 | 2274.8057 | 0.4216 | 3.5209 | 0.0015 | 29 |
| 1 | 2274.8740 | 0.4268 | 3.5317 | 0.0021 | 30 |
| 1 | 2274.9424 | 0.4321 | 3.5485 | 0.0017 | 28 |
Note. — The columns: (1) The satellite code (1 = BTr, 2 = BHr, 3 = BLb). (2) Time : The mean heliocentric time . (3) : The binary orbital phase calculated using the locally linear elements based on the quadratic ephemeris by Ak et al. (2007) for : and d. (4) : The magnitude with an arbitrary zero point from the BRITE pipeline processing. (5) : The error of from the scatter of individual observations. (6) : The number of averaged observations.
The data consist of the satellite setups partitioned at:
BTr: ;
BHr: ;
BLb: .
The table is published in its entirety in machine-readable format. A portion is shown here for guidance regarding its form and content.
| Sat | ||||
|---|---|---|---|---|
| 1 | 0.0041 | 4.0211 | 0.0120 | 6 |
| 1 | 0.0147 | 4.0335 | 0.0096 | 5 |
| 1 | 0.0252 | 4.0462 | 0.0102 | 8 |
| 1 | 0.0359 | 4.0018 | 0.0167 | 7 |
| 1 | 0.0457 | 3.9527 | 0.0127 | 11 |
Note. — (1) The satellite code (1 = BTr, 2 = BHr, 3 = BLb). (2) : The average orbital phase of the binary in intervals of 0.01 in phase. The phases are calculated using the linear elements as given in Table 1. (3) : The mean magnitude with an arbitrary zero point from the BRITE pipeline processing. (4) : The error of from the scatter of points in phase interval of 0.01. (5) : The number of averaged observations.
The table is published in its entirety in machine-readable format. A portion is shown here for guidance regarding its form and content.
| 2349.1575 | 0.1658 | 0.0073 | 0.0063 | ||
| 2349.2271 | 0.1711 | 0.0070 | 0.0059 | ||
| 2349.2961 | 0.1765 | 0.0070 | 0.0047 | ||
| 2349.3652 | 0.1818 | 0.0070 | 0.0047 | ||
| 2349.4341 | 0.1871 | 0.0071 | 0.0045 |
Note. — (1) Time : Mean heliocentric time . (2) : The Lyr orbital phase calculated for the linear elements as in Table 1. (3)–(4) and : Deviation of the observed value of the flux from the seasonal light curve in the red color and its estimated uncertainty as observed by the BTr satellite. (4) and : Deviation of the observed value of the flux from the seasonal light curve in the blue color and its estimated uncertainty as observed by the BLb satellite.
The fluxes have been normalized to unity at the maximum brightness of the binary system for each spectral band assuming and 3.515 for the BTr and BLb satellites, respectively.
The table is published in its entirety in machine-readable format. A portion is shown here for guidance regarding its form and content.