Kinetics and clustering of dust particles in supersonic turbulence with self-gravity
keywords:
hydrodynamics — turbulence — ISM: dust, extinctionLars Mattsson
1 Hydrodynamic simulations with particles
We present a simulation of isothermal supersonic (rms Mach number ) turbulent gas with inertial particles (dust) and self-gravity in statistical steady-state (S3G), which we compare with a corresponding simulation without self-gravity (S3), similar to those in Mattsson et al. (2019). The computational domains are 3D boxes () with periodic boundaries and sides of equal length , where we solve the compressible Navier-Stokes equations with stochastic forcing. We use the Pencil Code, a high-order finite difference code capable of simulating compressible flows with inertial particles (Brandenburg & Dobler, 2002).
The gas flow is characterized by the density and the flow velocity . Dust-particle velocities are followed using a Lagrangian equation of motion (EOM) for each particle ( discrete inertial particles in 10 size bins with particles). Grain-sizes are charachterized by ,where is the grain radius and is the bulk material density (Hopkins & Lee, 2016). Without self-gravity, the simulation can thus be scaled arbitrarily. S3G, however, is not scale-free. It is in steady state, but close to gravitationally unstable, since we adopt a Jeans wavelength, , which provides the strongest influence of gravity on the dynamics of gas and dust without causing irreversible gravitational collapses.
2 Results and directions for further study
2.1 Mean velocities and clustering
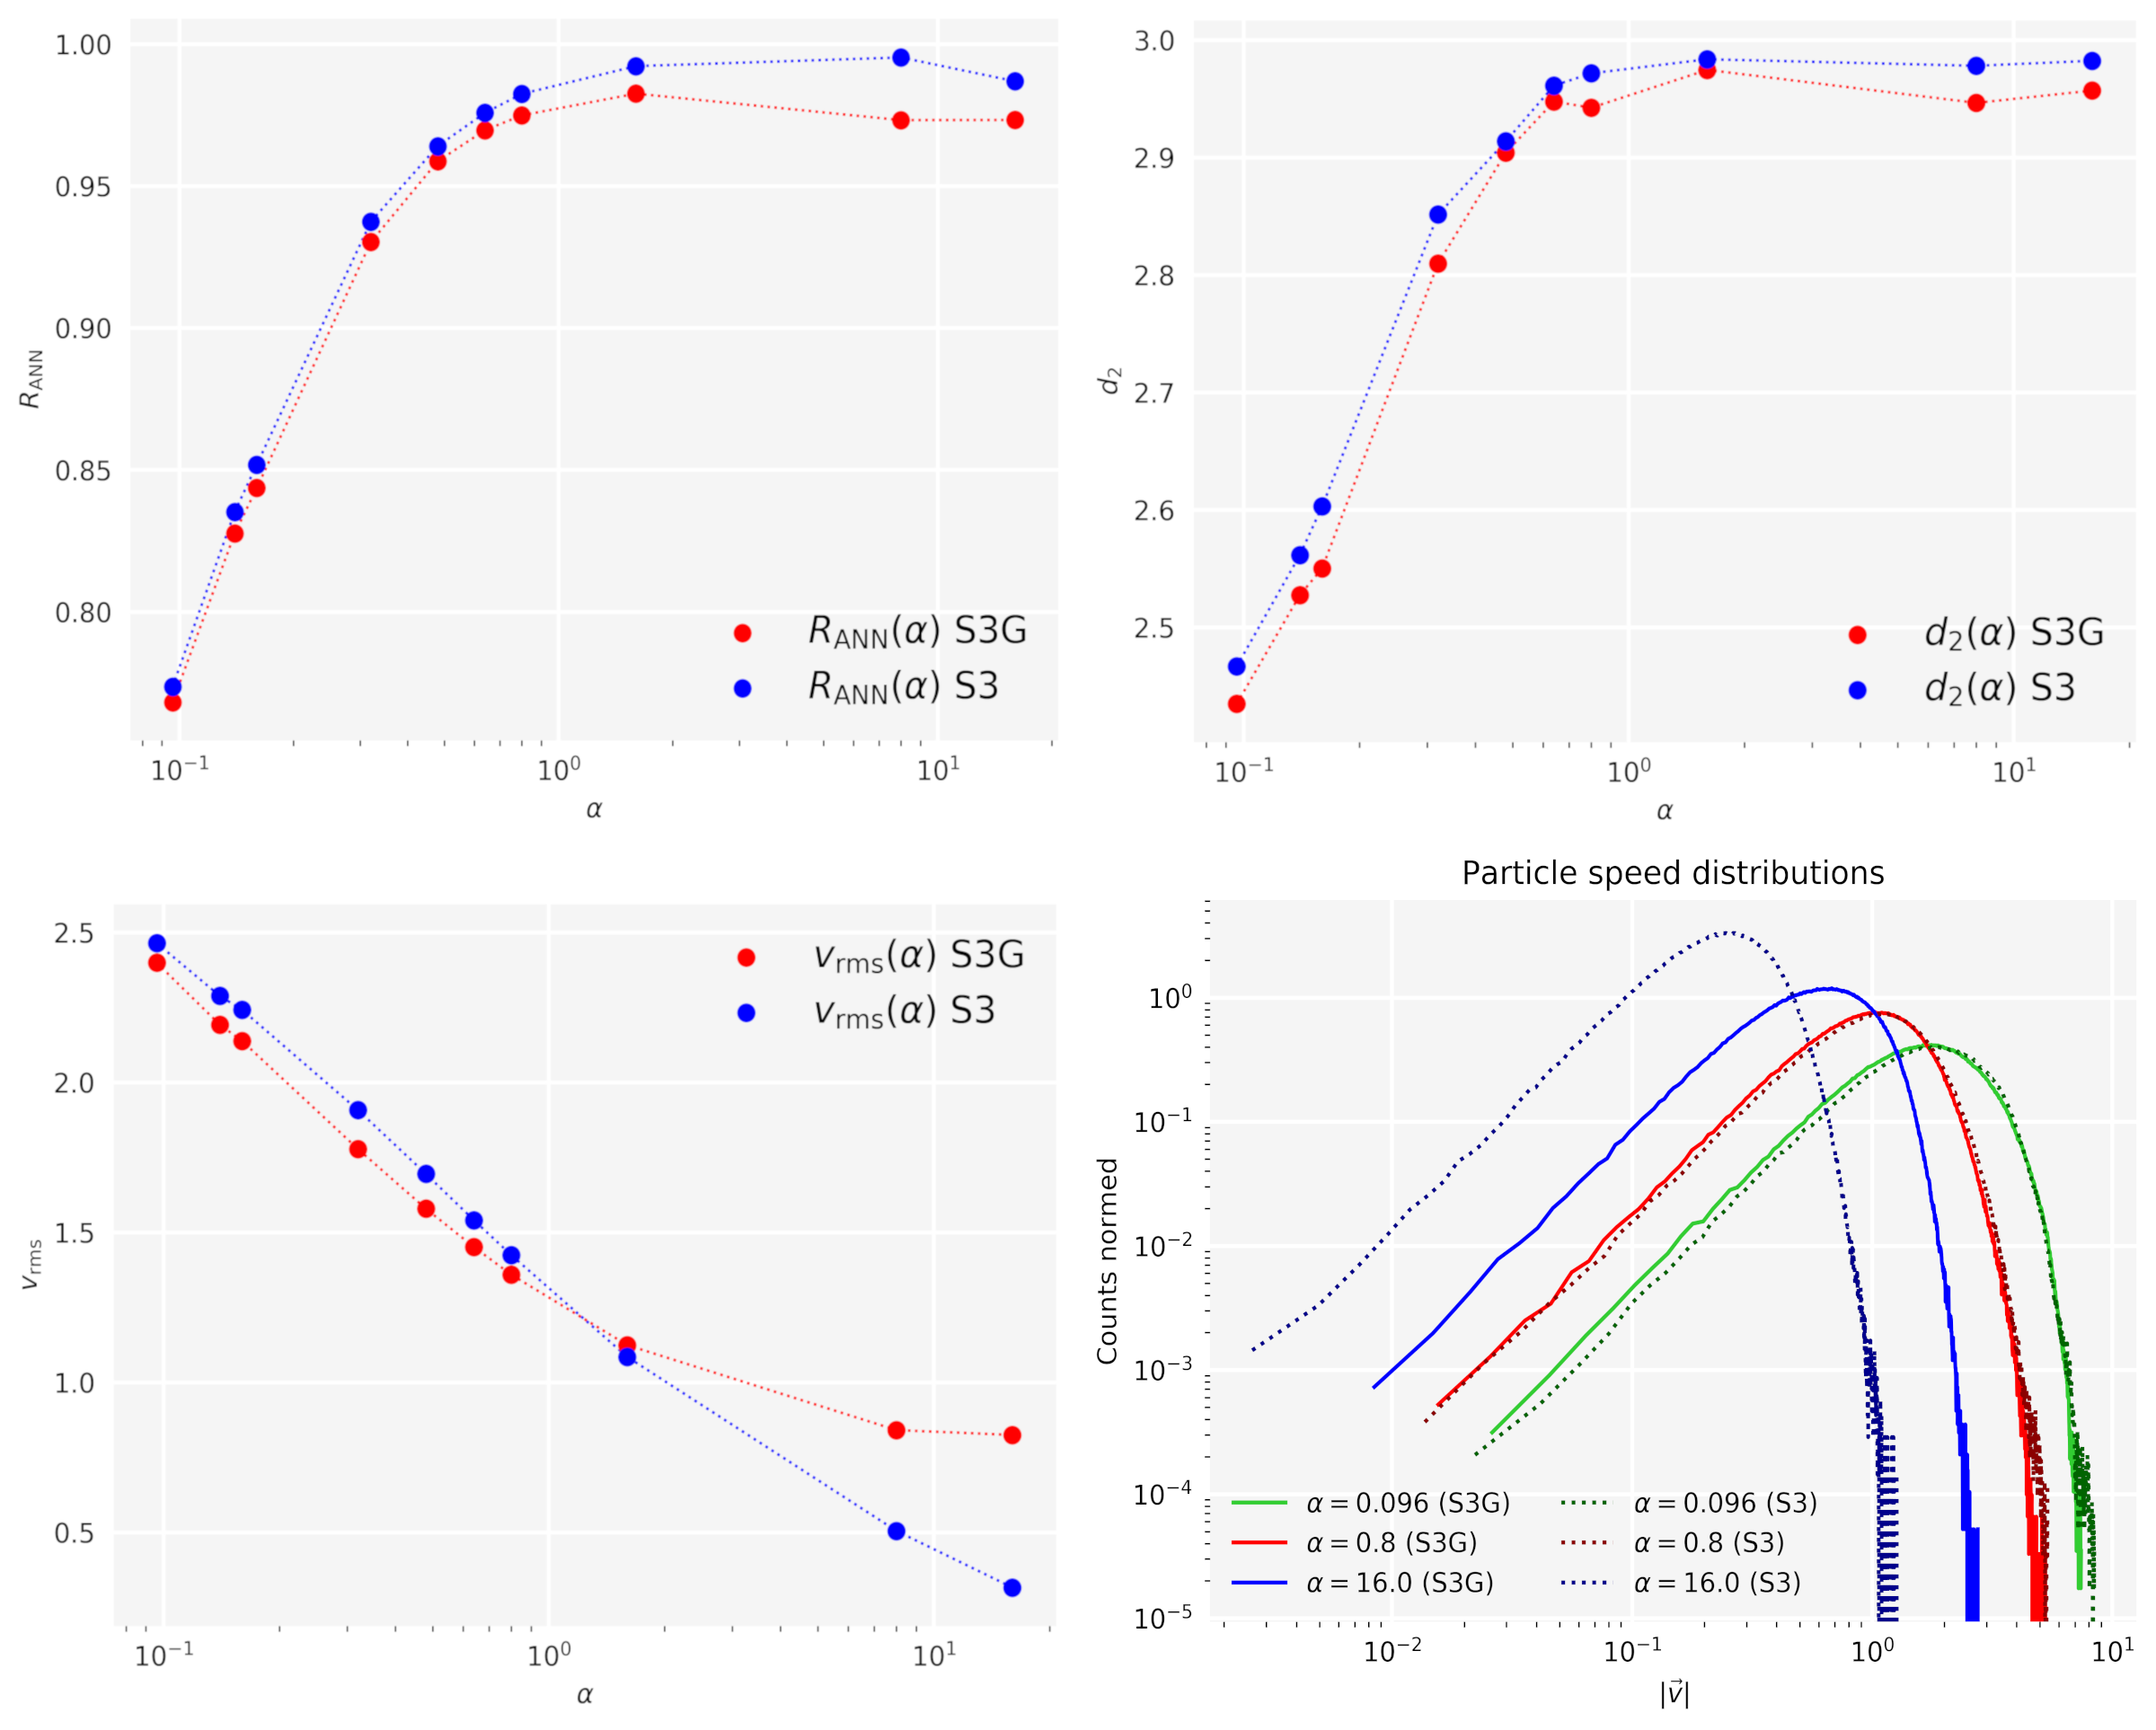
Clustering of particles can be quantified by their first nearest neighbor distance (1-NND) (Monchaux et al., 2012). We compare the measured average 1-NND to that expected from a random isotropic distribution . This average nearest neighbor ratio, , is for unclustered grains. If the particles are clustered, since the average 1-NND is lower. We must distinguish between compaction and fractal clustering, where the latter is due to rotation of the flow rather than compression. Fractal clustering is usually measured by the correlation dimension , where is the expected number of particles inside a ball of radius surrounding a test particle at the centre of the ball.
Fig. 1 (lower left) shows that root-mean-square (rms) grain velocities depend on particle size, since lighter particles couple better to the gas due to lower inertia than heavier particles. and (Fig. 1, left panels) are also determined by particle size, except for . Particles coupled to a turbulent gas will experience a higher degree of fractal clustering (low ) since they get temporarily trapped in vortices and may therefore accumulate in convergence zones in between vortices as they are being expelled (Mattsson et al., 2019).
2.2 The influence of gravity
Comparing S3G and S3, we find that self-gravity does not cause any significant increase in clustering, as determined by and the correlation dimension (), regardless of particle size (Fig. 1, upper panels). However, there is a brief initial phase of strong clustering for in both simulations, but much more prominent in S3G where particles are also gravitationally accelerated. With more inertia, and thus less affected by drag, heavier particles free-fall and cluster faster than lighter particles coupling to the turbulent gas.
When a steady state is reached, is a function of , which can be derived from the EOM,
| (1) |
where is the gravitational potential and the stopping time , defining the coupling efficiency between gas and dust particles, is given by (Draine & Salpeter, 1979),
| (2) |
Note that explains why there is no significant change in velocities for the small particles (kinetic drag dominates). Fig. 1 (lower left) shows that only heavy particles () show elevated in the presence of self-gravity and the speed distributions (lower right) are significantly affected for (distributions are shifted to higher values in S3G compared to S3). For the rms-velocity increases from to 0.84 (62%) and for , rises to 0.83 152%).
The stopping time differs by a factor of between the smallest and the largest particles. Acceleration due to gravity becomes the dominant force for sufficiently large particles, which explains the discrepancies seen in Fig. 1. To describe the difference in velocities between S3G and S3, we note that satisfies a realtion , with . Assuming is a function of only, (1) and statistical steady-state yields,
| (3) |
where terms within brackets are squares of the rms values of total and gravitational acceleration ( and , respectively). First, we note that in the tracer-particle limit (very small grains; ), . Second, for larger particles, as a function of must reach a minimum and then rise again because and must be a bounded function of . Thus, must also be a bounded function. For large grains, , as in (2), is actually limited by and will approach an arbitrary finite value as approaches its upper limit. Obviously, plays a role here and for simple scalings suggest that reaches its minimum for and approach a finite value for really large grains, possibly exceeding . More and extended simulations will likely confirm or disprove this idea.
References
- Brandenburg & Dobler (2002) Brandenburg, A., & Dobler, W. 2002, Computer Physics Communications, 147, 471
- Draine & Salpeter (1979) Draine, B. T., & Salpeter, E. E. 1979, ApJ, 231, 438
- Hopkins & Lee (2016) Hopkins, P. F., & Lee, H. 2016, MNRAS, 456, 4174
- Mattsson et al. (2019) Mattsson, L., Bhatnagar, A., Gent, F. A., & Villarroel, B. 2019, MNRAS, 483, 5623
- Monchaux et al. (2012) Monchaux, R., Bourgoin, M., & Cartellier, A. 2012, International Journal of Multiphase Flow, 40, 1