Double-peaked OI profile: a likely signature of the gaseous ring around KH 15D
Abstract
KH 15D is a well-known spectroscopic binary because of its unique and dramatic photometric variability. The variability is explained by a circumbinary dust ring but the ring itself was never directly detected. We present a new interpretation of the double-peaked [O I] 6300 profiles as originating from the hot disk surface of KH 15D. By modeling these profiles, we measure emitting radii between 0.5–5 au, basically a gaseous ring very similar in radial extent to the dust ring inferred from modeling the system’s photometric variability. We also discuss the possibility that external photoevaporation driven by UV photons from the nearby massive star HD 47887 has truncated the outer edge of the disk to the observed value.
1 Introduction
KH 15D is a pre-main sequence (PMS) spectroscopic binary (A+B) with near-equal-mass components (0.715 for Star A and 0.74 for Star B), high eccentricity (), a semi-major axis of 0.25 au, and a period of 48.37 days (Johnson et al., 2004; Winn et al., 2006; Aronow et al., 2018). It is a member of the NGC 2264 cluster which is at pc, based on the members from Venuti et al. 2018 and Gaia Data Release 2 parallaxes, and the cluster is about 2–6 Myr old (Naylor, 2009; Lim et al., 2016). KH 15D exhibits unique and dramatic long and short term photometric variability (e.g., Capelo et al. 2012). From 2006 to 2009 Star B was fully occulted while after 2010 Star A became occulted; currently, the entirety of Star B is visible at each apastron passage (Aronow et al., 2018) The short-term variability has the same period as the binary (Kearns & Herbst, 1998; Hamilton et al., 2001; Herbst et al., 2002; Johnson et al., 2004). However, the large depth (several magnitudes) and long duration (days to tens of days) of the eclipse, in combination with the time variability, cannot be solely attributed to the binary. Additional occultation by circumbinary matter must be invoked (Hamilton et al., 2001; Herbst et al., 2002).
A nearly edge-on, warped and precessing circumbinary ring of dust (1 to 5 au) is thought to occult the eccentric PMS binary and explain the available light curves (Chiang & Murray-Clay, 2004; Winn et al., 2004). However, the circumbinary disk eluded detection. The system shows no infrared excess emission out to 8 (Arulanantham et al., 2016), in line with the relatively large inner dust edge. In addition, the dust ring has not been detected at millimeter wavelengths with SMA or ALMA. The millimeter observations have yielded upper limits on the total (gas+dust) circumbinary disk mass of 1.7 (Aronow et al., 2018), just a factor of lower than the mean protoplanetary disk mass in young (1-3 Myr) star-forming regions (e.g., Ansdell et al. 2016, Pascucci et al. 2016). Interestingly, the SMA CO line reveals a bipolar collimated outflow, the northern lobe of which is spatially coincident with the H2 jet associated with KH 15D (Tokunaga et al., 2004; Aronow et al., 2018). Finally, the system presents broad H line profiles, indicative of active accretion (Hamilton et al., 2012), perhaps funneled from gas surrounding both stars (see the case of the spectroscopic binary DQ Tau, Muzerolle et al. 2019). The presence of a jet and ongoing accretion point to the presence of a gaseous disk.
Here, we interpret the double-peaked [O I] 6300 profiles from KH 15D as originating from the surface of this gaseous disk (2). Modeling of the line profiles reveals that the emitting gas is radially confined (3). We discuss how external photoevaporation could have truncated the gaseous disk to the outer edge inferred from our [O I] 6300 modeling (4).
2 Double peaked [O I] 6300 profiles
The spectroscopic data presented in this work were obtained from the VLT/UVES ESO archive for 3 nights in 2001 and 6 nights in 2004 with a spectral resolution of 42,000 and have been already published in Hamilton et al. (2003); Mundt et al. (2010); Hamilton et al. (2012). We extracted the raw data from the ESO archive111Based on observations collected at the European Southern Observatory under ESO programmes 267.C-5736(A) and 074.C-0604(A). and reduced them with the ESO UVES pipelines under the ESO Recipe Flexible Execution Workbench environment (Freudling et al., 2013). We obtain 21 spectra that cover both [O I] 6300 and H lines. The 2001 December 14 and 21 and the 2004 December 16–18 (UT) spectra were taken during Star A eclipse phase, the spectrum acquired on 2001 December 29 was out of eclipse, and the spectra obtained on 2004 December 13–15 were approaching Star A eclipse phase (Mundt et al., 2010; Hamilton et al., 2012).
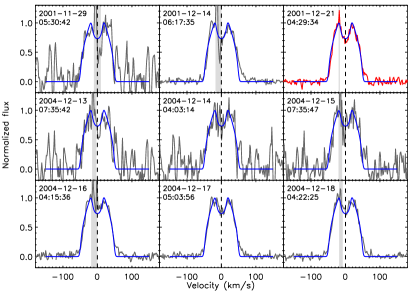
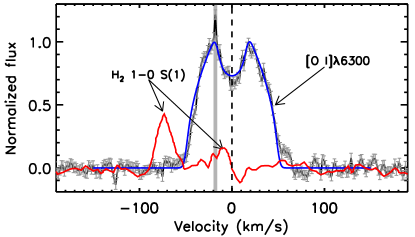
We removed telluric absorption and subtracted photospheric features near the [O I] 6300 and H lines using a K7 PMS template (see e.g., Fang et al. 2018 for details). We adopted a heliocentric radial velocity =18.676 km s-1 as the the systemic velocity (Mundt et al., 2010; Hamilton et al., 2012). This value is consistent with the error-weighted mean radial velocity (19.40.1 km s-1) of other NGC 2264 cluster members (Kounkel et al., 2016). We shifted the [O I] 6300 lines to the systemic velocity and present the spectrum with the highest S/N, the one obtained on 2001 December 21, in Fig. 1. Individual H and [O I] 6300 profiles are shown in Figs. 2 and 5.
The [O I] 6300 emission shows the same double-peaked profile at all observing epochs. Note that the sharp blue-shifted spikes in some profiles are due to sky contamination because: (1) they are truly spikes, i.e. their width is much narrower than the spectral resolution (7 km s-1); (2) sky lines peak near these spikes and, as they get stronger, so do the spikes; (3) for four spectra taken in 2001 covering also the [O I] 5577 line, we detect the same strong and sharp spikes we see in the [O I] 6300 profiles. The background H line, produced mostly by the HII region (Cone Nebula) around KH 15D, is also present but the ratio of its intensity to the source emission is much smaller than the sky lines at the [O I] 6300 emission. This explains why we do not see such spikes in the reduced H profiles (see Fig. 2).
The [O I] 6300 profiles for KH15D differ from those found in most accreting T Tauri stars (TTS). In TTS with higher accretion luminosity the [O I] 6300 profiles typically show both a high velocity component (usually but not exclusively blueshifted) attributed to a jet and a low velocity component (LVC) which is also often blueshifted (Hartigan et al., 1995). The low velocity component is found in a broader range of TTS, including those with low accretion luminosity and transition disks, and itself can consist of both a broad and a narrow component, which have been attributed to slow disk winds from the inner or outer disk, respectively (Hartigan et al., 1995; Simon et al., 2016; Fang et al., 2018; Banzatti et al., 2019). In some cases, the low velocity component is centered on the stellar velocity, and may be bound material on the surface of the disk, see e.g. Fig. 24 in Simon et al. (2016). The low velocity components are always single peaked and have line widths that correlate with disk inclination, indicative of broadening by Keplerian rotation.
The [O I] 6300 profile in KH 15D is distinctive from other TTS. The profile shows symmetric red and blue peaks222We have mirrored and the subtracted the original spectrum in Fig. 1 and find no asymmetry greater than three times the rms next to the line. at radial velocities of 20 km s-1 and looks similar over multiple epochs 333 Note that the claimed factor of decrease in the [O I] 6300 flux on 2001 December 20 (Mundt et al., 2010; Hamilton et al., 2012) is likely spurious. The ESO archive does not contain any spectrum acquired on that date. Instead, most likely, the correct spectrum is the one obtained on December 21st, the line profile is the same as in Mundt et al. (2010). Because KH 15D brightened by 0.77 magnitude in the band from December 20 to 21 (Windemuth & Herbst, 2014) and this magnitude is used to convert the line equivalent width into flux, an incorrect assignment of the R band can explain the factor of underestimation in the [O I] 6300 flux.. While such low velocities are characteristic of TTS low velocity components, no other low velocity components to date have shown a double peaked structure. A jet close to the plane of the sky can have low radial velocities, as can be inferred for some TTS where line ratios for several forbidden lines reveal properties characteristic of shocked, rather than thermally excited, gas for a few sources that would be classified as LVC based on their kinematic properties (Fang et al., 2018). This is the interpretation proposed by Mundt et al. (2010), that the [O I] 6300 profile from KH 15D arises in a pair of identical approaching and receding jets in the plane of the sky. However, in this interpretation we would expect to see variable profiles at different epochs as noticed in other TTS (Simon et al., 2016). Therefore, we put forward an alternate possibility, informed by recent work on TTS forbidden lines, that the [O I] 6300 traces the surface of a disk and is broadened by Keplerian rotation. Its double peaked structure, unlike other LVC in TTS, would result from the fact that the disk is more like a ring, rather than extended beyond 5 au, as required to fill in the central dip in most TTS (Hartigan et al., 1995; Simon et al., 2016).
3 H profiles
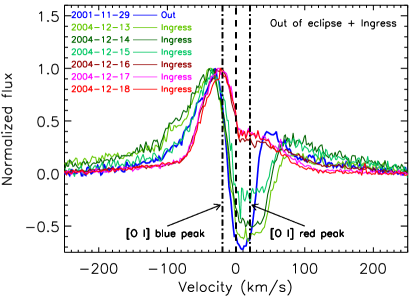
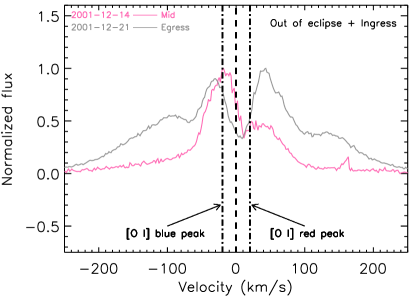
An extensive analysis of H profiles and associated emission variability is provided in Hamilton et al. (2012). The analyzed spectra covered five contiguous observing seasons (from 2001 to 2006) over which star A was fully visible as well as partially occulted (in ingress and egress events) and fully occulted. Some of these spectra are the same from which we have extracted the [O I] 6300 profiles and are presented in Fig. 2 in order to emphasize the difference in the line profiles of H and [O I] 6300.
The out of eclipse and ingress spectra (left panel) are characterized by an inverse P-Cygni-type profile with a strong redshifted absorption whose changes in centroid velocity can be explained by an accretion stream onto A (Hamilton et al., 2012). The eclipse and egress spectra (right panel) present a more symmetric profile with often more pronounced broad extended wings (up to several hundreds km s-1), which are characteristic of actively accreting stars. Additional spectra in this phase can be seen in Fig. 9 of Hamilton et al. (2012). Mundt et al. (2010) interpreted the eclipse profiles as tracing the same bipolar jet as [O I] 6300 since H also shows red and blue peaks, although the blue/red intensity is quite variable and the velocities somewhat higher than [O I] 6300. Alternatively, we might still be seeing accretion onto A (and perhaps A+B) through reflected light from the back of the wall of the circumbinary disk. This could explain the similarity of some ingress and mid-eclipse H profiles and has been proposed by Hamilton et al. (2012) to explain the presence of the broad wings during these phases.
While a detailed analysis of the H profiles is beyond the scope of this work, we draw the reader’s attention to the difference between the H and [O I] 6300 profiles. While the H profiles, even during eclipse, are mostly asymmetric and variable in flux, the [O I] 6300 profiles are persistently more symmetric through all the phases (Fig. 5) and show only minor variations in flux (Fig. 1 in Mundt et al. 2010). This is different from the [O I] 6300 emission tracing jets which shows strongly variable line intensities and profiles as the emission arises in time variable knots of shocked gas (e.g., Hartigan et al. 2011, Simon et al. 2016.) Therefore, our preferred explanation is that the two lines trace different phenomena, with the [O I] 6300, being more stable, probing the surface of the gaseous circumbinary disk.
4 A circumbinary gaseous ring
Here, we explore the possibility that the [O I] 6300 emission originates from the surface of a circumbinary gaseous disk and use the line profile to constrain its size. In the assumption of Keplerian broadening, the 40 km s-1 separation of the two peaks points to a characteristic [O I] emitting radius of 3 au, consistent with the mean circumstellar dust ring radius inferred from modeling the photometric variability of KH 15D (Chiang & Murray-Clay, 2004).
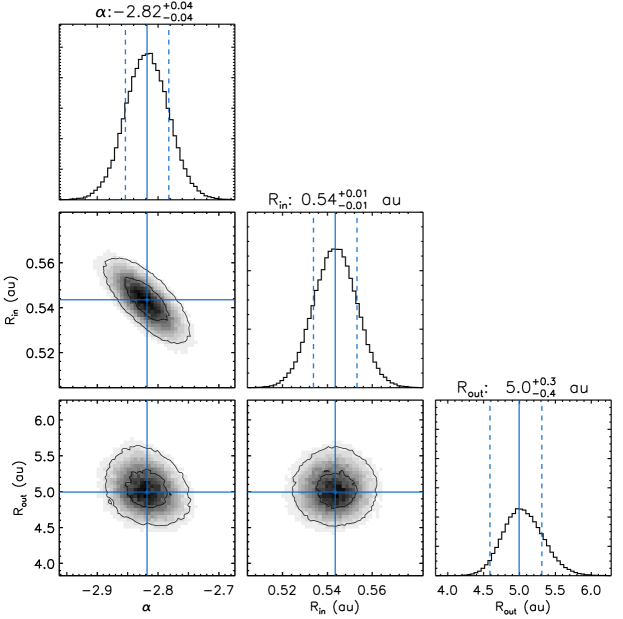
To model in more depth the entire line profile, we adopt a power-law distribution for the O I surface density: I), where is the radial distance from the star. We assume optically thin emission and an edge-on () disk for simplicity, since (1) photometric variability points to such high disk inclination (Herbst et al., 2002) and (2) the [O I] 6300 line profile is nearly symmetric with two peaks (see Fig. 1). The line modeling includes thermal broadening for a temperature of 5,000 K (Simon et al., 2016) and convolution with the instrumental width of 7 km s-1. We vary from to 4, the inner disk radius () from 0.05 to 2.55 au and outer radius () from out to 13 au to perform a grid search and find the parameters leading to the lowest reduced . We focus the fit on the [O I] 6300 line profile obtained during the night of 2001 December 21 because of its high S/N. We further normalize the observed line profile to its peak and fit it with modelled line profiles that are similarly normalized to their peaks. From this grid search we find the following best-fit parameters: , =0.57 au, and =5.2 au. We also implement a Markov Chain Monte Carlo (MCMC) procedure (Sharma, 2017) to find the best-fit parameters and evaluate their uncertainties. The posterior distributions with the best-fit parameters and their uncertainties are shown in Fig. 3. These values are consistent with those obtained through the grid search. Note that this best fit profile to the 2001 December 21 spectrum reproduces rather well all the other profiles (see Fig. 1 and 5), again highlighting the temporal stability of the [O I] 6300 emission.
It is also worth noting that the [O I] 6300 surface brightness distribution follows a rather steep power law: , in comparison to other disks (Hartigan et al., 1995; Simon et al., 2016). As pointed out in Hartigan et al. (1995), a steep power law index of 3 is expected if the emission is proportional to the flux from the central star and the disk is flat. Thus, our modeling results further support a disk origin. Interestingly, the inner and outer gas disk radii inferred from the [O I] emission are very close to those of the dust ring derived from light curve modeling (see also next Section). These results together point to a disk with a relatively large inner radius and a very small outer radius, a circumbinary ring of gas.
Meijerink et al. (2012) investigated the effect of high-energy stellar photons on the disk structure and the gas chemical composition by varying the X-ray radiation from 0 to 1032 erg s-1 and the FUV from 1029 to 1032 erg s-1. Their calculations show that there exists a radially extended hot (5000 K) region on top of the disk surface444from 0.2 at r0.6 au to 0.5 at r5 au, where is the disk vertical height and is the radial distance from the star with hydrogen densities of cm-3. The [O I] 6300 line should be tracing this region.
Mundt et al. (2010) claim that there is a slight blue asymmetry (14%) in the [O I] 6300 line profiles. For a system like the KH 15D with a close binary, the [O I] emitting regions can be disturbed by the time varying potential of the binary system (Thun et al., 2017), causing some variability and asymmetry in the [O I] 6300 line profile as proposed by Mundt et al. (2010). However, as discussed in Sect. 2, the blue part of [O I] 6300 line profile is also contaminated by sky lines, hence changes restricted to a narrow range of velocities close to the sky lines should be interpreted with caution. Excluding these, likely spurious, features we do not identify any asymmetry in the highest S/N [O I] 6300 profile.
5 Inner and outer truncation of the disk
Several theoretical papers have shown that the inner region of a disk surrounding a close binary is quickly dissipated (e.g., Lin & Papaloizou 1993; Artymowicz & Lubow 1994). Recently, Pichardo et al. (2008) carried out numerous simulations, using the test particle approah, to derive a simple relation between the gap radius and binary semi-major axis (), eccentricity (), and primary/companion mass ratios (): . For the KH 15D system, 0.25 au, 0.6, and 0.83–0.97 (Winn et al., 2006; Aronow et al., 2018), thus the disk inner radius is expected to be at 0.8 au according to these simulations. However, as shown in the more detailed physical models of Muñoz & Lai (2016) and Muñoz et al. (2019) , it is actually difficult to define the cavity radius for an eccentric binary, as gas from the circumbinary disk flows in generating complex and transit streams. Therefore, we consider our estimate of au from modeling the [O I] 6300 line pretty close to the possible cavity radius.
Chiang & Murray-Clay (2004) argued that the disk of KH 15D cannot extend beyond 5 au to maintain rigid precession and explain the long-term photometric variability of the system (but see Lodato & Facchini 2013 for the possibility of the disk extending to 5–10 au). Recently, Arulanantham et al. (2016) confirmed the rigid precession of the ring and estimated a velocity (across the sky) of 15 m s-1 for the projected edge of the ring. Then, the precession rate of the ascending node of the ring can be estimated to be 018 yr-1/, where is mean radius of the circumbinary ring in . Using the approximate expression relating the precession rate of ascending node of an inclined circumbinary ring to the mean ring radius from Chiang & Murray-Clay (2004), the masses (0.715 and 0.74 Aronow et al. 2018) and orbit (0.25 au, Winn et al. 2004) of the binary, the mean radius of the ring should be 4 au. This value is also close to the characteristic [O I] 6300 emitting radius, see Sect. 4.
Preventing the outer boundary from viscous spreading may require some sort of outside confinement. Chiang & Murray-Clay (2004) proposed a planet exterior to the ring. Here, we explore external photoevaporation as an alternative. At a projected separation of 37′′, south-west from KH 15D, there is a massive star HD 47887 (=240001000K, Fossati et al. 2014). Based on Gaia Data Release 2, KH 15D and HD 47887 have similar parallaxes (1.26910.0751 mas vs. 1.32720.0751 mas). Thus, it is very likely that both of them belong to the NGC 2264 cluster. With a distance from us of 750 pc, the projected distance between them is 0.135 pc.
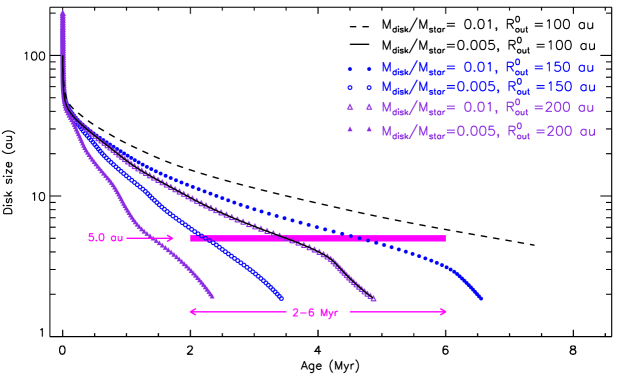
Taking this projected distance, the model atmosphere from Lanz & Hubeny (2007), and the broad-band photometry from Kharchenko (2001), the UV field strength near KH 15D produced by HD 47887 is 4470 555G0 is the Habing unit of UV radiation corresponding to the integrated flux (1.6 erg-1 cm-2 s-1) over the wavelength range 912Å to 2400Å used in Haworth et al. (2018).. Under such UV field strength (4470 ), we make a toy model to assess the timescale for dissipating the outer disk of KH 15D as close in as 5 au. In the models, the initial disk sizes are set to be 100, 150, or 200 au, disk masses are 0.0075 or 0.015 (0.5% or 1% of the KH 15D system mass), and the inner disk radius is fixed to be 0.1 au. The disk material has a surface density , and the central binary is simplified as one single star with a mass of 1.5 . Furthermore, we assume that the bulk of the mass loss due to external photoevaporation is driven from the disk outer edge, as in Haworth et al. (2018), and neglect the disk viscous evolution. We interpolate the disk mass-loss rates within the UV field strength of 4470 during the disk dissipation using the FRIED grid of mass-loss rates for externally irradiated protoplanetary disks (see details in Haworth et al., 2018). The mass-loss rates range from 10-6 to 10-10yr-1 when disk size decrease from hundreds au to 5 au. The resulting disk sizes from our toy models are shown in Fig. 4 as a function of age. Our calculations show that the size of a disk within the UV field strength of 4470 can decrease to 5 au at the age of the cluster (2–6 Myr, Naylor, 2009; Lim et al., 2016). Thus, photoevaporation can explain the outer truncation of the disk.
6 conclusion
We provide a new interpretation to the double-peaked [O I] 6300 emission line as arising from the hot surface of the gaseous disk surrounding the spectroscopic binary KH 15D. Line profile modeling constrains the emission to a relatively narrow radial extent 0.5–5 au, similar to the extent of the dust ring inferred from modeling the source photometric variability. The relatively large inner edge is likely set by the binary dynamical interaction. We show that the small outer disk radius could be shaped by external photoevaporation driven by UV photons from the nearby massive star HD 47887. Newer high signal-to-noise [O I] 6300 line profiles would be useful to further test our interpretation and detect any subtle changes that might arise from disk precession.
References
- Ansdell et al. (2016) Ansdell, M., Williams, J. P., van der Marel, N., et al. 2016, ApJ, 828, 46
- Aronow et al. (2018) Aronow, R. A., Herbst, W., Hughes, A. M., Wilner, D. J., & Winn, J. N. 2018, AJ, 155, 47
- Artymowicz & Lubow (1994) Artymowicz, P., & Lubow, S. H. 1994, ApJ, 421, 651
- Arulanantham et al. (2016) Arulanantham, N. A., Herbst, W., Cody, A. M., et al. 2016, AJ, 151, 90
- Banzatti et al. (2019) Banzatti, A., Pascucci, I., Edwards, S., et al. 2019, ApJ, 870, 76
- Capelo et al. (2012) Capelo, H. L., Herbst, W., Leggett, S. K., Hamilton, C. M., & Johnson, J. A. 2012, ApJ, 757, L18
- Chiang & Murray-Clay (2004) Chiang, E. I., & Murray-Clay, R. A. 2004, ApJ, 607, 913
- Deming et al. (2004) Deming, D., Charbonneau, D., & Harrington, J. 2004, ApJ, 601, L87
- Fang et al. (2018) Fang, M., Pascucci, I., Edwards, S., et al. 2018, ApJ, 868, 28
- Fossati et al. (2014) Fossati, L., Zwintz, K., Castro, N., et al. 2014, A&A, 562, A143
- Freudling et al. (2013) Freudling, W., Romaniello, M., Bramich, D. M., et al. 2013, A&A, 559, A96
- Hamilton et al. (2003) Hamilton, C. M., Herbst, W., Mundt, R., Bailer-Jones, C. A. L., & Johns-Krull, C. M. 2003, ApJ, 591, L45
- Hamilton et al. (2001) Hamilton, C. M., Herbst, W., Shih, C., & Ferro, A. J. 2001, ApJ, 554, L201
- Hamilton et al. (2012) Hamilton, C. M., Johns-Krull, C. M., Mundt, R., Herbst, W., & Winn, J. N. 2012, ApJ, 751, 147
- Hartigan et al. (1995) Hartigan, P., Edwards, S., & Ghandour, L. 1995, ApJ, 452, 736
- Hartigan et al. (2011) Hartigan, P., Frank, A., Foster, J. M., et al. 2011, ApJ, 736, 29
- Haworth et al. (2018) Haworth, T. J., Clarke, C. J., Rahman, W., Winter, A. J., & Facchini, S. 2018, MNRAS, 481, 452
- Herbst et al. (2002) Herbst, W., Hamilton, C. M., Vrba, F. J., et al. 2002, PASP, 114, 1167
- Johnson et al. (2004) Johnson, J. A., Marcy, G. W., Hamilton, C. M., Herbst, W., & Johns-Krull, C. M. 2004, AJ, 128, 1265
- Kearns & Herbst (1998) Kearns, K. E., & Herbst, W. 1998, AJ, 116, 261
- Kharchenko (2001) Kharchenko, N. V. 2001, Kinematika i Fizika Nebesnykh Tel, 17, 409
- Kounkel et al. (2016) Kounkel, M., Hartmann, L., Tobin, J. J., et al. 2016, ApJ, 821, 8
- Lanz & Hubeny (2007) Lanz, T., & Hubeny, I. 2007, ApJS, 169, 83
- Lim et al. (2016) Lim, B., Sung, H., Kim, J. S., et al. 2016, ApJ, 831, 116
- Lin & Papaloizou (1993) Lin, D. N. C., & Papaloizou, J. C. B. 1993, in Protostars and Planets III, ed. E. H. Levy & J. I. Lunine, 749–835
- Lodato & Facchini (2013) Lodato, G., & Facchini, S. 2013, MNRAS, 433, 2157
- Meijerink et al. (2012) Meijerink, R., Aresu, G., Kamp, I., et al. 2012, A&A, 547, A68
- Muñoz & Lai (2016) Muñoz, D. J., & Lai, D. 2016, ApJ, 827, 43
- Muñoz et al. (2019) Muñoz, D. J., Miranda, R., & Lai, D. 2019, ApJ, 871, 84
- Mundt et al. (2010) Mundt, R., Hamilton, C. M., Herbst, W., Johns-Krull, C. M., & Winn, J. N. 2010, ApJ, 708, L5
- Naylor (2009) Naylor, T. 2009, MNRAS, 399, 432
- Pascucci et al. (2016) Pascucci, I., Testi, L., Herczeg, G. J., et al. 2016, ApJ, 831, 125
- Pichardo et al. (2008) Pichardo, B., Sparke, L. S., & Aguilar, L. A. 2008, MNRAS, 391, 815
- Sharma (2017) Sharma, S. 2017, ARA&A, 55, 213
- Simon et al. (2016) Simon, M. N., Pascucci, I., Edwards, S., et al. 2016, ApJ, 831, 169
- Thun et al. (2017) Thun, D., Kley, W., & Picogna, G. 2017, A&A, 604, A102
- Tokunaga et al. (2004) Tokunaga, A. T., Dahm, S., Gässler, W., et al. 2004, ApJ, 601, L91
- Venuti et al. (2018) Venuti, L., Prisinzano, L., Sacco, G. G., et al. 2018, A&A, 609, A10
- Windemuth & Herbst (2014) Windemuth, D., & Herbst, W. 2014, AJ, 147, 9
- Winn et al. (2006) Winn, J. N., Hamilton, C. M., Herbst, W. J., et al. 2006, ApJ, 644, 510
- Winn et al. (2004) Winn, J. N., Holman, M. J., Johnson, J. A., Stanek, K. Z., & Garnavich, P. M. 2004, ApJ, 603, L45
Appendix A Comparison of observed [O I] 6300 line profiles and the model line profile
Figure 5 shows the comparison of the line profiles observed at different epochs (grey lines) with the best-fit model line profile (blue lines). The latter is obtained by fitting the 2001 December 21 profile (outermost right panel). We chose this line profile because (1) it has the highest S/N, and (2) it shows the least contamination from sky lines. The best fit parameters are: , =0.54 au, and =5.0 au, see also Sect. 4.