Alzheimer’s Disease Brain MRI Classification: Challenges and Insights
Abstract
In recent years, many papers have reported state-of-the-art performance on Alzheimer’s Disease classification with MRI scans from the Alzheimer’s Disease Neuroimaging Initiative (ADNI) dataset using convolutional neural networks. However, we discover that when we split the data into training and testing sets at the subject level, we are not able to obtain similar performance, bringing the validity of many of the previous studies into question. Furthermore, we point out that previous works use different subsets of the ADNI data, making comparison across similar works tricky. In this study, we present the results of three splitting methods, discuss the motivations behind their validity, and report our results using all of the available subjects.
1 Introduction
Alzheimer’s Disease is a progressive neurodegenerative disease characterized by cognitive decline and memory loss. It is one of the leading causes of death in the aging population, affecting millions of people around the world. Automatic diagnosis and early detection can help identify high risk cohorts for better treatment planning and improved quality of life Association and others (2017).
Initial works on brain MRI classification rely on domain-specific medical knowledge to compute volumetric segmentation of the brain in order to analyze key components that are strongly correlated with the disease Gerardin et al. (2009); Plant et al. (2010); Bhagwat et al. (2018). With recent advances in deep learning and an increasing number of MRI scans being made public by initiatives such as Alzheimer’s Disease Neuroimaging Initiative (adni.loni.usc.edu) and Open Access Series of Imaging Studies (www.oasis-brains.org), various convolutional neural network (CNN) architectures, including 2D and 3D variants of ResNet, DenseNet, InceptionNet, and VGG models, have been proposed to holistically learn feature representations of the brain Jain et al. (2019); Khvostikov et al. (2018); Korolev et al. (2017); Wang et al. (2018). A patient’s diagnosis in the dataset is typically categorized as Alzheimer’s disease (AD); mild cognitive impairment (MCI); or cognitively normal (CN).
While many previous related works report high accuracy in three-class classification of brain MRI scans from the ADNI dataset, we point out a major issue that puts into question the validity of their results. A number of papers Payan and Montana (2015); Farooq et al. (2017); Wu et al. (2018); Jain et al. (2019) perform classification with training and testing splits done randomly across the brain MRIs, in which the implicit assumption is that the MRIs are independently and identically distributed. As a result, a given patient’s scans from different visits could exist across both the training and testing sets.
We point out that transitions in disease stage occur at a very low frequency in the ADNI dataset, which means that a model can overfit to the brain structure corresponding to an individual patient and not learn the key differences in feature representation among the different disease stages. The model can simply regurgitate patient-level information learned during training and rely on that to obtain good classification results on the test set. We refer to generating the splits by sampling at random from the pool of images, ignoring the patient IDs, as splitting by MRI randomly.
Our main contribution in this study is exploring alternative ways to split the data into training and testing sets such that the evaluation gives valid insights into the performance of the proposed methods.
First, we look at splitting the data by patient, where all of the available visits of a patient are assigned to either the training or testing set, with no patient data split across the two sets. This method is motivated by the use case for automatic diagnosis from MRI scans, where the assumption is that no prior or subsequent patient information is given.
Then, we look at splitting the data by visit history, meaning that the first visits of a patient’s data are used for training, and the th visit is used for testing. This method is motivated by the use case wherein we incorporate MRI scans into personalized trajectory prediction.
Finally, we compare the accuracy of training and testing on sets split randomly by MRI, with the accuracies we obtain using the two aforementioned ways of splitting the training and testing set. We run experiments with both popular 2D models pre-trained on ImageNet, as well as a 22-layer ResNet-based 3D model we built. Unlike many other studies that perform experiments on a subset of the ADNI dataset, our experiments include all of the currently available data from ADNI. Our results suggest that there is still much room for improvement in classifying MRI scans for Alzheimer’s Disease detection.
2 Related Work
Before the current wave of interest in deep learning, the field of neuroimaging relied on domain knowledge to compute some predefined sets of handcrafted metrics on brain MRI scans that reveal details on Alzheimer’s disease progression, such as the amount of tissue shrinkage that has occurred. A common method is to run MRI scans through brain segmentation pipelines, such as FreeSurfer Fischl (2012), to compute values measuring the anatomical structure of the brain, and enter those values into a statistical or machine learning model to classify the state of the brain Gerardin et al. (2009); Plant et al. (2010); Bhagwat et al. (2018).
With the advent of big data and deep learning, convolutional neural network models have become increasingly popular for the task of image classification. While a variety of architectures and training methods have been proposed, the advantages and disadvantages of these design choices are not clear.
Hon and Khan (2017) used the pre-trained 2D VGG model Simonyan and Zisserman (2014) and Inception V4 model Szegedy et al. (2017) to train on a set of 6,400 slices from the axial view of 200 patients’ MRI scans from the OASIS dataset to perform two-class (Normal vs. Alzheimer’s) classification, where 32 slices are extracted from each patient’s MRI scans based on the entropy of the image.
Jain et al. (2019) followed a similar approach using a 2D VGG model Simonyan and Zisserman (2014) on the ADNI dataset to train on a set of 4,800 brain images augmented from 150 subjects’ scans. For each subject’s scan, they selected 32 slices based on the entropy of the slices to compose the dataset. They then proceed to shuffle the data and split it with a 4:1 training to testing ratio to perform the more complicated task of three-class classification for Normal, Mild Cognitive Impairment, and Alzheimer.
Other methods used 3D models, which are more computationally expensive but have more learning capacity for the three-dimensional MRI data.
Payan and Montana (2015) pretrained a sparse autoencoder on randomly generated patches and used the weights as part of a 3D CNN to perform classification on the ADNI dataset, splitting randomly by MRI. Hosseini-Asl et al. (2016) employed a similar approach of using sparse autoencoder to pretrain on scans, but instead of randomly selecting patches from the training dataset, they used scans from the CADDementia dataset Bron et al. (2015), and performed ten-fold cross-validation on the ADNI dataset.
Khvostikov et al. (2018) extracted regions of interest around the lobes of the hippocampus using atlas Automated Anatomical Labeling (AAL), augmented their data by applying random shifts of their data by up to two pixels and random Gaussian blur with up to 1.2, and classified using a Siamese network on each of the regions of interest.
More recently, Wang et al. (2018) trained a 3D DensetNet with ensemble voting on the ADNI dataset to achieve the state-of-the-art accuracy on three-class classification. They split by patients but treated MRIs of the same patient that are over three years apart as different patients, giving away some information from the training to testing process.
Table 1 summarizes information on the data and evaluation approaches used by a few recent papers.
Unlike most of the aforementioned papers that report high performance but do not explicitly mention their training and testing data split methodology, Bäckström et al. (2018) pointed out the problem of potentially giving away information from the training set into the testing set when splitting randomly by MRI scans, and showed that splitting MRI data by patient led to worse model performance. However, they only report two-class classification (Normal vs. Alzheimer’s) in their results. They also only used a subset that is less than half the size of the MRIs available in ADNI, even though they reported empirical studies showing that the same model performing well on a small dataset can experience a significantly reduced performance on a large dataset.
Our work differs in that we use as much of the data as available from ADNI and provide results in three-class classification (CN vs MCI vs AD). In addition, we introduce a method of splitting the data by visit history motivated by real-world use case that is new to the application in Alzheimer’s disease brain MRI classification, and we compare the effects of the different splitting approaches in model performance.
| # MRIs | # Patients | Data Splitting Approach | Accuracy | |
|---|---|---|---|---|
| Jain et al. (2019) | 150 | 150 | 8:2 train/test split, by augmented MRI slices | 95.7% (2D) |
| Farooq et al. (2017) | 355 | 149 | 3:1 train/test split, by augmented MRI slices | 98.8% (2D) |
| Payan and Montana (2015) | 100 | n/a | 8:1:1 train/val/test split, by patches from MRI | 89.5% (3D) |
| Hosseini-Asl et al. (2016) | 210 | 210 | 10-fold cross validation, by patient | 94.8% (3D) |
| Khvostikov et al. (2018) | 214 | 214 | 5:1 train/test split, by patient | 96.5% (3D) |
| Wang et al. (2018) | 833 | 624 | 7:3 train/test split, by patient & MRI | 97.2% (3D) |
3 Methodology and Results
In this section, we will briefly discuss the dataset we worked with, the preprocessing steps we took to produce our results, the model architectures we chose and training hyperparameters we used, as well as the results we obtained from the various methods of splitting the dataset.
3.1 Data Acquisition and Preprocessing
We use MRI data from ADNI because it is the largest publicly available dataset on Alzheimer’s Disease, consisting of patients who experience mental decline getting their brain scanned and cognition assessed in longitudinal visits over the span of several years.
We collected all of the scans that underwent Multiplanar Reconstruction (MPR), Gradwarp, and B1 Correction pre-processing from the dataset, discarding the replicated scans of the brain for the same patient during the same visit. We performed statistical parametric mapping (SPM) Ashburner and Friston (2005) using the T1–volume pipeline in the Clinica software platform (www.clinica.run), developed by the ARAMIS lab (www.aramislab.fr), as an additional pre-processing step on the images to spatially normalize them.
In total, 2,731 MRIs from 657 patients are selected for our experiments. For the split by patient history, we used 2,074 scans for training and validation, and 657 scans for testing, where each scan in the testing set is from the last visit of the patient. For splitting by MRI, we used the same number of scans for all sets as the previous split by patient history. And finally, for splitting at the patient level, we had 2,074 scans from 484 patients in the training set and validation set, and 657 scans from 173 patients in the testing set. For consistency, we used the same number of scans in all subsets for all three splits. Our code repository is publicly available 111https://github.com/Information-Fusion-Lab-Umass/alzheimers-cnn-study, and it includes the patients ids and visits that we evaluated.
3.2 Model Architecture and Training
We compared 2D and 3D CNN architecture performances. For our 2D CNN architecture, we used ResNet18 He et al. (2016) that was pretrained on ImageNet, allowing the model to learn how to better extract low-level features from images.
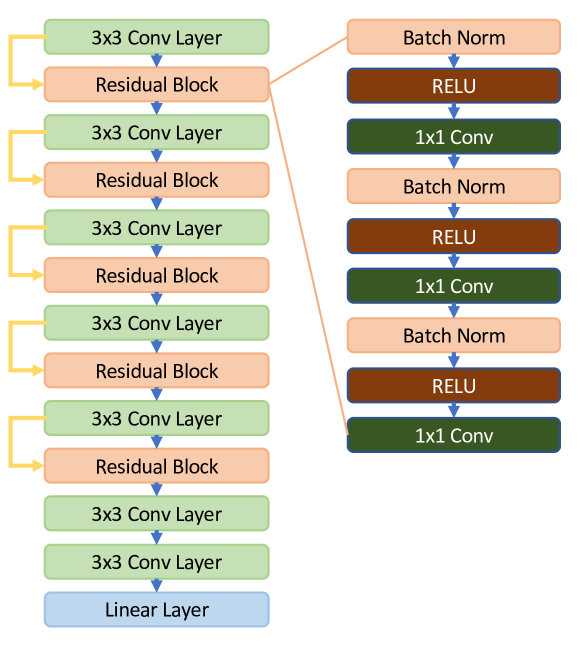
For our 3D CNN architecture, we followed a residual network-based architectural design as well. We used the “bottleneck” configuration, where the inner convolutional layer of each residual block contains half the number of filters, and we used the “full pre-activation” layout for the residual blocks. See Figure 2 for more details.
For the 2D networks, we used a learning rate of 0.0001 and L2 regularization constant of 0.01. For the 3D network, we used a learning rate of 0.001 and regularization constant of 0.0001. Both networks were trained for 36 epochs, with early stopping.
3.3 Splitting Methodology and Results
Our main goal is to investigate how differently the model performs under the following three scenarios: (1) random training and testing split across the brain MRIs, (2) training and testing split by patient ID, and (3) training and testing split based on visit history across the patients.
| Model | Train Acc. | Test Acc. | |
|---|---|---|---|
| Split by MRI randomly | |||
| 2D | Split by visit history | ||
| Split by patients | |||
| Split by MRI randomly | |||
| 3D | Split by visit history | ||
| Split by patients | |||
In Table 2, we present the three-way classification result of the models described in Section 3.2. In summary, when the training and testing sets were split by MRI scans randomly, the 2D and 3D models attained accuracy close to 84%. When the training and test sets were split by visits, in which only the latest visit of each patient was set aside for testing, accuracy was slightly lower. However, accuracy dropped to around 50% when the training and test set were split by patient.
We note that the other state-of-the-art 2D CNN architectures we tried (DenseNet, InceptionNet, VGGNet) performed similarly to ResNet, and the choice of view in the 2D slice (coronal, axial, sagittal) did not lead to significant differences in testing accuracy as long as the slices were chosen to be close to the center of the brain. We report results on the 88th slice of the coronal view for our 2D model. Our 3D model performs slightly better but is still limited in performance, suffering the same problem of over-fitting to information on individual patients instead of learning what generally differentiates a brain in the different stages of Alzheimer’s Disease.
| Ground Truth | ||||
|---|---|---|---|---|
| AD | MCI | CN | ||
| Prediction | AD | 96 | 59 | 17 |
| MCI | 62 | 153 | 90 | |
| CN | 17 | 67 | 96 | |
3.4 Analysis
Analysis of the dataset shows that the frequency of disease stage transition for patients between any two consecutive visits is low in the ADNI dataset. There are only 152 transitions in the entire dataset, which contains 2,731 scans from 657 patients.
We believe that due to the relatively few transition points in the dataset, the models are still able to achieve accuracy in the 80% range for the splitting by visit experiments by repeating the diagnostic label of the previous visits. Out of the 152 total transitions we found across the whole dataset, only 52 of them happened for patients between the th visit and th visit. This suggests that the model is able to encode the structure of a patient’s brain from the training set, in turn aiding its performance on the testing set.
Furthermore, we set up additional experiments where we trained on visits from all patients, but only tested on the 52 patients that had a transition from the th to th visit. The classification accuracy on this experiment dropped to around 54%, which suggests that the network was repeating information about the patient’s brain structure instead of learning to be discriminative among the different stages of Alzheimer’s Disease exhibited by a particular MRI scan.
4 Discussion
4.1 Technical Challenges
We summarize the main challenges in working with the ADNI dataset as follows:
1. Lack of transitions in a patient’s health status between consecutive visits. There are only 152 transitions total out of the entire dataset of 2,731 images collected from patient visits. It is easy for the model to overfit and memorize the state of a patient at each visit instead of generalizing the key distinctions between the different stages of Alzheimer’s Disease.
2. Coarse-grained data labels. The data labels are coarse-grained in nature so our classifier may become confused when trying to learn on cases when a patient’s cognitive state may be borderline, such as being between MCI and AD. The confusion matrix in Table 3 demonstrates this.
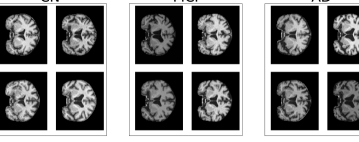
3. Difficulty in distinguishing the visual difference of a brain in the different Alzheimer’s stages. Human brains are distinct by nature, and the quality of MRI collections from different clinical settings add to the noise level of the data. In Figure 1, we plotted out the brains of subjects in CN/MCI/AD, and show that the difference in anatomical structure from CN to MCI to AD is very subtle.
4. No clear baseline. Many studies evaluated the performance of their models on different subsets of the ADNI dataset, making fair comparison a tricky task. In addition, studies that use a separate testing set do not report the subjects or scans that they used in their testing set, further complicating the comparison process.
We hope to keep these challenges in mind when designing future experiments and ultimately design models that can reliably classify brain MRIs with its true stage in Alzheimer’s Disease progression, which is robust to visit number, lack of patient transitions, and minor fluctuations in scan quality.
4.2 Insights and Future Work
Many studies in Alzheimer’s disease brain MRI classification do not take into account how the data should be properly split, putting into question the ability of the proposed models to generalize on unseen data. We fill this gap by providing detailed analysis of model performance across splitting schemes. Additionally, to our knowledge, none of the previous studies use all of the MRIs available in the ADNI dataset and do not present a clear explanation for this decision. To address the issue, we perform our experiments on all available data while also reporting the subjects used in the training and test split of all our experiments for reproducibility.
In the future, we would like to explore utilizing the covariate data collected from patients to aid image feature extraction. Most of the studies we have come across do not use any covariate information collected from patients. The covariates, such as patient demographics and cognitive test scores, may be helpful for the classification task since they correlate with the disease stage of the patient. A scenario could be a multitask learning setup, where the model predicts the Mini-Mental State Examination (MMSE) and Alzheimer’s Disease Assessment Scale (ADAS) cognitive scores in addition to the labels. We think this may be helpful in training the model because the cognitive test scores can provide finer-grained signal for the model, making the prediction more robust.
References
- Ashburner and Friston [2005] John Ashburner and Karl J Friston. Unified segmentation. Neuroimage, 26(3):839–851, 2005.
- Association and others [2017] Alzheimer’s Association et al. 2017 alzheimer’s disease facts and figures. Alzheimer’s & Dementia, 13(4):325–373, 2017.
- Bäckström et al. [2018] Karl Bäckström, Mahmood Nazari, Irene Yu-Hua Gu, and Asgeir Store Jakola. An efficient 3d deep convolutional network for alzheimer’s disease diagnosis using mr images. In 2018 IEEE 15th International Symposium on Biomedical Imaging (ISBI 2018), pages 149–153. IEEE, 2018.
- Bhagwat et al. [2018] Nikhil Bhagwat, Joseph D Viviano, Aristotle N Voineskos, M Mallar Chakravarty, Alzheimer’s Disease Neuroimaging Initiative, et al. Modeling and prediction of clinical symptom trajectories in alzheimer’s disease using longitudinal data. PLoS computational biology, 14(9):e1006376, 2018.
- Bron et al. [2015] Esther E Bron, Marion Smits, Wiesje M Van Der Flier, Hugo Vrenken, Frederik Barkhof, Philip Scheltens, Janne M Papma, Rebecca ME Steketee, Carolina Méndez Orellana, Rozanna Meijboom, et al. Standardized evaluation of algorithms for computer-aided diagnosis of dementia based on structural mri: the caddementia challenge. NeuroImage, 111:562–579, 2015.
- Farooq et al. [2017] Ammarah Farooq, SyedMuhammad Anwar, Muhammad Awais, and Saad Rehman. A deep cnn based multi-class classification of alzheimer’s disease using mri. In 2017 IEEE International Conference on Imaging systems and techniques (IST), pages 1–6. IEEE, 2017.
- Fischl [2012] Bruce Fischl. Freesurfer. Neuroimage, 62(2):774–781, 2012.
- Gerardin et al. [2009] Emilie Gerardin, Gaël Chételat, Marie Chupin, Rémi Cuingnet, Béatrice Desgranges, Ho-Sung Kim, Marc Niethammer, Bruno Dubois, Stéphane Lehéricy, Line Garnero, et al. Multidimensional classification of hippocampal shape features discriminates alzheimer’s disease and mild cognitive impairment from normal aging. Neuroimage, 47(4):1476–1486, 2009.
- He et al. [2016] Kaiming He, Xiangyu Zhang, Shaoqing Ren, and Jian Sun. Deep residual learning for image recognition. In Proceedings of the IEEE conference on computer vision and pattern recognition, pages 770–778, 2016.
- Hon and Khan [2017] Marcia Hon and Naimul Mefraz Khan. Towards alzheimer’s disease classification through transfer learning. In 2017 IEEE International Conference on Bioinformatics and Biomedicine (BIBM), pages 1166–1169. IEEE, 2017.
- Hosseini-Asl et al. [2016] Ehsan Hosseini-Asl, Georgy Gimel’farb, and Ayman El-Baz. Alzheimer’s disease diagnostics by a deeply supervised adaptable 3d convolutional network. arXiv preprint arXiv:1607.00556, 2016.
- Jain et al. [2019] Rachna Jain, Nikita Jain, Akshay Aggarwal, and D Jude Hemanth. Convolutional neural network based alzheimer’s disease classification from magnetic resonance brain images. Cognitive Systems Research, 2019.
- Khvostikov et al. [2018] Alexander Khvostikov, Karim Aderghal, Jenny Benois-Pineau, Andrey Krylov, and Gwenaelle Catheline. 3d cnn-based classification using smri and md-dti images for alzheimer disease studies. arXiv preprint arXiv:1801.05968, 2018.
- Korolev et al. [2017] Sergey Korolev, Amir Safiullin, Mikhail Belyaev, and Yulia Dodonova. Residual and plain convolutional neural networks for 3d brain mri classification. In 2017 IEEE 14th International Symposium on Biomedical Imaging (ISBI 2017), pages 835–838. IEEE, 2017.
- Payan and Montana [2015] Adrien Payan and Giovanni Montana. Predicting alzheimer’s disease: a neuroimaging study with 3d convolutional neural networks. arXiv preprint arXiv:1502.02506, 2015.
- Plant et al. [2010] Claudia Plant, Stefan J Teipel, Annahita Oswald, Christian Böhm, Thomas Meindl, Janaina Mourao-Miranda, Arun W Bokde, Harald Hampel, and Michael Ewers. Automated detection of brain atrophy patterns based on mri for the prediction of alzheimer’s disease. Neuroimage, 50(1):162–174, 2010.
- Simonyan and Zisserman [2014] Karen Simonyan and Andrew Zisserman. Very deep convolutional networks for large-scale image recognition. arXiv preprint arXiv:1409.1556, 2014.
- Szegedy et al. [2017] Christian Szegedy, Sergey Ioffe, Vincent Vanhoucke, and Alexander A Alemi. Inception-v4, inception-resnet and the impact of residual connections on learning. In Thirty-First AAAI Conference on Artificial Intelligence, 2017.
- Wang et al. [2018] Shuqiang Wang, Hongfei Wang, Yanyan Shen, and Xiangyu Wang. Automatic recognition of mild cognitive impairment and alzheimers disease using ensemble based 3d densely connected convolutional networks. In 2018 17th IEEE International Conference on Machine Learning and Applications (ICMLA), pages 517–523. IEEE, 2018.
- Wu et al. [2018] Congling Wu, Shengwen Guo, Yanjia Hong, Benheng Xiao, Yupeng Wu, Qin Zhang, Alzheimer’s Disease Neuroimaging Initiative, et al. Discrimination and conversion prediction of mild cognitive impairment using convolutional neural networks. Quantitative Imaging in Medicine and Surgery, 8(10):992, 2018.