Spin dynamics and unconventional magnetism in insulating La(1-2x)Sr2xCo(1-x)NbxO3
Abstract
We study the structural, magnetic, transport and electronic properties of LaCoO3 with Sr/Nb co-substitution, i.e., La(1-2x)Sr2xCo(1-x)NbxO3 using x-ray and neutron diffraction, dc and ac-magnetization, neutron depolarization, dc-resistivity and photoemission measurements. The powder x-ray and neutron diffraction data were fitted well with the rhombohedral crystal symmetry (space group Rc) in Rietveld refinement analysis. The calculated effective magnetic moment (3.85 ) and average spin (1.5) of Co ions from the analysis of magnetic susceptibility data are consistent with 3+ state of Co ions in intermediate-spin (IS) and high-spin (HS) states in the ratio of 50:50, i.e., spin-state of Co3+ is preserved at least up to 0.1 sample. Interestingly, the magnetization values were significantly increased with respect to the 0 sample, and the M-H curves show non-saturated behavior up to an applied maximum magnetic field of 70 kOe. The ac-susceptibility data show a shift in the freezing temperature with excitation frequency and the detailed analysis confirm the slower dynamics and a non-zero value of the Vogel-Fulcher temperature T0, which suggests for the cluster spin glass. The unusual magnetic behavior indicates the presence of complex magnetic interactions at low temperatures. The dc-resistivity measurements show the insulating nature in all the samples. However, relatively large density of states 1022 eV-1cm-3 and low activation energy 130 meV are found in 0.05 sample. Using x-ray photoemission spectroscopy, we study the core-level spectra of La 3, Co 2, Sr 3, and Nb 3 to confirm the valence state.
I Introduction
The spin-state transition present in the LaCoO3 is an open question for the researchers even after enormous theoretical as well as experimental efforts since many decades AbbatePRB93 ; KorotinPRB96 ; HaverkortPRL06 ; AltarawnehPRL12 ; AugustinskyPRL13 ; ChakrabartiPRM17 ; ShuklaPRB18 . In LaCoO3, Co is in Co3+ (3d6) state and their ground state is characterized by the low spin electronic configuration [LS; S=0; t], whereas other excited states are defined as intermediate spin state (IS; S = 1; t) and high spin state (HS; S = 2; t). The ground state of LaCoO3 gradually passes to IS, HS or mixed state of IS/HS with temperature, pressure, magnetic field, cationic substitution as well as with induced lattice strain IshikawaPRL04 ; EnglishPRB02 ; ZobelPRB02 ; AltarawnehPRL12 ; YamaguchiPRB97 ; SaitohPRB97 ; KozlenkoPRB07 ; VasquezPRB96 ; KrienerPRB04 ; SatoJPSJ14 ; StreltsovJPCM16 ; KarpinskyJPCM05 ; SerranoJPDA08 ; HammerPRB04 ; BaierPRB05 ; KrienerPRB09 ; YoshiiPRB03 . The energy difference between LS and IS state of the Co3+ ion is rather small (80 K in temperature scale), usually this energy difference increases with the reduction of CoO6 octahedron volume and vice versa TroyanchukPSS05 , however above 80 K, Co ion is found in IS configuration showing Jahn-Teller (JT) distortion KorotinPRB96 . The Co3+ possess larger ionic radius in IS state (0.56 Å) than in the LS state (0.545 Å) RadaelliPRB02 ; ShannonACA76 ; ShannonACB69 ; therefore, an increase in unit cell volume favors transition from LS to IS state. The second transition at 500 K is attributed to an insulator to metal transition. The band structure calculations within the LDA+U approximation demonstrated that the IS state is lowest in energy after the first transition KorotinPRB96 ; RaccahJAP68 . In contrast to the expectation from the simple ionic model, IS is stabilized by a strong p-d hybridization and possible orbital ordering in the eg shell of Co3+ ions KorotinPRB96 . The redistribution of electrons between the t2g and eg levels results from a competition between the crystal field splitting energy () and the intra-atomic Hund’s exchange energy (Jex); however, both terms have comparable values in cobaltites. The crystal field splitting energy strongly depends on the Co-O bond length, therefore in a pure ionic picture the ground state is stabilized with 3Jex and for HS state 3Jex. The competition between and Jex can easily be controlled by cationic substitution either at La or Co site IshikawaPRL04 ; KrienerPRB04 . This has been observed in the behavior of LaCo1-xRhxO3 and La1-xSrxCoO3, in which the spin state transition disappears for certain compositions and Co ions remain/retain magnetic down to the lowest measured temperature KyomenPRB03 ; WuPRB03 .
The Sr2+ ionic radius (1.44 Å) is significantly greater than that of the La3+ ion (1.36 Å), so it is possible to anticipate that the stabilization of IS state of Co ions by substituting Sr2+ ions at La3+ site RaviJALCOM18 . We believe that Sr ions, whose radius is larger than that of La ions, increase the average Co-O distance in part of the CoO6 octahedra, which favors transition of the Co3+ ions from the LS to IS state. However, at such heterovalent substitution Co4+ ions appear, leading to the ferromagnetic metallic ground state WuPRB03 ; SenarisJSSC95 ; ItohJMMM95 . The majority of researchers intended that ferromagnetism in cobaltites attribute to the phenomenon of double exchange interaction (between Co3+–Co4+), as comprehended in manganites ZenerPR151 ; ZenerPR251 . Other interesting case is that the hole doping (Ca, Sr, Ba at La site) in LaCoO3 drives the system in metallic regime whereas the substitution of Nb at Co site impels towards the insulating regime ShuklaPRB18 . Therefore, the co-substitution of both cations on their respective sites in LaCoO3 would alter its transport behavior. It is well reported that regardless of having larger ionic radii, Sr2+ does not induce any structural transformation in the system up to 50% concentration NamPRB99 . Whereas, our recent study reveals that the Nb5+ substitution at Co site induces structural transformation of lower symmetry from the rhombohedral to orthorhombic, and then monoclinic at higher concentration ShuklaPRB18 .
Here, we have simultaneously substituted Sr and Nb in place of La and Co in a ratio of 2:1, respectively. The substitution of Sr2+ at La3+ site changes the Co ion from Co3+ to Co4+, and the substitution of one Nb5+ at Co site converts two Co3+ into the Co2+ ions ShuklaPRB18 ; WuPRB03 . Therefore with co-substitution of Sr and Nb in 2:1 ratio, the valence state of Co ion can be maintained in 3+. In order to understand the effect of co-substitution in La(1-2x)Sr2xCo(1-x)NbxO3, we study the structural, magnetic, transport and electronic properties. The Rietveld refinement of x-ray and neutron diffraction data reveal the rhombohedral symmetry for all the samples and an increase in the unit cell volume with higher substitution. The derived values of effective magnetic moment confirm the 3+ valence state of Co ions, which is consistent as co-substitution is expected to maintain Co ions in 3+ state. We further confirm the valence state of Co ion using photoemission spectroscopy. The extracted characteristic frequency from ac-susceptibility data exhibits slower spin dynamics of the system and suggests that the origin of spin glass state is not from individual spins rather related to their clusters. The transport properties manifest that co-substitution drives system towards the insulating regime; fitted data for the possible conduction mechanisms provide the values of activation energy as well as density of states near the Fermi level.
II Experimental
Polycrystalline samples of La(1-2x)Sr2xCo(1-x)NbxO3 were synthesized by the conventional solid state solution method. We used strontium carbonate (SrCO3), cobalt oxide (Co3O4) and niobium oxide (Nb2O5) as purchased, whereas purchased lanthanum oxide (La2O3) powder was dried at 700 0C for 12 hrs prior to use. Stoichiometric amount of starting materials (all 99.9% from Sigma/Alfa) were thoroughly mixed with the help of mortar-pestle and reacted at 11000C for 12 hrs in air, pellets of calcined powder were cold pressed at 2000 psi and sintered in air at 14750C for 6 – 10 hrs ShuklaPRB18 ; OygardenJSSC12 .
X-ray diffraction data were collected with a CuK radiation ( = 1.5406 Å) using Panalytical x-ray diffractometer, magnetic and transport measurements were done with physical property measurement system (PPMS) from Quantum Design, USA. Ac-susceptibility measurements were carried out in a CRYOGENIC make, liquid He based PPMS at BARC, India. We analyzed the XRD data by Rietveld refinement using FullProf package and the background was fitted using the linear interpolation between the data points. We recorded the powder neutron diffraction data at temperatures 3 and 300 K for bulk La(1-2x)Sr2xCo(1-x)NbxO3 ( 0.025, 0.05, and 0.15) samples, using the powder diffractometer PD-I ( = 1.094 Å ) at the Dhruva reactor, Trombay, Mumbai, India. One dimensional neutron depolarization measurements over the temperature range of 4–300 K, to identify the ferromagnetic clusters, were carried out using the polarized neutron spectrometer (PNS) at the Dhruva reactor, under an applied magnetic guide field of 50 Oe. For the neutron depolarization measurements, polarized neutrons ( = 1.205 Å ) were produced and analyzed by using magnetized Cu2MnAl (111) and Co0.92Fe0.08 (200) single crystals, respectively. The two different states (up and down) of the incident neutron beam polarization were achieved by a flipper just before the sample. The polarization of the neutron beam was determined by measuring the intensities of neutrons in non-spin flip and spin flip channels with the flipper off and on (flipping ratio, R), respectively. The core-level spectra of La 3, Co 2, Sr 3 and Nb 3 were recorded at room temperature using a monochromatic Al-K source (energy resolution = 0.5 eV), in a base pressure of 5 10-10 mbar. We used a charge neutralizer to compensate the charging effect in these insulating samples.
III Results and Discussion
III.1 A. Room temperature x-ray and neutron diffraction
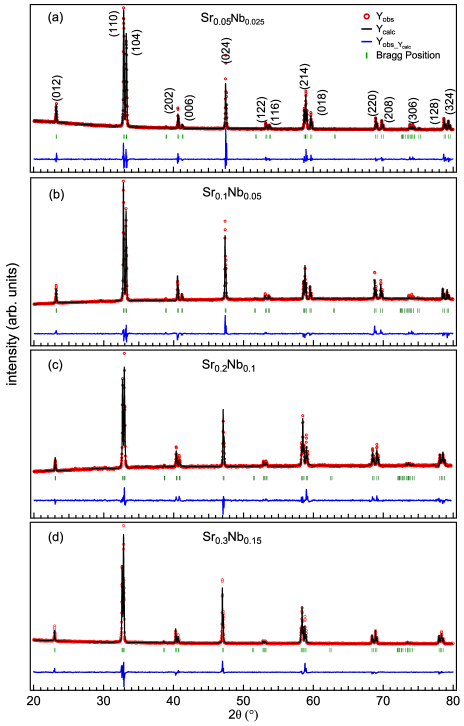
The crystal structure of La(1-2x)Sr2xCo(1-x)NbxO3 samples has been investigated by the Rietveld refinement of both x-ray and neutron diffraction data measured at room temperature. The lattice parameters were determined from the refinement of x-ray diffraction (XRD) patterns and were used as a starting point for the refinement of neutron diffraction (ND) data. Due to sensitivity of neutron towards lighter atom, the positions of oxygen were obtained from the refinement of neutron diffraction data and were kept fix during the final stage refinement of x-ray diffraction data. The Rietveld refined x-ray and neutron diffraction patterns are presented in Figures 1 and 2, respectively. The refinement confirms single phase formation of these samples in rhombohedral structure (space group Rc #167). The Rietveld refined lattice parameters and unit cell volume show systematic increment with increasing the amount of substitution, as presented in table I. Also, in table I, we present pseudocubic (pc) lattice parameters calculated using apc = a/, bpc = b/, cpc = c/, and unit cell volume (Vpc) for La(1-2x)Sr2xCo(1-x)NbxO3. Recently, it has been reported that the Nb substitution at Co site in LaCoO3 induces the structural transition OygardenJSSC12 ; ShuklaPRB18 , which can be attributed to the difference in the ionic radius of Nb5+ and Co3+ ions. In LaCoO3, Co3+ ions have ionic radii of 0.545 Å in LS state and 0.61 Å in HS state, but Nb5+ ions have ionic radii of 0.64 Å ShannonACB69 ; ShannonACA76 . Due to the larger ionic radii of Nb ions, volume of octahedra around Co site increases and results in the modification of crystal structure. On the other hand, larger Sr2+ substitution at La site in LaCoO3 will not change the structure up to 0.5 NamPRB99 . Therefore, the co-substitution of Sr2+ and Nb5+ in LaCoO3 may generate the possibility of structural modification attributed to the perturbation of volume of polyhydra around both the sites. However, we observe that with co-substitution up to 0.15, there is no structural transition and we were able to fit the XRD and ND data with the rhombohedral space group Rc only, as clearly visible in Figures 1 and 2.
| XRD | Rp | Rwp | a=b(Å) | c (Å) | V(Å3) | apc=bpc | cpc | Vpc | |
|---|---|---|---|---|---|---|---|---|---|
| (%) | (%) | (%) | (Å) | (Å) | (Å3) | ||||
| 0 | 1.75 | 3.31 | 4.57 | 5.4416(13) | 13.0900(2) | 335.679(9) | 3.848 | 3.778 | 55.95 |
| 2.5 | 4.19 | 4.16 | 6.85 | 5.4449(13) | 13.1195(4) | 336.841(15) | 3.850 | 3.783 | 56.14 |
| 5 | 3.2 | 3.52 | 5.35 | 5.4554(13) | 13.1448(4) | 338.801(15) | 3.858 | 3.805 | 56.64 |
| 10 | 2.3 | 2.91 | 4.33 | 5.4766(16) | 13.2594(5) | 344.407(19) | 3.871 | 3.841 | 57.55 |
| 15 | 2.8 | 4.21 | 6.23 | 5.4816(12) | 13.2996(3) | 346.087(14) | 3.899 | 3.869 | 58.82 |
| neutron | Rp | Rwp | Co-O (Å) | Co-O-Co | O-Co-O | La-O (Å) | La-O (Å) | La-O (Å) | La-Co (Å) | La-Co (Å) | |
|---|---|---|---|---|---|---|---|---|---|---|---|
| (%) | (%) | (%) | 6 | 3 | 3 | 6 | 2 | 6 | |||
| 2.5 | 2.27 | 1.42 | 2.0 | 1.9439(2) | 163.029(1) | 91.225(5) | 3.0204(2) | 2.4467(2) | 2.7196(2) | 3.2924(4) | 3.3420(2) |
| 5 | 4.85 | 1.84 | 2.77 | 1.9440(1) | 164.465(3) | 91.052(6) | 2.9996(2) | 2.4741(2) | 2.7239(3) | 3.3047(4) | 3.3467(2) |
| 15 | 2.28 | 1.52 | 2.03 | 1.9554(1) | 165.693(1) | 90.817(6) | 2.9963(2) | 2.5093(2) | 2.7455(2) | 3.3381(4) | 3.3678(2) |
In Figures 2(a–c) we show the Rietveld refined powder neutron diffraction patterns measured at 300 K for the 0.025, 0.05, and 0.15 samples, respectively. All the observed patterns were fitted by considering only the nuclear phase. In ABO3 type perovskites the A site has cuboctahedral symmetry and here it has three groups of La–O bond-lengths, namely small (3 fold degenerate), intermediate (6 fold degenerate) and long (3 fold degenerate). The Rietveld refined parameters like bond-lengths and bond-angles from the Neutron diffraction for La(1-2x)Sr2xCo(1-x)NbxO3 are summarized in table I.
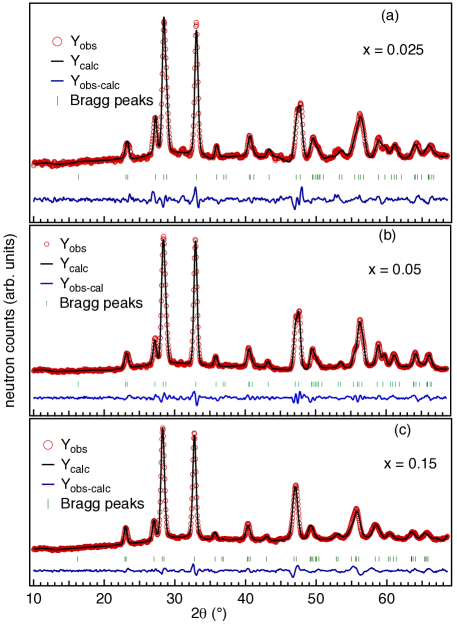
We found that the long bond decreases, while the other two groups of bonds increases with the substitution. This indicates that the long-bond compensate the effect of substitution of larger cations to preserve the crystal structure similar to the parent ( 0) sample. The B site has an octahedral symmetry and sixfold degenerate Co–O bonds. Here the Co–O bond length increases and slightly larger than LaCoO3 (1.934 Å) at 300 K RadaelliPRB02 , while the octahedra changes its bond-angles i.e., O–Co–O decreases with the substitution.
Octahedral distortions are reflected in the tilting of BO6 from the vertical axis and defined as = (180-)/2, where is defined as B-O-B bond angle along the z-axis. The tilting of octahedra is also quantified through the pseudo-cubic parameters cpc and , defined as c/ and /, respectively. The distortion parameter is defined as (1/12) [(, where davg is average bond length of La–O. The calculated values of for the cuboctahedra are presented in table 2, where we can see that the tetragonal strain decreases with increasing the substitution. In order to obtain the information about the oxidation state of metal ion, we have calculated bond valence sum (BVS) from the bond-lengths of the octahedra without any assumptions. The BVS is generally calculated using an empirical relation based on the Pauling’s “2nd Rule” of electrostatic valence, which postulates that the total strength of the valence bond, which reaches an ion from all the surrounding atoms is equal to the charge of the ion PaulingJACS29 ; OgielskiPRB8587 .
where the sum is over neighboring atoms with each bond between atoms and having bond valence sij. Brown and Altermatt suggested the exponential form in 1985 BrownAC85 , where R0 is termed as unit valence bond-length, and therefore a unique value for each metal-ion pair was tabulated. Here, Rij is the experimentally observed bond-length between the metal-ion pair and is an empirical constant, generally taken as 0.37 BrownAC73 . The bond valence parameter (R0) depends on the metal-ion pair, valency of metal ion and the coordination number of the metal ion. The calculated BVS values from room temperature neutron data are presented in the table 2 for 0.025, 0.05 and 0.15 samples. These calculated BVS values signifies the average effect of the charge with the substitution around the A-O12 and B-O6 polyhydra. Since, the substitution of Sr and Nb changes the average valency on the A () and B () sites, but to maintain the charge neutrality a charge transfer occurs between the A and B sites. The charge deficit for the each sample is calculated with the formula = 3–(v+v)/2, which directly correlates with the valence charge and termed as the non-stoichiometry.
| (%) | /apc | et | vB | vA | ||
| 10-3 | (deg) | |||||
| 2.5 | 0.98 | -8 | 8.48 | 6.6 | 3.103 | 3.096 |
| 5 | 0.985 | -7 | 7.7 | 5.5 | 3.103 | 2.996 |
| 15 | 0.99 | -4.5 | 7.15 | 4.7 | 3.008 | 2.802 |
For 0, the valence charge at oxygen site would be 6 in the unit cell. We have calculated the saturated bond lengths, below this coordination polyhydra cannot occupy more charge. The saturated bond valence () can be calculated using = e, where Rs is the saturated bond valence parameter. The difference between the measured and saturated valence can be calculated, which gives the total valence deviation =– and demonstrates the balancing of the valence charge between the B-O6 and A-O12 polyhydra and vice-versa. We have plotted with the substitution concentration (not shown) and a linear fit of this curve crosses the 0 axis near the 0.12 value (i.e. around equal to 12% concentration). This means that for 0.12, coordination polyhydra of A and B declines equally from the saturation. The estimated value of is found to be positive (about 0.09) only for the 0.15 sample. On the other hand, Brown and Shannon tested and reported that the bond valence method has accuracy around 5-7% for ionic compounds BrownAC73 . These obtained parameters from the structural analysis (particularly Co–O length and larger Co–O–Co angle) influence the magnetic properties of these samples DurandJPCM13 ; DurandJPCM15 .
III.2 B. Magnetization and magnetic susceptibility
In order to study the magnetic behavior, we have performed isothermal magnetization (M–H) measurements at 5 K with variation of applied magnetic field upto 70 kOe, the M-H loops for all the samples are presented in Figures 3 (a–d) where the inset in each panel shows the zoomed view of M–H close to zero field.
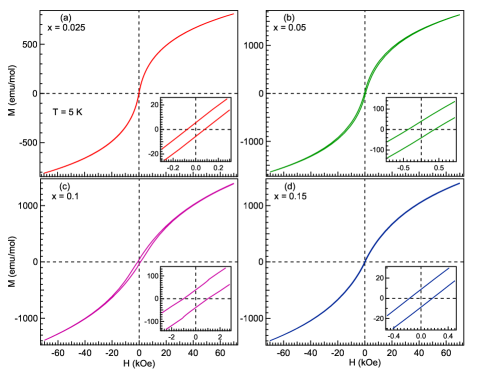
Recently, we observed the maximum value of magnetization 170 emu/mol for the parent ( 0) sample at highest applied magnetic field with the coercivity value of 1.35 kOe ShuklaPRB18 . On the other hand, here as we increase the concentration of co-substitution gradually, the maximum magnetization increased to 800 emu/mol (for the 0.025), but the hysteresis is almost disappeared; [see Figure 3(a)]. Further, for the 0.05 sample the magnetization increases to 1600 emu/mol, which is around ten times higher than that of the 0 sample. For the 0.1 sample this value found to be 1400 emu/mol and concurrently an increase in the hysteresis. Further, for the 0.15 sample there is no change in the magnetization value (1400 emu/mol), but the hysteresis found to be negligible. It is interesting to note that there is a large increase in the magnetization with co-substitution of Sr and Nb in 2:1 ratio, where we expect the Co ion maintains 3+ valence state like in the parent ( 0) sample. In LaCoO3, an increase in the average Co–O bond length of the CoO6 octahedra promote a spin-state transition from LS to IS state WuPRB03 . In the present case this behavior is evident as Co-O distance increases with the co-substitution in comparison to the 0 sample and this favors the possibility of similar spin-state transition. Although the nearest Co ions in IS state can interact ferromagnetically through the e1-O-e0 superexchange, as described in ref. YanPRB04 ; however, the substitution of Nb ions, which act as the magnetic dilution in the system, decreases the probability of long-range magnetic ordering in the system. Also, only about 50% Co ions are in IS state, discussed later. The cumulative effect of these interactions reflects in the M–H curves, where first coercivity increases up to 0.1 sample and then decreases for the 0.15 sample. This is consistent as this Nb concentration is found to be close to the percolation limit, also found in the BVS results, for the magnetic dilution.
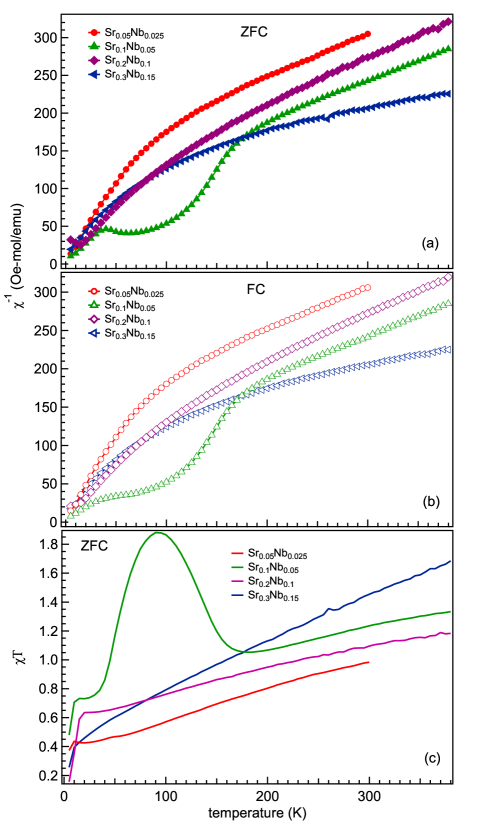
For further understanding the magnetic susceptibility and possible spin states of Co ion, we have studied the temperature dependence of the magnetization M(T) by performing the measurements in the zero-field cooled (ZFC) and field cooled (FC) modes in the temperature range of 5–380 K [see Figures 4(a–d)].
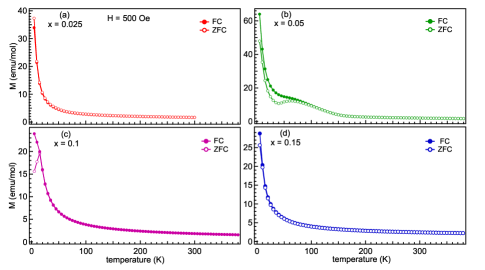
We observe that there is no bifurcation between ZFC–FC curves, but a sharp increase in the magnetization below 10 K temperature is clearly present for the 0.025, 0.15 samples. This behavior suggest the presence of Curie-Weiss paramagnetic behavior and/or surface related magnetism, which dominates in the low temperature regime and suggest the absence of long-range ordering in these samples YanPRB04 . On the other hand, the M(T) data for the 0.05 sample exhibit a bifurcation between ZFC-FC curves below 80 K, and a cusp in the ZFC curve near 40 K and then the magnetization increases sharply to 60 emu/mol. For the 0.1 sample, we observe a bifurcation below 15 K and the ZFC magnetization decreases while FC increases at lower temperatures. The observed unconventional behavior in the magnetization for the 0.05 sample could be due to the presence of temperature induced spin-state transition, as observed for the parent sample LaCoO3 AndroulakisPRB01 . The bifurcation between the FC and ZFC magnetization curves for the 0.05 and 0.1 samples indicate the possible presence of spin-glass phase GuoPRB16 , which further investigated using ac-magnetic susceptibility measurements (discussed later). We have analyzed the vs. T curves of all the samples in the range of 220 to 380 K [see Figures 5 (a, b)] by the Curie-Weiss law using the following equation
and evaluated the effective magnetic moment () and the Curie-Weiss temperature () ShuklaPRB18 .
Within the approximation of only spin magnetic moment, average spin (Sav) is calculated from the experimentally observed values with the formula , which was resultant of different spin state contributions of Co ions. The values obtained from the analysis are presented in Table 3 with the different combination of spin states of Co, responsible for the magnetization present in the system. Note that the spin state of Co3+ can be preserved in intermediate and high spin-states in the 50:50 ratio, as was reported for the parent sample ShuklaPRB18 ; TroyanchukaPSS06 .
| C | (exp) | Sav (exp) | ||
|---|---|---|---|---|
| 0 | -220 | 1.85 | 3.85 | 1.50 |
| 0.025 | -264 | 1.84 | 3.84 | 1.49 |
| 0.05 | -157 | 1.89 | 3.88 | 1.51 |
| 0.1 | -155 | 1.68 | 3.66 | 1.4 |
| 0.15 | -465 | 3.73 | 5.46 | 2.3 |
Thus co-substitution of Sr and Nb in the LaCoO3 preserves the valence states and spin-states at least up to the 0.1 sample. It is consistent as even small amount of Co2+ enhance the significantly from 3.85 to 4.65 ShuklaPRB18 , which is not the case here up to 0.1 sample. On the other hand, it is interesting to note that the magnetization is significantly enhanced (see Figure 3) as compared to the parent sample ShuklaPRB18 . This found to be unconventional and justify the need to further investigate the local structure and magnetism using absorption spectroscopy and magnetic circular dichroism studies at synchrotron radiation facility. However, the observed large value of for the 0.15 sample can be due to the Nb concentration as it is near the percolation limit and can induce Co2+ valence states. It is also found from the BVS calculations that 0.12 will be overcharged. In the T vs. temperature plots; see Figure 5(c), we found that all samples manifest a linear behavior and then sharp decrease below 10 K, whereas for the 0.05 sample a broad peak centred 80 K is observed. Interestingly, Androulakis et al. observed a very similar behavior in the parent LaCoO3 sample with the application of magnetic field (0.1 Tesla) AndroulakisPRB01 . Interestingly, the authors found an evidence of ferromagnetic and antiferromagnetic interactions along with spin state transition at low temperatures AndroulakisPRB01 . The observed downturn in vs. T curves [Figures 5(a, b)] at around 80 K [a broad peak in Figure 5(c)] in the 0.05 sample indicate a spin-state transition and presence of magnetic interactions at low temperatures AndroulakisPRB01 .
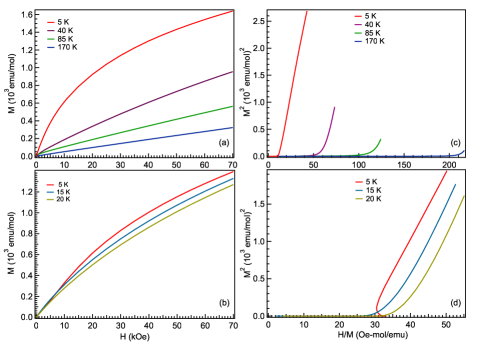
Therefore, in order to probe the magnetic behavior across the bifurcation observed in the ZFC-FC data, we have measured the virgin curves (M vs. H) across the transition at various temperatures and plotted Arrott plots (M2 vs. H/M) for 0.05 and 0.1 samples, as shown in Figures 6(a–d). From these M2 vs. H/M curves, by fitting the high-field region with the straight line, which if have an intercept on the y-axis indicates a ferromagnetic interaction and a non-ferromagnetic interaction when an intercept on the x-axis. In these samples a linear fit gives an intercept on the x-axis for all samples which suggest a non-ferromagnetic interaction in the system, which is consistent with the M–H curves showing a non-saturating nature upto kOe. Recently, we have observed that in LaCoO3, Nb substitution at Co site promotes short range ordering in the system for a large range of substitution ( 0.2) ShuklaPRB18 ; TroyanchukaPSS06 , and decreases the electrical conductivity as well. However, it has been reported that Sr substitution at La site induces the long range ordering in the system, an insulator to metal transition for 0.18 and a metallic ground state for 0.2 WuPRB03 . In the present case the Curie-Weiss temperatures are negative indicating antiferromagnetic interactions, whereas a small hysteresis in the isothermal magnetization curves indicate weak ferromagnetism along with the non-saturating behavior is a consequence of the antiferromagnetic interaction. This behavior suggests the coexistence of antiferromagnetic and ferromagnetic ordering and competition between them with co-substitution of Sr and Nb in LaCoO3. This is consistent as the Co–O–Co bond angle () values extracted from the neutron diffraction (see Table I) are slightly larger than the critical value 163 for LaCoO3. The larger values of in the present case is favorable for the presence of magnetism in these samples BelangerJPCM16 ; DurandJPCM13 probably due to internal strain as also the case in nanoparticles and thin films of LaCoO3 DurandJPCM15 ; FuchsPRB08 .
III.3 C. ac-magnetic susceptibility
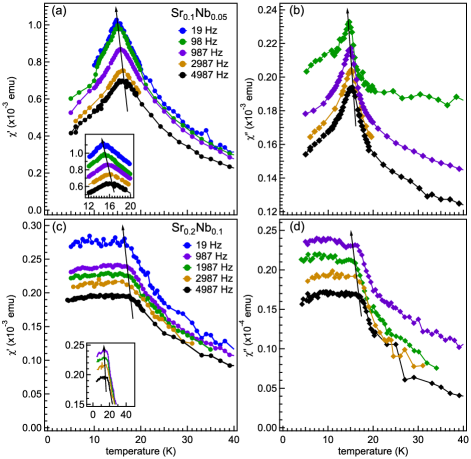
Further we performed ac-susceptibility measurements for the 0.05 and 0.1 samples. In Figures 7(a, b), we present the ac-susceptibility data for the 0.05 sample, which show peaks centered at 15 K for both in-phase (dispersion) and the out of phase (absorption) terms. The peak position in each curve termed as freezing temperature (Tf), which is generally defined as a point where thermally activated processes achieve a maximum value. We observe that the peak position shifts 2 K towards the higher temperature with increase in the frequency from 19 to 4987 Hz. For the 0.1 sample, ac-susceptibility curves show a broad cusp below 18 K in the real and imaginary parts [see Figures 7(c, d)], which also shifts towards higher temperature and the magnitude of the magnetic moment decreases with the increase in the excitation frequency. This shift in the peak position of ac-susceptibility is a characteristic feature to the presence of spin glass (SG) behavior in the system SowPRB12 . The change in the magnitude of the moment indicates that the individual spin dynamics gets affected due to the excitation frequency. This cusp in the ac-susceptibility curve of 0.1 sample, matches with the bifurcation in the temperature dependent ZFC-FC curve of dc-magnetization [see Figure 4(c)].
We have performed detailed analysis of ac-susceptibility data to find the information about spin dynamics. The comparison of the change in Tf with the excitation frequency is generally termed as the frequency sensitivity, also termed as the Mydosh parameter MydoshTF93 and can be calculated using the following formula
where is excitation frequency. Here we have determined the difference employing the highest and lowest measured excitation frequencies. The obtained = 0.05 and 0.04 for the 0.05 and 0.1 samples, respectively. The values of are generally defined in the range of 0.004–0.018 for the canonical SG behavior, and for superparamagnets (SPMs) in between 0.3-0.5 MydoshTF93 ; HanasakiPRL09 . We have obtained values larger than the canonical spin glasses, such as CuMn (=0.005) MydoshTF93 and smaller than the SPMs (ideal non-interacting spin glasses), like holmium borate glass a-[Ho2B3(B2O3)] MydoshTF93 . The freezing temperature dependence on the excitation frequency strongly depends on the strength of interaction betweeen the individual spins or magnetic entities. For example, stronger frequency sensitivity means the weak interaction like in magnetic clusters, while smaller value means a strong interaction between individual spins in the system. For the systems having the strong interaction (like normal ferromgnetic and antiferromganetic), large excitation frequencies (in range of MHz to GHz) are required to observe any remarkable shift in the frequency dependent ac-curves MalinowskiPRB11 . Thus, we can say that for 0.1 sample, spin interaction is relatively stronger owing to the smaller value of and that can be also seen in the sharp bifurcation in the dc-magnetization curve [see Figure 4(c)].
Frequency dependence of the freezing temperature Tf obtained from the real part, can be analyzed using the critical slowing down of the relaxation time by applying the standard dynamical scaling theory using the relation MydoshTF93 ; SasakiPRB05 ,
where is the relaxation time for the measured frequency, is the characteristic relaxation time for the spin flipping or microscopic relaxation time, TSG is the critical temperature for spin glass ordering or called static freezing temperature, i.e., when tends to zero, and is the dynamic exponent (in this is the parameter for the correlation length and ). Such kind of higher values have been observed elsewhere in SG and re-entrant spin glass (RSG) MydoshTF93 . For the simplicity we can write this formula in the form of
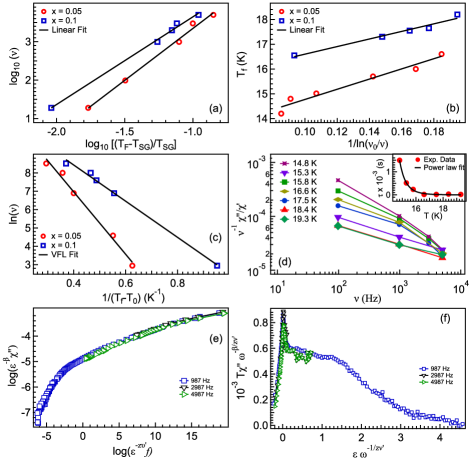
For further analysis we have plotted the data log10() vs log10[(Tf-TSG)/TSG], where , in the Figure 8 (a), which show the linear behavior for both the samples ( 0.05 and 0.1) and the values of and can be found from the intercept and slope, respectively. We obtained 8.9510-7 s and 1.210-6 s, and 2.7 and 2.3, for the 0.05 and 0.1 samples, respectively. It is previously reported that the conventional spin glasses have the value of in the range of 10-12–10-14 s and lies between 4–12 MydoshTF93 ; NamPRB00 . In comparison to this range is larger and that indicates towards slower spin dynamics in our system, due to the presence of strong correlation between the individual spins rather than the single non-interacting spins.
This interaction of spins can be further investigated by the Arrhenius relation; because failure of Arrhenius law confirms the presence of interaction between the individual spins as it applies for the non-interacting or weakly interacting magnetic entities. Arrhenius relation can be written as
where kB is the Boltzmann constant, is the characteristic attempt frequency, and Ea is the average thermal activation energy of the relaxation barrier. Arrhenius law accounts for the time scale to overcome the energy barriers by the activation process. In the plot of versus 1/Tf (not shown), we found that the behavior is not linear towards the lower values of excitation frequencies, which also suggests the interaction of individual spins in the freezing process of the system. The fit of these values gives the unphysical outputs (Ea/k 70075 K and 1062190 K and 1.71022 Hz and 2.6 1029 Hz for the 0.05 and 0.1, respectively), that is due to the smaller number of fitting parameters and signifies the failure of Arrhenius law.
Now, to increase the number of fitting parameters, another law is more phenomenological to explore the dynamical scaling behavior of spin freezing is the Vogel-Fulcher(VF) law defined with an empirical relation
where is the characteristic temperature or Vogel-Fulcher temperature used to measure interaction strength between magnetic entities, , and Ea have the same physical meaning as defined previously. We fitted our data taking two methods first via fixing the previosly obtained value of , and in order to fit the data it is convenient to write the equation in terms of
and that can be rearranged to
A plot between Tf vs 1/ln allows us to determine the Ea/kB and from the slope and intercept, respectively [see Figure 8(b)]. Fit results give the values of Ea/kB = 20.5 K and 15.3 K, and T0 = 12.7 K and 15.1 K, for the 0.05 and 0.1 samples, respectively. In order to make sure these output fitting parameters as a result of fixing the parameter are correct, we have also fitted the data fixing the T0 parameters. This Vogel-Fulcher temperature (T is determined by the method suggested by Souletie and Tholence SouletiePRB85 and obtained 13.50.3 and 160.2 K, for 0.05 and 0.1, respectively. We used simplified relation
and plotted a curve between ln versus 1/(), where the best fit of data give value of characteristic relaxation time = 1.110-6 and 4.210-6 s, and activation energy Ea/kB = 171 and 100.5 K for the 0.05 and 0.1 samples, respectively [see Figure 8(c)]. From the above analysis, we determine that T0 is nonzero for our system and that arises because of the interaction between the individual spins, which can be considered as a behavior of cluster-spin glass GunnarssonPRL88 ; AnandPRB12 ; MukadamPRB05 . As we found that the value of T0 is close to the freezing temperature, suggests the presence of Ruderman-Kittel-Kasuya-Yosida (RKKY) interaction. Using the Tholence criterion TholencePB84 , where Tf is measured at smallest excitation frequency, we obtained = 0.07 and 0.06 for the 0.05 and 0.1 samples, respectively. These values are comparable to the RKKY spin glass systems (e.g., 0.07 for the CuMn system) TholencePB84 , and that suggest that our system falls in the category of RKKY spin glass. It is important to note here that the RKKY interactions are normally present in metallic systems and cannot present in band insulators. However, Hellman et al. reported spin-glass freezing with mixed antiferromagnetic and ferromagnetic interactions, and RKKY interaction in amorphous Gd-Si alloys, which are insulating or bad metallic, but nor band insulator HellmanPRL00 ; HelgrenPRB07 . The nature of RKKY-type indirect exchange mediated by high density of electrons, localized due to disorder where the variation of the density of states N(E) across the metal insulator transition may play crucial role HellmanPRL00 ; BokachevaPRB04 . Interestingly, Androulakis et al. proposed that a few existing itinerant electrons in LaCoO3 can couple ferromagnetically via short range RKKY interactions at low temperatures AndroulakisPRB01 . In this context note that the La(1-2x)Sr2xCo(1-x)NbxO3 samples show insulating nature, but not a band insulator AndroulakisPRB01 ; RadwanskiPB05 and it is consistent for the 0.05 sample where we observed larger value of N(E) from resistivity analysis, discussed later. This analysis motivates for further experimental and theoretical studies on LaCoO3.
We found that the value of obtained from the power law is one order of magnitude smaller than obtained from the VF law for the 0.05, whereas for the 0.1 both values are comparable. Further, in the frame of VF model, when T0 E/kB indicates a strong coupling, while T0 E/kB signifies the weak coupling between magnetic entities ShtrikmanPLA81 . For our case as observed prior 0.1 has strong coupling in comparison to 0.05, sample. To further understand the spin glass dynamics we analyzed the data according to the formalism proposed by Ogielski OgielskiPRB8587 , / = , where is the average correlation time. We have plotted vs in the log-log scale near the Tf in the Figure 8(d). At a given value of T, as depicted above we get a frequency independent value of in lower frequency limit. This frequency independent value is estimated by extrapolating each curve up to the lowest excitation frequency ( 9 Hz). Fitting the values extracted from the low frequency limit results the =1.510-7 s, T11.5 K. The value of for the 0.05 sample is comparable to the calculated previously, which confirms that the spin dynamics is slower than expected for the typical SG systems.
For the dynamical scaling of the imaginary part of ac-susceptibility, two exponents z and are used and we followed the scaling formulation given below GeschwindPRB90 ; MarcanoPRB19 ,
where F is the universal scaling function, = (T-TSG)/TSG, and is the order parameter. In Figure 8(e), we present the dynamical scaling for =0.05 sample, where all the curves fall on the same line with the values of z 8.5 and 0.5. For the further verification of these values with the theory, we have also plotted in Figure 8(f) the other scaling equation BitlaPRB12 ; NairPRB07 in terms of
where G is the scaling function, which is expected to highlight any departures from the scaling equation due to higher sensitivity of the abscissa and ordinate scales, and it resembles the plot of versus temperature curve for all frequencies merged to a single curve, see Figure 8(f).
III.4 D. Low temperature neutron study
Now for the detailed investigation of magnetic phase, we have performed neutron diffraction at 3 K, see Figures 9(a–c).
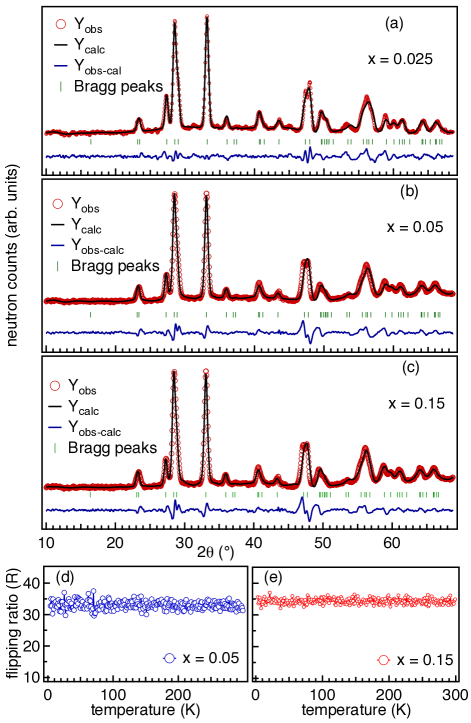
Neither additional magnetic Bragg peaks nor enhancement in the intensity of fundamental nuclear Bragg peaks has been observed at 3 K DurandJPCM13 , ruling out the presence of a ferromagnetic/antiferromagnetic ordering SikolenkoJPCM09 ; RajeevanJMMM15 . Further, we carried out neutron depolarization study down to 3 K on the 0.05 and 0.15 samples [Figures 9(d, e)], where no depolarization of neutron beam was observed ruling out the presence of any FM domains/clusters.
III.5 E. Resistivity measurements
The parent sample LaCoO3 shows an insulating ground state, which can be tuned towards the metallic state by substituting Sr at La site WuPRB03 , whereas the substitution of Nb at Co site drives the system towards the insulating regime OygardenJSSC12 . Here we study the effect of co-substitution on the transport properties. The resistivity data are presented in Figure 10.
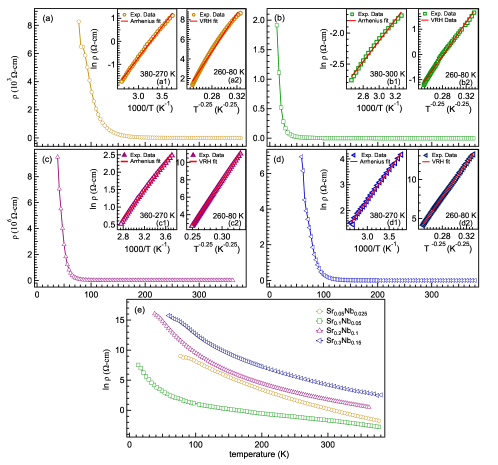
The electrical resistivity data show that all the samples are insulating and the resistivity increases from cm to Mcm when the temperature decreases from 380 K to low temperatures. The electrical resistivity at low temperatures could not be measured because of compliance limit of the measuring instrument and highly insulating nature of 0.025 and 0.15 samples. To explain the electrical conduction we have fitted the data with Arrhenius and variable range hopping (VRH) models in the high and low temperature regimes, respectively ShuklaPRB18 . We use the localization length comparable to the La/Co–O bond length and estimated the value of density of states near the Fermi level N(EF)(eV-1cm-3) using the VRH model.
| samples | VRH Model | Arrhenius Model |
| (%) | T0(K), N(E)(eV-1cm-3) | Ea(meV) |
| 0.025 | 8.9107, 3.21020 | 1443 |
| 0.05 | 1.2106, 2.31022 | 1322 |
| 0.1 | 1.1108, 2.71020 | 1772 |
| 0.15 | 1.4108, 2.01020 | 2042 |
The density of states decreases with , this suggest that the samples are becoming more insulating in nature. The calculated values of the activation energy show that the insulating nature enhances with the increased substitution, and is in meV range [see Table IV], however, such small activation energy is expected to result in a semiconducting nature as it is in the case of LaCoO3 with Ea120 meV ZobelPRB02 . We have calculated the value of activation energy as well as density of states near the Fermi level using the fitting parameters, as presented in the Table IV. Interestingly, for the 0.05 sample, the activation energy is significantly lower and N(EF) is also two order of magnitude higher than the other samples EnglishPRB02 . This makes it consistent with the observed signature of RKKY like interaction in this sample from ac-susceptibility analysis, as discussed earlier.
III.6 F. X-ray photoelectron spectroscopy study
We now move to the study of electronic properties of 0.05 and 0.1 samples using x-ray photomeission spectroscopy (XPS). The room temperature XPS core level spectra are presented in Figures 11 and 12. We observe that there is no significant shift in peak position within the limit of instrumental resolution. The Co 2 core level spectrum shows two main peaks, (corresponds to 2 and 2 at 779.5 eV and 795 eV, respectively) owing to the spin-orbit splitting of 15.5 eV and an intensity ratio close to 2:1 ChainaniPRB92 ; ChuangSS76 . These observations confirm that the Co is predominantly in the Co3+ state, as reported for LiCoO2 MosesASS07 and NaxCoO2 JugoviJALCOM19 . It also shows two loss features for each peak towards the higher binding energy (BE) side, known as the shake up satellites. The position of this satellite may suggest the presence of Co2+; however, if there is even 5% Co2+ present in the sample, the increases from 3.85 to 4.65 ShuklaPRB18 , which is significantly larger than what is observed from the magnetization measurements up to 0.1 sample, see table 3. Therefore, the formalism that the Co3+ valence state is preserved in LaCoO3, by co-substitution of Sr and Nb in 2:1 ratio, is consistent. In the transition metal oxides the satellite features can be explained with the charge transfer processes using molecular orbital theory or sudden approximation HufnerBOOK . The ground state of Co3+ can be associated with a ligand (O2- for the oxides) like 3d6L, where L is the highest occupied ligand shell i.e., 2 for the O2-. After the photoexcitation band lowers its energy and an electron is transferred from the ligand and that may lead to the satellite feature in Co 2 core-level.
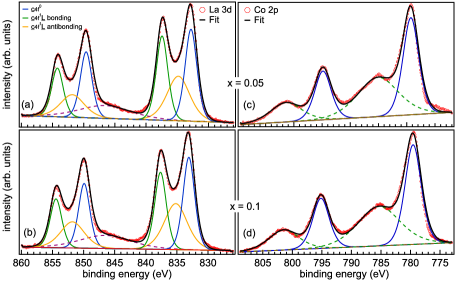
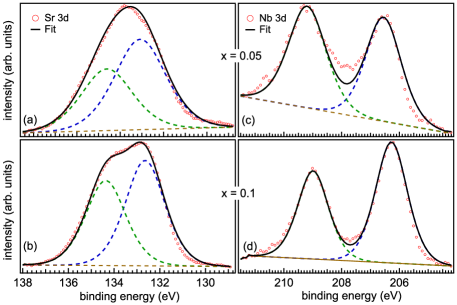
The La 3 spectrum shows four peaks ShuklaPRB18 , two peaks for each spin orbit component 3 and 3 alongwith two extra peaks due to the transfer of an electron from the oxygen valence band to the empty La 4 level LamPRB80 . The ionised La atoms have the 3 core level and 4 is the nearest unoccupied orbital, so a charge transfer from the ligand valence band O(2) to the 4 orbital and transfer of an electron from the 3 core level to the continuum is believed a reason behind this complex structure MullicaPRB85 ; SignorelliPRB73 . When we remove an electron from the core level we make the La ions more electronegative and then there is a possibility of electron withdrawal from the oxygen anions. Intensity of the observed satellite peaks depend on the electronegativity of the ligand molecule. For the fitting of La 3 core level spectra we follow the formalism used by Mullica et al. and hence each spin-orbit component is fitted with three components MullicaPRB85 . The main peaks at the lower binding energy (832.8 eV and 849.6 eV for the 3d5/2 and 3d3/2, respectively) corresponds to the final state without charge transfer, i.e., 34 in La3+ and denoted by the c4, where c denotes the presence of a core hole and 4 indicates absence of an electron in the 4 orbital. Other two peaks at the higher binding energies are bonding and antibonding of the final state denoted as c4L, which indicates a charge transfer from O(2) ligand to the metal 4 orbital. The respective de-convoluted components are defined in Figure 11(a). It is important to note that unoccupied 4 orbital of the La3+ resides above the valence band; therefore an electron transfer to the 4 orbital will be an energy loss process SignorelliPRB73 ; SarmaCP82 . Figures 12 (a, b) show Sr 3 and Nb 3 core levels, which are fitted using Voigt function in CasaXPS software, after subtracting inelastic Tougaard background. The position of Sr 3 core level has been observed at 132.8 eV binding energy (BE) corresponds to the valency of 2+, which is close to the reported in refs. JongPRB09 ; GuoPRB10 . The Nb 3 core levels of both the samples are shown in Figures 12 (c, d), which clearly have spin orbit peaks 3 and 3 at 206.5 eV and 209 eV, respectively. This confirms the existence of Nb in the 5+ valence state ShuklaPRB18 ; SasaharaJPCC13 .
Conclusions
In this study we have investigated the structural, magnetic, and electronic transport properties with the Sr/Nb co-substitution (hole as well as electron) in LaCoO3, i.e., La(1-2x)Sr2xCo(1-x)NbxO3. The recorded room temperature powder x-ray diffraction data are refined with rhombohedral symmetry, and no structural transition has been observed, but unit cell volume increases with . The magnetization values increases significantly with respect to the 0 sample and the coercivity also changes. The calculated values of effective magnetic moment confirm the spin state of Co3+ in intermediate and high spin-states in the 50:50 ratio. The ac-susceptibility measurements show the change in Tf with the excitation frequency, which indicate spin-glass behavior in the system. The extracted relaxation time suggests slower spin dynamics, which confirms the cluster spin glass. Also, the Tholence criterion suggests the presence of RKKY interactions in 0.05 sample, which is consistent as the density of states are two order of magnitude larger in this case. The neutron diffraction and depolarization data provide a strong support at microscopic and mesoscopic length scales, respectively, to the observed spin-glass state.The dc-transport properties manifest that co-substitution drives the system towards insulating regime, and we extracted the activation energy and density of states. The x-ray photoemission measurements confirm that the Co ions predominantly exist in the 3+ valence state and shakeup satellite features exists due to the ligand interaction. The La 3 core level spectra show a complex peak structure due to the electron transfer between the ligand and unoccupied 4 level. We also confirm the valence state of Sr and Nb as 2+ and 5+, respectively.
Acknowledgments
RS gratefully acknowledge the DST-Inspire, India for fellowship. We would like to thank the research facilities: XRD, PPMS EVERCOOL-II at IIT Delhi. The powder neutron diffraction and ac-susceptibility measurements are supported under CRS project no. UDCSR/MUM/AO/CRS-M-270/2017/567. We thank Ploybussara Gomasang for help in the XPS measurements. The XPS measurements were supported by Sakura Science Program (aPBL), Shibaura Institute of Technology, under the Top Global University Project, Designed by Ministry of Education, Culture, Sports, Science and Technology in Japan. We also thank Vivek Anand, Priyanka, Mahesh Chandra, and Ajay Kumar for useful discussions and help. We thank SERB-DST for financial support through Early Career Research (ECR) Award (project reference no. ECR/2015/000159). Some facilities have been used in this study which are supported by BRNS through DAE Young Scientist Research Award project sanction No. 34/20/12/2015/BRNS.
References
- (1) M. Abbate, J. C. Fuggle, A. Fujimori, L. H. Tjeng, C. T. Chen, R. Potze, G. A. Sawatzky, H. Eisaki, and S. Uchida, Electronic structure and spin-state transition of LaCoO3, Phys. Rev. B 47, 16124 (1993).
- (2) M. A. Korotin, S. Yu. Ezhov, I. V. Solovyev, V. I. Anisimov, D. I. Khomskii, and G. A. Sawatzky, Intermediate-spin state and properties of LaCoO3, Phys. Rev. B 54, 5309 (1996).
- (3) M. W. Haverkort, Z. Hu, J. C. Cezar, T. Burnus, H. Hartmann, M. Reuther, C. Zobel, T. Lorenz, A. Tanaka, N. B. Brookes, H. H. Hsieh, H.-J. Lin, C. T. Chen, and L. H. Tjeng, Spin state transition in LaCoO3 studied using soft x-ray absorption spectroscopy and magnetic circular dichroism, Phys. Rev. Lett. 97, 176405 (2006).
- (4) M. M. Altarawneh, G.-W. Chern, N. Harrison, C. D. Batista, A. Uchida, M. Jaime, D. G. Rickel, S. A. Crooker, C. H. Mielke, J. B. Betts, J. F. Mitchell, and M. J. R. Hoch, Cascade of magnetic field induced spin transitions in LaCoO3, Phys. Rev. Lett. 109, 037201 (2012).
- (5) P. Augustinsk, V. Kpek, and J. Kune, Doping induced spin state transition in LaCoO3: dynamical mean-field study, Phys. Rev. Lett. 110, 267204 (2013).
- (6) B. Chakrabarti, T. Birol, and K. Haule, Role of entropy and structural parameters in the spin-state transition of LaCoO3, Phys. Rev. M 1, 064403 (2017).
- (7) R. Shukla and R. S. Dhaka, Anomalous magnetic and spin glass behavior in Nb-substituted LaCo1-xNbxO3, Phys. Rev. B 97, 024430 (2018).
- (8) A. Ishikawa, J. Nohara, and S. Sugai, Raman study of the orbital-phonon coupling in LaCoO3, Phys. Rev. Lett. 93, 136401 (2004).
- (9) S. R. English, J. Wu, and C. Leighton, Thermally excited spin-disorder contribution to the resistivity of LaCoO3, Phys. Rev. B 65, 220407 (2002).
- (10) C. Zobel, M. Kriener, D. Bruns, J. Baier, M. Grninger, T. Lorenz, P. Reutler, and A. Revcolevschi, Evidence for a low-spin to intermediate-spin state transition in LaCoO3, Phys. Rev. B 66, 020402(R) (2002).
- (11) S. Yamaguchi, Y. Okimoto, and Y. Tokura, Local lattice distortion during the spin-state transition in LaCoO3, Phys. Rev. B 55, R8666 (1997).
- (12) T. Saitoh, T. Mizokawa, A. Fujimori, M. Abbate, Y. Takeda, and M. Takano, Electronic structure and temperature-induced paramagnetism in LaCoO3, Phys. Rev. B 55, 4257 (1997).
- (13) D. P. Kozlenko, N. O. Golosova, Z. Jirk, L. S. Dubrovinsky, B. N. Savenko, M. G. Tucker, Y. Le Godec, and V. P. Glazkov, Temperature and pressure-driven spin-state transitions in LaCoO3, Phys. Rev. B 75, 064422 (2007).
- (14) R. P. Vasquez, X-ray photoemission measurements of La1-xCaxCoO3 ( 0, 0.5), Phys. Rev. B 54, 14938 (1996).
- (15) M. Kriener, C. Zobel, A. Reichl, J. Baier, M. Cwik, K.Berggold, H. Kierspel, O. Zabara, A. Freimuth, and T. Lorenz, Structure, magnetization, and resistivity of La1-xMxCoO3 (M=Ca, Sr, and Ba), Phys. Rev. B 69, 094417 (2004).
- (16) K. Sato, A. Matsuo, K. Kindo, Y. Hara, K. Nakaoka, Y. Kobayashi, and K. Asai, Field-induced spin-state transition in LaCo1-xMxO3 (M = Al, Ga, Rh, and Ir), J. Phys. Soc. Jap. 83, 114712 (2014).
- (17) S. V. Streltsov, V. V. Gapontsev, and D. I. Khomskii, Valence states and possible charge ordering in LaCo1-xRhxO3, J. Phys.: Condens. Matter 28, 086005 (2016).
- (18) D. V. Karpinsky, I. O. Troyanchuk, K. Brner, H. Szymczak, and M. Tovar, Crystal structure and magnetic ordering of the LaCo1-xFexO3 system, J. Phys.: Condens. Matter 17, 7219 (2005).
- (19) I. .-Serrano, G. J. Cuello, M. L. Lpez, A. J.-Lpez, C. Pico, E. R.-Castelln, E. Rodrguez, and M. L. Veiga, Magnetic behaviour governed by Co spin transitions in LaCo1-xTixO3 (0x0.5) perovskite oxides, J. Phys. D: Appl. Phys. 41, 195001 (2008).
- (20) K. Yoshii and H. Abe, Doping effects of Ru in L0.5Sr0.5CoO3 (L = La, Pr, Nd, Sm, and Eu), Phys. Rev. B. 67, 094408 (2003).
- (21) D. Hammer, J. Wu, and C. Leighton, Metal-insulator transition, giant negative magnetoresistance, and ferromagnetism in LaCo1-yNiyO3, Phys. Rev. B 69, 134407 (2004).
- (22) J. Baier, S. Jodlauk, M. Kriener, A. Reichl, C. Zobel, H. Kierspel, A. Freimuth, and T. Lorenz, Spin-state transition and metal-insulator transition in La1-xEuxCoO3, Phys. Rev. B 71, 014443 (2005).
- (23) M. Kriener, M. Braden, H. Kierspel, D. Senff, O. Zabara, C. Zobel, and T. Lorenz, Magnetic and structural transitions in La1-xAxCoO3 (A=Ca, Sr, and Ba), Phys. Rev. B 79, 224104 (2009).
- (24) I. O. Troyanchuk, D. V. Karpinsky, and R. Szymczak, Possible ferromagnetic interactions between IS Co3+ ions in Nb doped cobaltites, Phys. Stat. Sol. (b) 242, 49 (2005).
- (25) P. G. Radaelli and S. W. Cheong, Structural phenomena associated with the spin-state transition in LaCoO3, Phys. Rev. B 66, 094408 (2002).
- (26) R. D. Shannon, Revised effective ionic radii and systematic studies of interatomic distances in halides and chalcogenides, Acta Crystallogr., Sect. A 32, 751 (1976).
- (27) R. D. Shannon and C. T. Prewitt, Effective ionic radii in oxides and fluorides, Acta Crystallogr. Sect. B 25, 925 (1969).
- (28) P. M. Raccah and J. B. Goodenough, Localized-electron to collective-electron transition in the system (La, Sr)CoO3, J. Appl. Phys. 39, 1209 (1968).
- (29) T. Kymen, Y. Asaka, and M. Itoh, Negative cooperative effect on the spin-state excitation in LaCoO3, Phys. Rev. B 67, 144424 (2003).
- (30) J. Wu and C. Leighton, Glassy ferromagnetism and magnetic phase separation in La1-xSrxCoO3, Phys. Rev. B 67, 174408 (2003).
- (31) Ravi Prakash, Rishabh Shukla, Priyanka Nehla, Anita Dhaka, and R. S. Dhaka, Tuning ferromagnetism and spin state in La1-xAxCoO3 (A =Sr, Ca) nanoparticles, J. Alloys Compd. 764, 379 (2018).
- (32) M. A. Senaris-Rodrguez and J. B. Goodenough, Magnetic and transport properties of the system La1-xSrxCoO3-δ , J. Solid State Chem. 118, 323 (1995).
- (33) M. Itoh, I. Natori, S. Kubota, and K. Motoya, Hole doping effect on magnetic properties of La1-xSrxCoO3(0 x 0.5), J. Magn. Magn. Mater. 140, 1811 (1995).
- (34) C. Zener, Interaction between the d shells in the transition metals, Phys. Rev. 81, 440 (1951).
- (35) C. Zener, Interaction between the d-Shells in the transition metals. II. ferromagnetic compounds of manganese with perovskite structure, Phys. Rev. 82, 403 (1951).
- (36) D. N. H. Nam, K. Jonason, P. Nordblad, N. V. Khiem, and N. X. Phuc, Coexistence of ferromagnetic and glassy behavior in the La0.5Sr0.5CoO3 perovskite compound, Phys. Rev. B 59, 4189 (1999).
- (37) V. Oygarden, H. L. Lein, and T. Grande, Structure, thermal expansion and electrical conductivity of Nb-substituted LaCoO3, J. Solid State Chem., 192, 246 (2012).
- (38) L. Pauling, The principles determining the structure of complex ionic crystals, J. Amer. Chem. Soc. 51, 1010 (1929).
- (39) A. T. Ogielski, Dynamics of three-dimensional Ising spin glasses in thermal equilibrium, Phys. Rev. B 32, 7384 (1985); P. Granberg, P. Svedlindh, P. Nordblad, L. Lundgren, and H. S. Chen, Dynamics of fluctuations in the ordered phase of kinetic Ising models, Phys. Rev. B 35, 2075 (1987).
- (40) D. Altermatt and I. D. Brown, The automatic searching for chemical bonds in inorganic crystal structures, Acta Cryst. B41, 244 (1985).
- (41) I. D. Brown and R. D. Shannon, Bond-valence parameters obtained from a systematic analysis of the inorganic crystal structure database, Acta Cryst. A29, 266 (1973).
- (42) A. M. Durand, D. P. Belanger, C. H. Booth, F. Ye, S. Chi, J. A. Fernandez-Baca, and M Bhat, Magnetism and phase transitions in LaCoO3, J. Phys.: Condens. Matter 25, 382203 (2013).
- (43) A. M. Durand, D. P. Belanger, T. J. Hamil, F. Ye, S. Chi, J. A. Fernandez-Baca, C. H. Booth, Y. Abdollahian, and M Bhat, The unusual magnetism of nanoparticle LaCoO3, J. Phys.: Condens. Matter 27, 176003 (2015).
- (44) J. -Q. Yan, J. -S. Zhou, and J. B. Goodenough, Ferromagnetism in LaCoO3, Phys. Rev. B 70, 014402 (2004).
- (45) J. Androulakis, N. Katsarakis, and J. Giapintzakis, Ferromagnetic and antiferromagnetic interactions in lanthanum cobalt oxide at low temperatures, Phys. Rev. B 64, 174401 (2001).
- (46) H. Guo, K. Manna, H. Luetkens, M. Hoelzel, and A. C. Komarek, Spin glass behavior in LaCo1-xRhxO3 ( 0.4, 0.5, and 0.6), Phys. Rev. B 94, 205128 (2016).
- (47) I. O. Troyanchuk, D. V. Karpinsky, and R. Szymczak, Spin state and magnetic interaction of cobalt ions in niobium-doped cobaltites, Phys. Solid State, 48, 722 (2006).
- (48) D. P. Belanger, T. Keiber, F. Bridges, A. M. Durand, A. Mehta, H. Zheng, J. F. Mitchell, and V. Borzenets, Structure and magnetism in LaCoO3, J. Phys.: Condens. Matter 28, 025602 (2016).
- (49) D. Fuchs, E. Arac, C. Pinta, S. Schuppler, R. Schneider, and H. v. Lhneysen, Tuning the magnetic properties of LaCoO3 thin films by epitaxial strain, Phys. Rev. B 77, 014434 (2008).
- (50) C. Sow, D. Samal, P. S. Anil Kumar, A. K. Bera, and S. M. Yusuf, Structural-modulation-driven low-temperature glassy behavior in SrRuO3, Phys. Rev. B 85, 224426 (2012).
- (51) J. A. Mydosh, Spin glasses: an experimental introduction (Taylor and Francis, London), (1993).
- (52) N. Hanasaki, K. Watanabe, T. Ohtsuka, I. Kezsmarki, S. Iguchi, S. Miyasaka, and Y. Tokura, Nature of the transition between a ferromagnetic metal and a spin-glass insulator in pyrochlore molybdates, Phys. Rev. Lett. 99, 086401 (2007).
- (53) A. Malinowski, V. L. Bezusyy, R. Minikayev, P. Dziawa, Y. Syryanyy, and M. Sawicki, Spin-glass behavior in Ni-doped La1.85Sr0.15CuO4, Phys. Rev. B 84, 024409 (2011).
- (54) M. Sasaki, P. E. Jnsson, and H. Takayama, Aging and memory effects in superparamagnets and superspin glasses, Phys. Rev. B 71, 104405 (2005).
- (55) D. N. H. Nam, R. Mathieu, P. Nordblad, N. V. Khiem, and N. X. Phuc, Spin-glass dynamics of La0.95Sr0.05CoO3, Phys. Rev. B 62, 8989 (2000).
- (56) J. Souletie and J. L. Tholence, Critical slowing down in spin glasses and other glasses: fulcher versus power law, Phys. Rev. B 32, 516(R) (1985).
- (57) K. Gunnarsson, P. Svedlindh, P. Nordblad, L. Lundgren, H. Aruga, and A. Ito, Dynamics of an ising spin-glass in the vicinity of the spin-glass temperature, Phys. Rev. Lett. 61, 754 (1988).
- (58) V. K. Anand, D. T. Adroja, and A. D. Hillier, Ferromagnetic cluster spin-glass behavior in PrRhSn3, Phys. Rev. B 85, 014418 (2012).
- (59) M. D. Mukadam, S. M. Yusuf, P. Sharma, S. K. Kulshreshtha, and G. K. Dey, Dynamics of spin clusters in amorphous Fe2O3, Phys. Rev. B 72, 174408 (2005).
- (60) J. L. Tholence, On the frequency dependence of the transition temperature in spin glasses, Phys. B (Amsterdam) 126, 157 (1984).
- (61) F. Hellman, D. R. Queen, R. M. Potok, and B. L. Zink, Spin-glass freezing and RKKY interactions near the metal insulator transition in amorphous Gd-Si alloys, Phys. Rev. Lett. 84, 5411 (2000).
- (62) E. Helgren, F. Hellman, L. Zeng, N. Sinenian, R. Islam, and D. J. Smith, Magnetic and transport properties of amorphous GdxGe1-x alloys near the metal-insulator transition, Phys. Rev. B 76, 184440 (2007).
- (63) L. Bokacheva, W. Teizer, F. Hellman, and R. C. Dynes, Variation of the density of states in amorphous GdSi at the metal-insulator transition, Phys. Rev. B 69, 235111 (2004).
- (64) R. J. Radwanski, Z. Ropka, Strongly correlated crystal-field approach to Mott insulator LaCoO3, Physica B 359, 1354 (2005).
- (65) S. Shtrikman and E. Wohlfarth, The theory of the Vogel-Fulcher law of spin glasses, Phys. Lett. A 85, 467 (1981).
- (66) S. Geschwind, D. A. Huse, and G. E. Devlin, New approach to critical dynamic scaling in random magnets, Phys. Rev. B 41, 4854 (1990).
- (67) N. Marcano, P. A. Algarabe, L. Fernndez Barqun, J. P. Araujo, A. M. Pereira, J. H. Belo, C. Magn, L. Morelln, and M. R. Ibarra, Cluster-glass dynamics of the Griffiths phase in Tb5-xLaxSi2Ge2, Phys. Rev. B 99, 054419 (2019).
- (68) Y. Bitla, S. N. Kaul, and L. Fernndez Barqun, Nonlinear susceptibilities as a probe to unambiguously distinguish between canonical and cluster spin glasses, Phys. Rev. B 86, 094405 (2012).
- (69) S. Nair and A. K. Nigam, Critical exponents and the correlation length in the manganite spin glass Eu0.5Ba0.5MnO3, Phys. Rev. B 75, 214415 (2007).
- (70) V. Sikolenko, V. Efimov, E. Efimova, A. Sazonov, C. Ritter, A. Kuzmin, and I. Troyanchuk, Neutron diffraction studies of structural and magnetic properties of niobium doped cobaltites, J. Phys.: Condens. Matter 21, 436002 (2009).
- (71) N. E. Rajeevan, Vinod Kumar, Rajesh Kumar, Ravi Kumar, S.D. Kaushik, Neutron diffraction studies of magnetic ordering in Ni-doped LaCoO3, J. Magn. Magn. Mater. 393, 394 (2015).
- (72) A. Chainani, M. Mathew, D.D. Sarma, Electron-spectroscopy study of the semiconductor-metal transition in La1-xSrxCoO3, Phys. Rev. B 46, 9976 (1992).
- (73) T. J. Chuang, C. R. Brundle, and D. W. Rice, Interpretation of the x-ray photoemission spectra of cobalt oxides and cobalt oxide surfaces, Surf. Sci. 59, 413 (1976).
- (74) A. W. Moses, H. G. Garcia-flores, J. G. Kim, and M. A. Langell, Surface properties of LiCoO2, LiNiO2 and LiNi1-xCoxO2, Appl. Surf. Sci. 253, 4782 (2007).
- (75) D. Jugovic, M. Milovic, M. Popovic, V. Kusigerski, S. Skapin, Z. Rakocevic, and M. Mitric, Effects of fluorination on the structure, magnetic and electrochemical properties of the P2-type NaxCoO2 powder, J. Alloys Compd. 774, 30 (2019).
- (76) S. Hfner, Photoelectron spectroscopy; principles and applications, ISBN 978-3-662-09280-4, (2nd edition), Springer, US, (1996).
- (77) D. J. Lam, D. W. Veal, and D. E. Ellis, Electronic structure of lanthanum perovskites with 3 transition elements, Phys. Rev. B 22, 5730 (1980).
- (78) D. F. Mullica, C. K. C. Lok, H.O. Perkins, and V. Young, X-ray photoelectron final-state screening in La(OH)3: A multiplet structural analysis, Phys. Rev. B 31, 4039 (1985).
- (79) A. J. Signorelli, and R. G. Hayes, X-ray photoelectron spectroscopy of various core levels of lanthanide ious: the roles of monopole excitation and electrostatic coupling, Phys. Rev. B. 8, 81 (1973).
- (80) D. D. Sarma, P. V. Kamath, and C. N. R. Rao, Satellites in the x-ray photoelectron spectra of transition-metal and rare-earth compounds, Chem. Phys. 73, 71 (1982).
- (81) S. de Jong, F. Massee, Y. Huang, M. Gorgoi, F. Schaefers, J. Fink, A. T. Boothroyd, D. Prabhakaran, J. B. Goedkoop, and M. S. Golden, High-resolution hard x-ray photoemission investigation of La2-2xSr1+2xMn2O7 (0.300.50): microscopic phase separation and surface electronic structure of a bilayer colossal magnetoresistance manganite, Phys. Rev. B. 80, 205108 (2009).
- (82) H. Guo, Y. Li, D. Urbina, B. Hu, R. Jin, T. Liu, D. Fobes, Z. Mao, E. W. Plummer, and J. Zhang, Doping and dimensionality effects on the core-level spectra of layered ruthenates, Phys. Rev. B. 80, 205108 (2009).
- (83) A. Sasahara and M. Tomitori, XPS and STM Study of Nb-Doped TiO2(110)-(11) Surfaces, J. Phys. Chem. C 117, 17680 (2013).