Generation and Characterization of Tailored MIR Waveforms for Steering Molecular Dynamics
Abstract
The dream of physico-chemists to control molecular reactions with light beyond electronic excitations pushes the development of laser pulse shaping capabilities in the mid-infrared (MIR) spectral range. Here, we present a compact optical parametric amplifier platform for the generation and shaping of MIR laser pulses in the wavelength range between and . Opportunities for judiciously tailoring the electromagnetic waveform are investigated, demonstrating light field control with a spectral resolution of at a total spectral bandwidth of . In experiments focusing on spectral amplitude manipulation these parameters result in a time window of available for shaping the temporal pulse envelope and a phase modulation resolution of for several picosecond delays.
Keywords Mid-infrared OPA Pulse Shaping
1 Introduction
Microscopic understanding of chemical dynamics on a molecular level is of fundamental importance in many science disciplines. Current objectives range from unravelling ultrafast transitions in processes relevant to life [1] to optimizing the efficiency of catalytic processes in material science [2, 3]. The gained knowledge will contribute in modern drug design and will help develop materials with novel functionalities [4, 5]. Molecular function manifests itself in time-dependent changes of geometric structure, i. e. bond distances and bond angles describing the molecular dynamics of the system. With the advent of ultrafast laser pulses in the visible and near-infrared spectral range, the vast majority of spectroscopic studies traced photo-induced processes in electronically excited states [6]. However, most chemical reactions of importance to nature and technological applications do not depend on photo excitation. Instead thermal energy and activation barriers govern reaction rates [7]. Ultrashort deliberately shaped mid-infrared (MIR) laser pulses are well-suited for a systematic investigation of these reactions, because they provide three key properties [6, 8]. First, their interaction takes place on the immanent time scales of molecular dynamics. Second, room temperature black body radiation has the maximum emittance around , consequently MIR radiation is well suited to trigger thermal dynamics in a natural environment. Finally deliberate control of the time-frequency distribution of broadband MIR radiation makes it possible to address particular reaction coordinates with a high specificity, i. e. vibrational modes of interest [8]. Thereby even reaction pathways can be driven, which are typically not favoured by solely thermally controlled molecular ensembles [9]. In addition, to initiate and monitor molecular dynamics (reactivity/functionality) in space and time requires the formation of quantum mechanical wave packets by coherent coupling of atomic wave functions. Femtosecond MIR laser pulses generated by optical parametric amplification (OPA) can prepare nuclear wave packets in molecular ensembles avoiding electronic excitation. Use of carrier-envelope phase-stable (CEP-stable) pulses provides control of vibrational wave packets and thereby steering of directed nuclear motion and localization [10, 11]. Ultrashort MIR radiation pulses allows to overcome showstopping intramolecular vibrational energy redistribution. For example, if energy can be deposited in specific vibrational modes fast enough, high excitation levels can be reached before the excitation thermalizes by redistributing over all accessible vibrational degrees of freedom [9, 12]. These experimental schemes may be regarded as non chemical (light) stimuli to drive and possibly steer molecular dynamics. In the present contribution we describe and characterize a modular laser infrastructure that has been developed for this purpose.
2 Adjustable 8–15 OPA Design
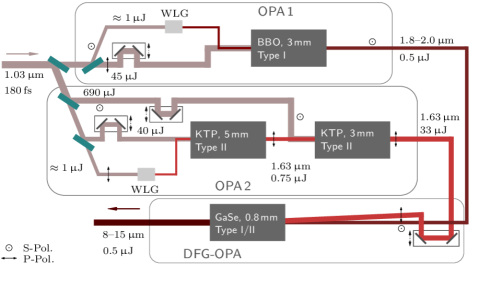
Broadband CEP-stable laser pulses are generated by a compact OPA system similar to the setup described by Sell et al. [13]. The pump laser pulses have an energy of ca. , with a full width at half maximum (FWHM) duration of ca. , and a wavelength of , generated by a commercial Yb-doped potassium gadolinium tungstate (Yb:KGW) optical oscillator and regenerative amplifier. The pump laser can be operated at repetition rates of around with the mentioned pulse energies. Its pulses are converted to MIR pulses whose central wavelength is tunable in the range between 8–. The frequency mixing can be performed in typical nonlinear optical crystals, such as AgGaSe2 and GaSe. These crystals exhibit fairly low linear and two-photon absorption coefficients in the wavelength range between ca. and [14] and have been used extensively in the past [15, 16, 17, 13, 18]. To avoid significant two-photon absorption by the pump pulses for MIR generation, intermediate OPA conversion steps are necessary. Thereby the final difference frequency generation (DFG) can be performed with pump wavelengths above [15, 17].
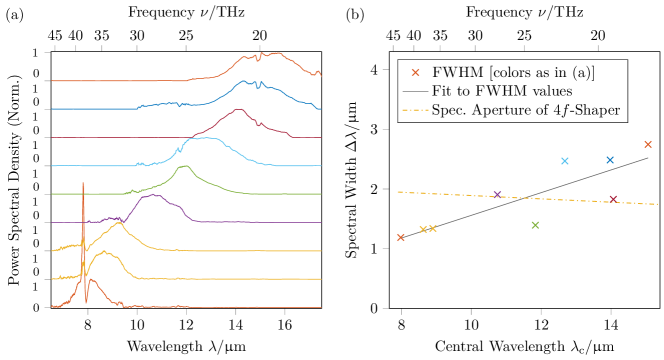
The first intermediate OPA conversion (‘OPA 1’) consists of a single-stage OPA based on -barium-borate (BBO) and the second of a two-stage OPA (‘OPA 2’) based on potassium titanyl phosphate (KTP), cf. Fig. 1. Two independent white light sources generate the coherent seeds used for each OPA, allowing for independent wavelength tuning [19, 20]. The continua are generated in bulk yttrium aluminium garnet (YAG) disks of and length. OPA 1, a single-stage BBO (, , type I phase matching) OPA, generates pulses with central wavelengths in between –, with energies of a few hundred nanojoule up to and bandwidths of up to at full width at half maximum (FWHM) of the spectral intensity. Variation of the central wavelength is achieved by changing the angle of the optical axis of the BBO crystal relative to the laser beam path. OPA 2 consists of two KTP stages with and long crystals, as shown in Fig. 1. Type II phase matching is achieved in the XZ-plane of the biaxial crystal under a phase-matching angle . OPA 2 generates pulses with pulse energies around and a spectral bandwidth of ca. at a central wavelength of . The MIR pulses are finally generated by overlapping the pulses from OPA 1 and OPA 2 in a thick GaSe crystal with a small angle of around . Varying the wavelength of OPA 1 can be used to choose the frequencies available for frequency mixing in the MIR OPA (‘DFG-OPA’). Thereby the central wavelength of the MIR pulses can be adjusted in the range between –. Pulse energies reach up to , at bandwidths of 15–18%, i. e. –. Spectra of various generated MIR pulses are presented in Fig. 2 (a) along with their spectral bandwidth presented in Fig. 2 (b). The pulse duration of the MIR-OPA is estimated to be in the range of , confirmed by using the DFG-OPA crystal for a cross-correlation between OPA 1 and OPA 2 taking material dispersion into account. The whole OPA architecture is assembled from standard opto-mechanical components and has a compact design fitting on a by breadboard.
3 Ultrafast MIR Pulse Shaping
3.1 The AOM MIR Pulse Shaper
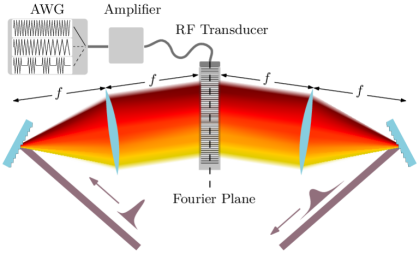
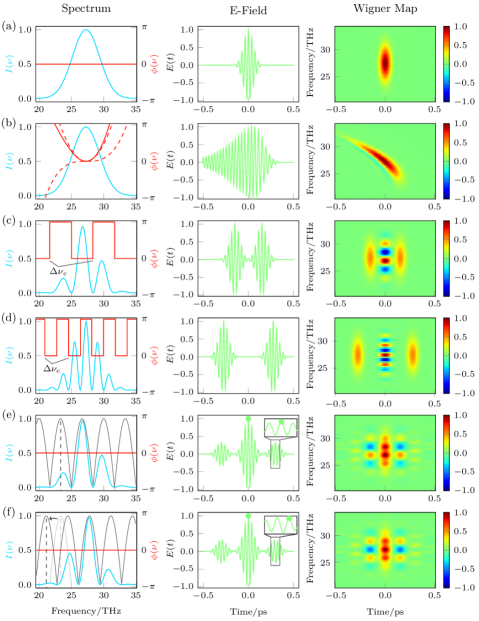
For MIR pulse shaping we used a germanium acousto-optic modulator (AOM) mask as the active element in a -configuration, developed in the group of Martin Zanni at University of Wisconsin, Madison [21]. It allows for the manipulation of the spectral amplitude and phase independently and thereby the time-frequency distribution of individual pulses [22]. This system was adapted to be used in the wavelength range around . The setup is sketched in Fig. 3. The active AOM is located in the Fourier plane of the -configuration. An arbitrary waveform generator (AWG) generates RF waveforms, which drive a transducer creating a quasi-stationary transmissive diffraction grating. We can therefore modify laser pulses from shot-to-shot, limited in our case by the RF amplifier duty-cycle, or otherwise by the propagation time of the acoustic mask over the full crystal length. Figure 4 gives examples of general pulse shapes that can be generated.
3.2 Shaping Window and Pulse Trains
Real world optical pulse shaping setups impose certain constraints to pulse shaping capabilities. Spectral resolution is in the present case constrained by the diffraction limited beam waist in the Fourier plane. Yet, the accessible spectral resolution is by itself not enough to determine the maximum accessible time window, i. e., the maximum allowed temporal delay between shaped components. The principle of spatial separation of the spectral components of the incoming beam in the -configuration implies a coupling between temporal delay of frequency components and lateral offset of the outgoing frequency components, cf. Monmayrant et al. and references therein. The consequence of this lateral shift may be a deteriorated focus of the beam and hence may affect the application of the beam in experiments [23, 24]. In this regard acousto-optic modulators exhibit an advantage compared to other technical realizations. While liquid crystal (LC) spatial light modulators have fixed pixel gaps in the mask, AOM masks have smooth edges of the effective pixels. Therefore the spatio-temporal coupling only depends on dispersion of the grating and beam size of the incoming beam [25, 26]. The following measurement was conducted to examine the size of the pulse shaping window. Pulse trains were used to sample the shaping window of the presented pulse shaping setup. Introducing a comb like structure in the spectral domain leads to pulse trains in the time domain. The separation period depends reciprocally on the frequency modulation period , i. e. . The corresponding effect is simulated in Fig. 4 (c) and (d).
3.2.1 Spectral Resolution and Pulse Separation
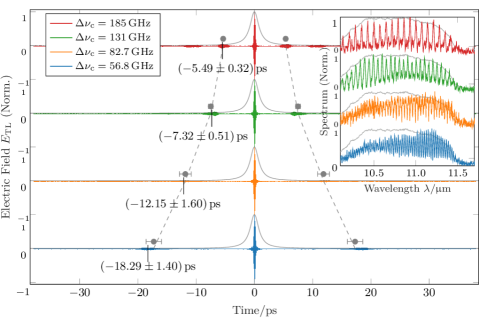
The pulse shaper was used to create comb-like amplitude masks, sequentially reducing the spacing of an on-off amplitude pattern. The inset in Fig. 5 shows the spectra, measured with a Fourier-transform infrared (FTIR) spectrometer. The spectra shown in Fig. 5 exhibit peaks of an average width of , equal to in frequency domain. This value is exceeded for the lowest spectrum in the inset of Fig. 5 given in blue, in which comb teeth have a width of only , corresponding to . Because the low resolution of is not achieved systematically, the resolution of the pulse shaping setup is taken to be when being used with an initial laser beam width of .
The spectral intensity was used to reconstruct the transform limited electric field time domain using:
| (1) |
where the spectral phase is assumed to be zero over the whole spectral range. Details of the mathematical procedure are described for instance in ref. [27]. In the measurements in presented Fig. 5, the distance between the comb teeth of the acoustic mask was decreased step by step. Therefore, the spectral period decreases from top to the lowest shown spectrum in the inset of the figure. The time domain signals show an increasing temporal spacing of the pulses in the pulse trains, as demonstrated in Fig. 4 (c) and (d). Figure 5 shows the position of the satellite pulses according to the spacing . The satellite pulses in the pulse train sample a time window given as a the gray solid lines. The satellite pulses are chirped and thereby stretched in time. The chirp is caused by the tilted geometry of the -configuration due to the Bragg reflection. The shape of the time window is close to a Lorentzian distribution and determines the intensity envelope of the shaping window with an FWHM duration of , refer to the gray lines in Fig. 5. Temporal separation of the pulses is observed up to delays of ca. , being measured roughly m behind the pulse shaper with an FTIR spectrometer.
3.2.2 CEP Modulation of Subsequent Pulses
In contrast to a beam splitting delay unit, such as a Michelson interferometer, pulse sequences from a pulse shaper are in general not generated as replicas of the incoming pulse. Identical replicas are generated by modulation of the spectral amplitude and phase with a cosine function, while arbitrary shaping of the individual pulses is achieved by separate interleaving combs [28, 29].
In a second measurement amplitude pulse shaping was used to demonstrate CEP modulation, which can be investigated by a simple spectrometer. Transform limited pulse trains are investigated as a test case for CEP modulation of pulse trains. The spectral intensity distribution does not contain information of the phase of the electric field. It can only be assumed that the spectral phase is of a certain shape. A constant spectral phase is assumed over the whole spectrum. It is then possible to perform amplitude pulse shaping, thereby modifying the relative CEP of the satellite pulses with respect to the central pulse in the pulse train. According to the Fourier shift theorem a shift in the spectrum by an amount leads to a phase shift in the electric field:
| (2) |
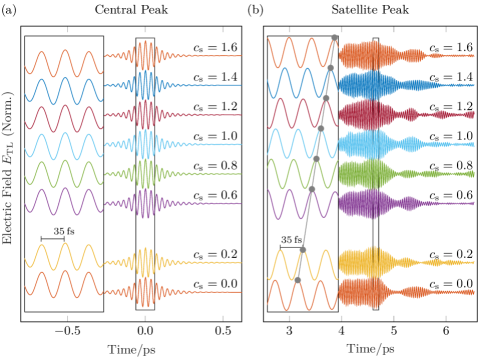
The simulation of this approach is shown in Fig. 4 (e) and (f) and was pursued in the following experiment. A comb mask with a fixed periodicity was shifted laterally in the Fourier plane, while the overall envelope of the spectrum stayed constant. The generated pulse trains thereby exhibit a fixed temporal separation. Only the relative CEP of the single pulses are modified. Figure 6 shows the central pulses and a satellite pulse of a pulse train as in the previous measurement. The CEP of the central pulse relative to the CEP of the satellite pulses is subsequently modified. The spectral comb pattern was shifted for 1.6 comb periods . As Fig. 6 (a) and (b) depict for transform-limited electric fields the CEP of the central pulse was not modified–its CEP is assumed to be –while the CEP of the first satellite peak shifts proportional to the lateral shift of the comb mask. The stability of the demonstrated relative CEP control in pulse trains is on the order of for pulse separations of . This value is derived from a fit to the phases and presented in the inset of Fig. 6 (b).
4 Conclusion
In the present paper we demonstrate a compact OPA setup generating sub-microjoule pulses in the long wavelength MIR covering 8–. The spectral bandwidth supports few-cycle pulses, while the OPA architecture delivers passively CEP-stable pulses. The spectral bandwidth of the pulses perfectly fits the spectral bandwidth that can be accessed by the implemented -configuration AOM pulse shaper. The pulse shaping capabilities of the setup are demonstrated for amplitude pulse shaping around . The reconstruction of the transform limited electric fields is used to determine the available time window for pulse shaping of . It is planned to extend the window in the near future by increasing the beam size of the MIR beam sent into the pulse shaper setup from to more than and thereby alleviate effects of lateral beam offsets due to spatio-temporal coupling discussed in the present contribution. Control of the relative CEP of subsequent pulses in a pulse train is found to be better than for delays in the range of several picoseconds. Table 1 summarizes the above evaluated values along with theoretical estimations. These are relevant for applications using the shaper platform with a total transmission of 10% to steer chemical dynamics in the electronic ground state.
| Parameter | Calculation | Measurement |
|---|---|---|
| () | ||
| () | ||
| 142∗ (262∗) | ||
| 90 | 84∗ (133∗) |
Funding
Cluster of Excellence ‘The Hamburg Centre for Ultrafast Imaging’ of the Deutsche Forschungsgemeinschaft (DFG) - EXC 1074 - project ID 194651731.
Acknowledgments
We thank Giulio M. Rossi, Robert Riedel, and Michael Schulz for fruitful discussions.
Disclosures
The authors declare that there are no conflicts of interest related to this article.
References
- [1] D. Polli, P. Altoè, O. Weingart, K. M. Spillane, C. Manzoni, D. Brida, G. Tomasello, G. Orlandi, P. Kukura, R. A. Mathies, M. Garavelli, and G. Cerullo, “Conical intersection dynamics of the primary photoisomerization event in vision,” Nature 467, 440–443 (2010).
- [2] H. Öström, H. Öberg, H. Xin, J. LaRue, M. Beye, M. Dell’Angela, J. Gladh, M. L. Ng, J. A. Sellberg, S. Kaya, G. Mercurio, D. Nordlund, M. Hantschmann, F. Hieke, D. Kühn, W. F. Schlotter, G. L. Dakovski, J. J. Turner, M. P. Minitti, A. Mitra, S. P. Moeller, A. Föhlisch, M. Wolf, W. Wurth, M. Persson, J. K. Nørskov, F. Abild-Pedersen, H. Ogasawara, L. G. M. Pettersson, and A. Nilsson, “Probing the transition state region in catalytic CO oxidation on Ru,” Science 347, 978–982 (2015).
- [3] J. M. Buriak, C. Toro, and K.-S. Choi, “Chemistry of materials for water splitting reactions,” Chemistry of Materials 30, 7325–7327 (2018).
- [4] C. H. Reynolds, D. Ringe, and K. M. Merz, Drug Design: Structure- and Ligand-based Approaches (Cambridge University Press, Cambridge, 2010).
- [5] D. Matzov, A. Bashan, and A. Yonath, “A bright future for antibiotics?” Annual Review of Biochemistry 86, 567–583 (2017). PMID: 28654325.
- [6] E. T. Nibbering, H. Fidder, and E. Pines, “Ultrafast chemistry: Using time-resolved vibrational spectroscopy for interrogation of structural dynamics,” Annual Review of Physical Chemistry 56, 337–367 (2005). PMID: 15796704.
- [7] T. Stensitzki, Y. Yang, V. Kozich, A. A. Ahmed, F. Kössl, O. Kühn, and K. Heyne, “Acceleration of a ground-state reaction by selective femtosecond-infrared-laser-pulse excitation,” Nature Chemistry 10, 126 (2018). Article.
- [8] C. Gollub, M. Kowalewski, S. Thallmair, and R. de Vivie-Riedle, “Chemoselective quantum control of carbonyl bonds in Grignard reactions using shaped laser pulses,” Physical Chemistry Chemical Physics 12, 15780–15787 (2010).
- [9] S. K. Lee, A. G. Suits, H. B. Schlegel, and W. Li, “A reaction accelerator: Mid-infrared strong field dissociation yields mode-selective chemistry,” The Journal of Physical Chemistry Letters 3, 2541–2547 (2012). PMID: 26295872.
- [10] S. Thallmair, D. Keefer, F. Rott, and R. de Vivie-Riedle, “Simulating the control of molecular reactions via modulated light fields: from gas phase to solution,” Journal of Physics B: Atomic, Molecular and Optical Physics 50, 082001 (2017).
- [11] H. Daoud, L. Joubert-Doriol, A. F. Izmaylov, and R. D. Miller, “Exploring vibrational ladder climbing in vibronic coupling models: Toward experimental observation of a geometric phase signature of a conical intersection,” Chemical Physics 515, 28 – 35 (2018). Also on arXiv: https://arxiv.org/abs/1804.09863.
- [12] L. Windhorn, J. S. Yeston, T. Witte, W. Fuß, M. Motzkus, D. Proch, K.-L. Kompa, and C. B. Moore, “Getting ahead of ivr: A demonstration of mid-infrared induced molecular dissociation on a sub-statistical time scale,” The Journal of Chemical Physics 119, 641–645 (2003).
- [13] A. Sell, A. Leitenstorfer, and R. Huber, “Phase-locked generation and field-resolved detection of widely tunable terahertz pulses with amplitudes exceeding 100 MV/cm.” Optics letters 33, 2767–2769 (2008).
- [14] D. N. Nikogosyan, Nonlinear Optical Crystals (Springer Science+Business Media, Inc., 233 Spring Street , New York, NY 10013, USA, 2005).
- [15] R. A. Kaindl, M. Wurm, K. Reimann, P. Hamm, A. M. Weiner, and M. Woerner, “Generation, shaping, and characterization of intense femtosecond pulses tunable from 3 to ,” Journal of the Optical Society of America B 17, 2086 (2000).
- [16] J. M. Fraser, I. W. Cheung, F. Légaré, D. M. Villeneuve, J. P. Likforman, M. Joffre, and P. B. Corkum, “High-energy sub-picosecond pulse generation from 3 to ,” Applied Physics B: Lasers and Optics 74, 153–156 (2002).
- [17] C. Ventalon, J. M. Fraser, J.-P. Likforman, D. M. Villeneuve, P. B. Corkum, and M. Joffre, “Generation and complete characterization of intense mid-infrared ultrashort pulses,” Journal of the Optical Society of America B 23, 332 (2006).
- [18] M. Beutler, I. Rimke, E. Büttner, P. Farinello, A. Agnesi, V. Badikov, D. Badikov, and V. Petrov, “Difference-frequency generation of ultrashort pulses in the mid-ir using yb-fiber pump systems and aggase2,” Opt. Express 23, 2730–2736 (2015).
- [19] M. Bradler, P. Baum, and E. Riedle, “Femtosecond continuum generation in bulk laser host materials with sub-J pump pulses,” Applied Physics B: Lasers and Optics 97, 561–574 (2009).
- [20] M. Bellini and T. W. Hänsch, “Phase-locked white-light continuum pulses: toward a universal optical frequency-comb synthesizer,” Optics Letters 25, 1049 (2000).
- [21] D. B. Strasfeld, S.-H. Shim, and M. T. Zanni, “Controlling vibrational excitation with shaped mid-ir pulses,” Physical Review Letters 99, 038102 (2007).
- [22] C. W. Hillegas, J. X. Tull, D. Goswami, D. Strickland, and W. S. Warren, “Femtosecond laser pulse shaping by use of microsecond radio-frequency pulses.” Optics letters 19, 737–739 (1994).
- [23] B. J. Sussman, R. Lausten, and A. Stolow, “Focusing of light following a 4- pulse shaper: Considerations for quantum control,” Phys. Rev. A 77, 043416 (2008).
- [24] F. Frei, A. Galler, and T. Feurer, “Space-time coupling in femtosecond pulse shaping and its effects on coherent control,” The Journal of Chemical Physics 130, 034302 (2009).
- [25] M. A. Dugan, J. X. Tull, and W. S. Warren, “High-resolution acousto-optic shaping of unamplified and amplified femtosecond laser pulses,” Journal of the Optical Society of America B 14, 2348 (1997).
- [26] A. Monmayrant, S. Weber, and B. Chatel, “A newcomer’s guide to ultrashort pulse shaping and characterization,” Journal of Physics B: Atomic, Molecular and Optical Physics 43, 103001 (2010).
- [27] K. F. Lee, K. J. Kubarych, A. Bonvalet, and M. Joffre, “Characterization of mid-infrared femtosecond pulses [invited],” Journal of the Optical Society of America B 25, 54–62 (2008).
- [28] M. Tsubouchi and T. Momose, “Pulse shaping and its characterization of mid-infrared femtosecond pulses: Toward coherent control of molecules in the ground electronic states,” Optics Communications 282, 3757–3764 (2009).
- [29] D. Pestov, V. V. Lozovoy, and M. Dantus, “Multiple independent comb shaping (MICS): Phase-only generation of optical pulse sequences,” Optics Express 17, 14351–14361 (2009).