Segregation models for density-bidisperse granular flows
Abstract
Individual constituent balance equations are often used to derive expressions for species specific segregation velocities in flows of dense granular mixtures. We propose a semi-empirical expression for the interspecies momentum exchange in density bidisperse granular flows as an extension of ideas from kinetic theory and compare it to a previous viscous drag approach that is analogous to particles settling in a fluid. The proposed model expands the range of the granular kinetic theory from short-duration binary collisions to the multiple enduring contacts characteristic of dense shear flows and incorporates the effects of particle friction, concentration ratio, and local flow conditions. The segregation velocities derived from the momentum balance equation using both interspecies drag models match the downward and upward segregation velocities of heavy and light particles obtained from DEM simulations through the flowing layer depth for different density ratios and constituent concentrations in confined shear flows. Predictions of the kinetic theory inspired approach are additionally compared to results from free surface heap flow simulations, and, again, a close match is observed.
I Introduction
Dense granular materials, when sheared, tend to segregate by particle size, density, shape or friction coefficient, which can be problematic in many industries due to its impact on product quality and uniformity [1, 2, 3, 4, 5, 6, 7, 8]. As a result, the segregation behavior of sheared granular mixtures is of interest in a wide variety of fields from both fundamental and applied standpoints.
We focus on bidisperse granular mixtures of particles having the same size but different densities such that segregation is driven by a “buoyant force” mechanism [9, 10]. ln this paper, we propose a model based on the Kinetic Thoery of Granular Flow (KTGF) for the interspecies drag between heavy and light particles in density bidisperse granular flows and use the model to derive an expression for the segregation velocity of each species by considering the balance between the net buoyant force and the interspecies drag force. We then compare this new drag model to a previous viscous drag model [11, 12] that is analogous to the viscous drag force acting on a particle settling in a fluid.
To model the segregation process for both approaches, we assume that two different particle species can be treated as interpenetrable continua such that each constituent has its own partial pressure, consistent with previous studies [1, 3, 4]. The imbalance between a species’ partial pressure and its body force results in segregation of the two species. A linear relation between the drag force on a particle and its segregation velocity has been used in several previous gravity-driven segregation models for size or density segregation [1, 12, 11, 13, 14, 4, 15] based on either the similarity of kinetic sieving in granular segregation with fluid percolation through a porous material or an analogy to the drag force on a sphere settling in a fluid. The linear drag model has been combined with the constituent mass and momentum balances to derive a general multicomponent theory for segregation [16]. However, Weinhart et al. [17] demonstrated that the coefficient fitted from the linear drag model varies with time, indicating that a simple linear drag law fails to describe the segregation behavior. Recent DEM simulations also suggest that other factors, such as the local pressure [18, 19] and the species concentration ratio [20, 21], affect the segregation velocity, which again raises questions concerning the validity of a linear drag model.
As an alternative to the linear drag model, it is natural to consider the KTGF to model the momentum transfer between two segregating species. The KTGF provides a drag model connecting stresses and velocities in a granular mixture while accounting for complex particle interactions [22, 23, 24, 25, 26, 27, 28], thereby yielding a drag model that takes particle density and diameter into consideration at the particle level. However, there are two issues with using the KTGF approach to model dense flows. First, the stress generation mechanism in the KTGF is based on short-duration, binary collisions typical of dilute particle flows as opposed to multiple, enduring contacts typical of the dense granular flows considered here. Second, the KTGF approach does not include physics known to be critical to segregation in dense granular flows such as the dependence of segregation on the local pressure [18]. Nevertheless, a potential path toward a robust drag model for dense flows lies in modifying the KTGF drag model based on empirical results for density segregation in dense granular flows.
In this paper, we derive expressions for the segregation velocity in density bidisperse granular flow by combining the particle interspecies drag and the equilibrium momentum balance equation from mixture theory [1] using two different approaches to model the interspecies drag. One approach integrates particle-particle collisional force within the framework of KTGF, while the other adopts the form of a particle-fluid viscous force based on a modified Stokes law. Both models are described in Section II. The effects of the local inertial number, particle friction, and relative species concentration proposed in the KTGF drag model are tested separately by DEM simulations in Section III. In Section IV, the viscous drag coefficient is determined and the granular flow rheology for calculating the pseudo-viscosity of the mixture is discussed. In Section V, results of both segregation models are compared with DEM simulations for flows under more general conditions. Conclusions are given in Section VI.
II drag models and segregation velocity
For dense granular flows, the total solids volume fraction, , where represents the local volume fraction of each solid species (here for heavy particles and for light particles), is around 0.6. The local constituent concentration is and the solid density is , where is the particle material density. The gradient of the lithostatic pressure is
| (1) |
where is the vertical coordinate (assuming negative is the gravity direction) and is the acceleration due to gravity.
The partial pressure is determined by partitioning the lithostatic pressure induced by gravity among the two constituents such that . For particles that only differ in density, we assume that the proportion of the hydrostatic load carried by each species equals its concentration regardless of the density difference as proposed by Marks et al. [15] and Tunuguntla et al. [4]. The momentum balance for each species can be written as [4]
| (2) |
where is the dyadic product, is time, is the vector velocity, and is the interspecies drag vector. (Eq. (2) is similar to Eq. (2.5) in [4], noting that the intrinsic density in [4] is the bulk density of particles in a non-mixed state, which is equal to , and that is equivalent to used here.) Assuming that the vertical acceleration terms are negligible [29, 4], which is reasonable for the relatively slow segregation in a typical granular flowing layer, the momentum conservation equation in the -direction can be simplified using Eq. (1) to
| (3) |
Equation (3) is analogous to a simple force balance between the net buoyant force and the interspecies drag force .
II.1 KTGF based model
To determine constituent velocities from Eq. (3), must be expressed as a function of the velocity difference between the two species, and the KTGF offers a means to do this. Changes to the KTGF are needed, however, because it was developed to model rapid flow of dilute granular materials based on instantaneous binary collisions [30, 31]. This is not the case in the dense flow regime where enduring contacts dominate and many adjacent particles are part of contact force chains [32]. Correlations in motion and force due to the dense contact network reduce the collisional energy dissipation [33]. Substantial effort has been expended to extend the applicability of the KTGF to the dense regime, mainly by modifying the expression for the collisional energy dissipation rate to account for the effects of sustained contacts [34, 35, 36, 37, 38]. In fact, an augmented KTGF approach has been proposed for segregation problems, but it is limited to small size and density differences [39, 40]. In addition, several stand-alone drag models based on the KTGF have been proposed for dilute granular flows [22, 23, 24, 25, 26, 27, 28].
Here we follow an approach similar to one of these KTGF drag models [28] by assuming that the long-duration collisional drag in dense flows follows similar physics to the short-duration collisional drag in dilute flows, but with a much longer contact time. This can be represented by correction coefficients modifying the well-known solid-solid drag model proposed by Syamlal [23] that has been successfully used for fluidized bed simulations [41, 42, 43]. We choose the Syamlal drag model [23] over other models for two reasons. First, within the KTGF framework the interspecies drag at the continuum level is derived by integrating the momentum transfer between two particles over the velocity space. Thus, the dependence of drag on particle density has a physical basis at the particle level. Second, the drag model is derived by assuming all the particles of each type have identical velocities such that velocity fluctuations are not considered, making a closed-form expression for the drag easy to obtain.
The Syamlal expression for the local drag between two constituents and is
| (4) |
where is the radial distribution function for a collision between particle and [44], is the interparticle friction coefficient, and is the restitution coefficient. For density segregation, , and becomes a constant if we assume constant total solid volume fraction . The bulk velocity in the vertical direction of the combined constituents is based on volume conservation. The segregation, or percolation velocity , for species is defined as the velocity difference between the constituent velocity and the bulk velocity in the direction:
| (5) |
Using Eq. (5) in Eq. (4) for bidisperse granular mixtures of heavy and light particles having the same diameter , the interspecies drag in the segregation () direction is
| (6) |
The Syamlal model in Eq. (6) is derived by assuming that the particles of each type have identical velocities, so velocity fluctuations (i.e., the granular temperature) are not explicitly considered in the expression. We choose the Syamlal model over granular temperature dependent drag models knowing that in dense granular flows the Maxwellian velocity distribution is no longer valid and that the pressure-shear state, rather than the granular temperature, determines flow behavior [45]. However, Eq. (6) indicates that the two particle species would segregate even without the presence of shear, which, of course, does not occur. There are several ways to rationalize this. For example, Gera et al. [46] extended the Syamlal model to dense fluidized beds by adding a “hindrance effect” term related to friction and pressure, such that the momentum exchange has to exceed a threshold to drive the segregation. Here we take a heuristic approach based on the rheology [47, 48, 49], accounting for local flow conditions by introducing the inertial number , defined as
| (7) |
where is the local shear rate. A small value of (small and/or large ) corresponds to the quasistatic regime where granular flows behave more like deforming solids. Conversely, a large value of (large and/or small ) corresponds to the collisional regime where granular flows behave more like fluids. Based on simulation data that we describe in detail later in this paper, we propose a semi-empirical interspecies drag model of the form
| (8) |
for density-bidisperse granular flows with inertial number , corresponding to dense granular flow, and particle concentration, .
Among the four multiplicative terms in Eq. (8), the KTGF term is inherited from the Syamlal model in Eq. (6) and reflects the momentum transfer between two particles with different masses, taking into consideration density and diameter at the particle level, while the other three terms are semi-empirical modifications. replaces the first term in square brackets in Eq. (6) to account for enduring contacts in dense flows. In dense granular mixtures short-duration collisions are unlikely to play as important of a role as in the dilute flows upon which Eq. (6) for KTGF is based. As a result, we assume the empirical function is independent of . Previous studies show that the segregation velocity is proportional to the inertial number at constant [18, 19], so the inertial number appears as in Eq. (8) to account for the local flow conditions. Finally, the last term accounts for the nonlinear dependence of segregation on particle concentration (i.e., heavy particles among many light particles segregate faster than light particles among many heavy particles [21]), as it increases the drag with increasing . Detailed justifications for these three modifying terms are provided in Section III.
The ultimate goal of this paper is to develop an accurate model for the segregation velocities of the light and heavy particle species in density bidisperse granular flows. Such an expression can be readily derived by substituting the expression for the interspecies drag from Eq. (8) into the equilibrium momentum balance of Eq. (3). For light particles,
| (9) |
such that takes the form
| (10) |
noting that and that is the density ratio. For heavy particles, a similar approach yields
| (11) |
Note that Eqs. (10) and (11) apply to density-bidisperse granular flows with (dense flows), and particle concentrations, (as opposed to situations approaching a single intruder particle at concentrations outside this range). Equations (10) and (11) indicate that , which is similar to the relation observed in monodisperse systems with several heavy intruder particles [19]. Equations (10) and (11) also resemble the general form of the segregation velocity given by Fry et al. [18]
| (12) |
by making
| (13) |
These similarities suggest that the drag model proposed in Eq. (8) is reasonable and consistent with previous research.
II.2 Modified stokes law based model
For purposes of comparison, we also consider an alternative approach based on a viscous drag model [11, 12]. As an analogy to the viscous force acting on a particle settling in a fluid, Tripathi and Khakhar [12] propose a modified Stokes viscous drag force, , where is an empirically determined drag coefficient that depends on the solid volume fraction , and the pseudo-viscosity of the granular mixture is assumed to be the origin of the drag. This differs from the KTGF approach where the drag is assumed to be a direct consequence of particle-particle interactions. The conceptual difference leads to different expressions for the segregation velocity. Using the expression for the modified Stokes drag force, the interspecies drag can be expressed as
| (14) |
Substituting this expression into the momentum balance equation, Eq. (3), the segregation velocities take the form
| (15) |
and
| (16) |
Comparison of these two equations with Eqs. (10) and (11) for the modified KTGF drag model are enlightening. Both forms depend on gravity, and particle size, density, and concentration. While the KTGF form is slightly more complicated, it only requires one empirical function, . On the other hand, the challenge in applying the viscous segregation model is to empirically determine the drag coefficient and the pseudo-viscosity of the granular mixtures. Both forms depend on the inertial number , either directly for the KTGF model or indirectly through the determination of for the viscous drag model, as will be shown in Section IV.
III Confirming the modified KTGF drag model
In this section, we validate the interspecies drag model in Eq. (8) by performing DEM simulations under a variety of conditions. Direct measurement of from DEM simulations is difficult since both the segregation driving forces and the drag forces result from interparticle collisional forces; it is hard to distinguish them at the particle level. A better way to determine is to utilize momentum conservation at force equilibrium, Eq. (3), in which equals , a quantity that is easily measured locally in a granular flow. This is equivalent to validating the segregation model in Eqs. (10) and (11), noting that all of the variables in these equations except are known (i.e., , , ) or can be calculated from the simulation (i.e., , ). Hence, the problem comprises finding under a variety of local flow conditions, , and local concentration ratios, .
| mm | |
| , | |
| , , | |
| , , |
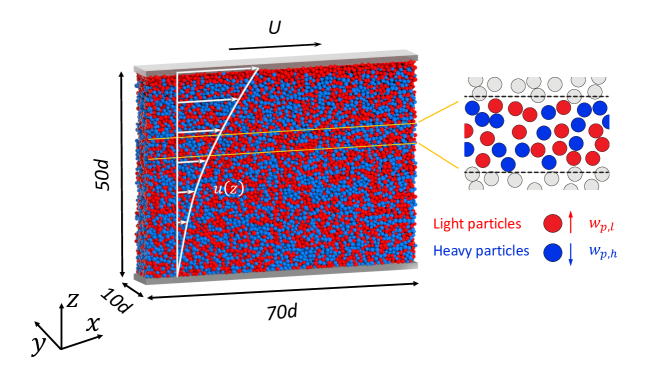
In the DEM simulations, a density bidisperse mixture of mm spherical particles with collision time s is sheared between top and bottom horizontal frictional planes in a domain with periodic boundary conditions in the streamwise () and spanwise () directions as shown in Fig. 1. The massive planar top wall moves horizontally with constant velocity and is free to move vertically. The position of the top wall is determined by the wall weight and contact forces from the top layer of particles. The distance between the top and bottom walls remains relatively constant (fluctuating by %) after an initial rapid dilation of the particles at flow onset. The domain extends about , or m, in the streamwise direction and , or m, in the spanwise direction. The weight of the top wall is based on the configuration of the system so that the overburden pressure applied by the wall to the system is for all cases in this study. There are 36864 particles in the system, differentiated by their densities ( for heavy particles and for light particles having density ratio ). The initial dense packing is achieved by placing particles in a grid pattern and letting them settle under gravity. The depth of the flow in the vertical -direction is approximately or m, and the volume fraction ratio () or, equivalently, the concentration ratio (), is approximately uniform across the domain. Varying or in the simulations causes the segregation velocity to vary. Over 200 simulations are performed over the wide range of flow conditions and particle properties listed in Table 1.
To achieve specific shear rate profiles, the corresponding velocity profile is imposed on the particles by applying a streamwise stabilizing force on each particle at every time step according to
| (17) |
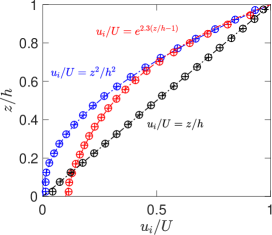
where is the imposed velocity profile, is the particle’s streamwise velocity, is the particle’s vertical position, and is a gain parameter. Details of the approach for the imposed velocity profile are provided elsewhere [18]. Three different profiles are considered: , , and . The first and second profiles correspond to those for uniform shear [18] and free surface flow down a heap [50], respectively. The third profile reflects a situation that sometimes occurs in shear flows where the shear rate vanishes at a rough bottom wall [51].
The simulation domain is divided into 20 horizontal layers for averaging purposes; each layer is in the -direction. The streamwise mean velocity profile for a density segregation simulation s after flow onset is shown in Fig. 2 for each of the three imposed velocity profiles. Due to the stabilizing force, the mean velocity matches the imposed profile, with a shear rate that is either uniform () or decreases through the depth of the particle bed , . The different symbols in Fig. 2 represent heavy and light particles, which have similar streamwise velocities. Slight deviations from the imposed velocity profiles occur within 5 of the top and bottom boundaries due to particle ordering adjacent to the flat walls [51, 52]. Here, we focus on the flow away from the walls to avoid artifacts related to these bounding walls. Companion simulations with bumpy walls (particles attached randomly on flat walls [53]) show little difference with simulations using flat walls for the particles between .
To characterize the evolution of the segregation, we measure the average center of mass height for each species relative to the mean height of all particles, which is calculated as
| (18) |
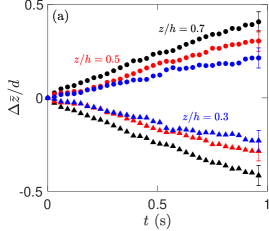
where and are the number of particles of species and the total number of particles in the horizontal averaging layer, respectively. Figure 3(a) shows the offset of the center of mass from its initial position for both heavy and light particles in horizontal layers at three vertical locations, , , and , for a uniform shear flow (). The offset is represented by the segregation distance , where is the initial center of mass. As the segregation progresses from shear onset, heavy particles move downward while light particles move upward. Due to solid volume conservation, . Since the shear rate is uniform across the domain for the simulation data shown in Fig. 3, the different segregation rates in the three different layers are a consequence of the overburden, or lithostatic, pressure [18]. A higher overburden pressure, which corresponds here to deeper bed depth (small ), reduces the segregation. Different segregation rates at different vertical positions are also found for the flows with the two nonlinear velocity profiles. However, in these cases, the depth-varying segregation rate results from a combination of shear rate and overburden pressure, since the shear rate now also varies with depth.
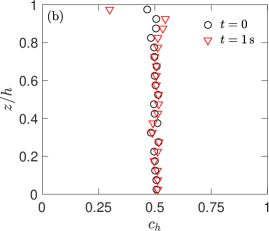
Confined granular mixtures under shear (Fig. 1) initially segregate rapidly with a nearly constant segregation velocity [18]. This is because for a short period after the flow is initiated, the local particle concentration has not yet changed enough to affect the segregation, resulting in a relatively high segregation velocity, while at later times the particles reach a steady segregated state where the segregation velocity is negligible. We focus on the initial rapidly-segregating transient. The initial segregation velocity is slow enough that the s sampling window used here falls within the interval of rapid segregation (s). The linear profile of the segregation distance versus time in Fig. 3(a) indicates the minimal effect of concentration change on the segregation velocity. Except for some segregation that occurs in the top layer of particles, the local concentration of heavy particles remains at its initial value of during the sampling window as shown in Fig. 3(b). Note that after 1 s of shear there are no strong gradients in the concentration, indicating that diffusive fluxes are unimportant, which is assumed in this approach. The segregation velocity of each constituent is calculated from the slope of data like that in Fig. 3(a) as , where is the offset at the end of the s sampling window and is the standard error in the calculation of , which is represented by the error bars at time slightly less than s in Fig. 3(a).
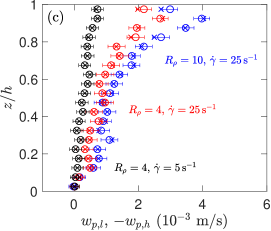
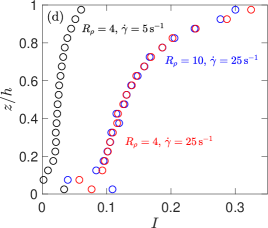
By considering many thin horizontal layers, the local segregation velocity profile can be measured, as shown in Fig. 3(c) for three sample cases of uniform shear flow. The segregation velocity increases with both increasing density ratio and shear rate. For each case, the segregation velocity decreases from top to bottom even though the shear rate and density ratio do not vary with depth. This decrease is proportional to the local inertial number in Fig. 3(d), which decreases with depth due to increasing pressure. This is a consequence of the overburden pressure increasing with depth, consistent with previous results [18]. Note that the sum of segregation velocities of heavy and light particles should equal zero due to volume conservation for . Figure 3(c) indeed demonstrates that the segregation velocities are nearly equal (and, of course, opposite). The slight difference between and is likely caused by a small amount of segregation during the initial filling process before the start of the shear flow. The error bars represent uncertainties in the measurement of the slope in Fig. 3(a).
From the momentum balance equation, Eq. (2), the convection term in the -direction , which can be estimated from the simulation results, is three orders of magnitude less than the net buoyant force (noting that the constituent velocity is equal to the segregation velocity since the bulk velocity in the -direction is zero). Likewise, the unsteady term is also negligible. This confirms that the system is in steady state during the sampling window and that the segregation velocity results from the balance between the net buoyant force and the interspecies drag as indicated by the simplified momentum expression in Eq. (3).
III.1 Inertial number dependence
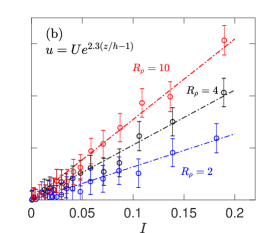
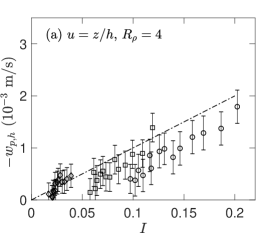
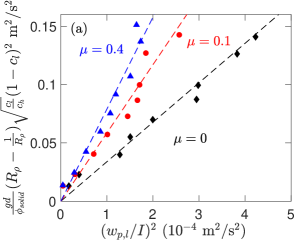
The inertial number dependence in the proposed drag model, Eq. (8), requires that the segregation velocity is linear in [Eqs. (10) and (11)]. Therefore, to verify the drag model, segregation velocities of light particles at different depths are plotted versus for different density ratios in Fig. 4 for flows with nonlinear streamwise velocity profiles. Similar results are also found for the segregation velocity of heavy particles since for flows with . The linear relation between and in Fig. 4 for varying and (expressed in terms of varying ) confirms the assumed dependence on and is consistent with results from previous studies [19, 18]. That is, the segregation velocity depends linearly on for each density ratio. The error bars are somewhat large, consistent with the difficulty in accurately measuring as indicated in Fig. 3. Nevertheless, a line can be fit through the data at each density ratio. Furthermore, the fitting lines are quite similar for both nonlinear velocity profiles.
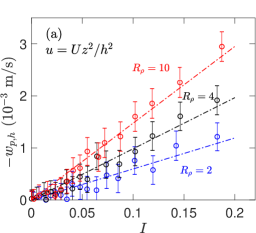
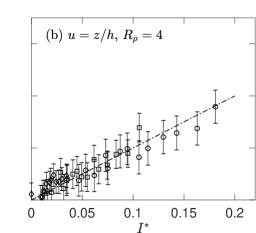
The segregation velocity data, however, do not show as clear a linear dependence on when plotted in the same way for uniform shear flows, as illustrated in Fig. 5(a). This is because unlike the other two nonlinear velocity profiles and , the local inertial number in a uniform shear flow is not zero or close to zero at the bottom wall. Instead, in the case of the linear velocity profile (), segregation is forced to cease at the fixed bottom wall because of the wall itself. To account for the cessation of density segregation at the bottom wall, we use a modified inertial number for uniform shear flows
| (19) |
where is the inertial number at which density segregation effectively ceases. According to Fig. 3(c), segregation ceases at . Therefore, we assume is the inertial number at that location, such that with . Modifying with in Eq. (19) forces to 0 at the bottom wall and brings the nonlocal effect of boundaries into the proposed model. An alternative approach for considering the boundary is to solve a second state variable related to the velocity fluctuations (i.e., “granular temperature” in KTGF [30] or “granular fluidity” in the nonlocal rheology of Ref. [54]) from an independent equation supplied with boundary conditions such that the boundary effect is considered implicitly in the drag. However, rheology models such as and KTGF have different coefficients for different particle properties, which requires simulation data to find those coefficients first. Furthermore, the boundary condition that determines the “heat flux” (i.e., particle velocity fluctuations induced by boundaries) into the system often involves fitting parameters [55], which makes it harder to generalize the model. As such, we do not consider velocity fluctuations here. Instead, the modified inertial number is used to correct the segregation near the boundary. As shown in Fig. 5(b), using instead of collapses the data for uniform shear flows such that the dependence of on is close to linear. Note that for the two nonlinear velocity profiles equals since . From here on, unless otherwise specified, we drop the asterisk on and use the corrected inertial number [Eq. (19)].
Figures 4 and 5(b) show that depends linearly on for varying shear profiles, shear rates, and density ratios. This confirms in Eq. (8) since equating the buoyant and drag forces gives in Eqs. (10) and (11). The linear relation between and is also consistent with previous results in free surface flows. Consider, for example, heap flows, in which the flowing layer thickness is about eight particle diameters [50, 56]. For such a thin layer with the local shear rate decreasing exponentially with depth, the overburden, or lithostatic, pressure can be treated as a uniform parameter, and the linear relation between and can be reduced to a linear relation between and [57, 58]. On the other hand, for a thick flowing layer with a uniform shear rate, the segregation velocity at different depths in the flowing layer is only affected by the overburden pressure so long as we consider segregation away from the upper and lower bounding walls. The effect of lithostatic pressure has to be included, resulting in a dependence of on [19, 18]. We further note that in our previous work [18], we proposed a form for in terms of a critical pressure that is equivalent to Eq. (19). However, it should be noted that at larger inertial numbers () [19], instantaneous binary collisions dominate over enduring contacts, resulting in a rheological change from dense to rapid dilute granular flow. In the latter regime, the linear relation between and is likely to be invalid.
III.2 Density ratio dependence
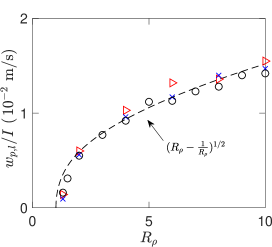
As shown in Fig. 4, increases with density ratio . Equations (10) and (11) indicate that is proportional to . To demonstrate this dependence, , calculated as the slope of the fitting lines in Figs. 4 and 5(b), is plotted versus in Fig. 6. The dashed curve in Fig. 6 represents the predictions of Eq. (10) with . (We characterize the dependence of on in Section III.D.) Indeed, is proportional to over the wide range of tested () in different flow profiles where varies due to changes in both and . Agreement between the curve and the data confirms the dependence of the drag model on particle densities and, equivalently, the functional dependence of on in Eqs. (10) and (11).
III.3 Concentration ratio dependence

A recent study [21] indicates that segregation in mixtures of heavy and light particles has an underlying asymmetry that depends on local particle concentration, similar to mixtures where particles differ in size [20, 21]. Specifically, a heavy particle among mostly light particles segregates faster than a light particle among mostly heavy particles. The last term , on the right hand side of the drag model in Eq. (8) accounts for the nonlinear dependence of segregation velocity on particle concentration. To confirm this term, we rewrite Eq. (10) using from Eq. (5), such that on the l.h.s and on the r.h.s cancel and the equation becomes
| (20) |
According to Eq. (20), , based on the proposed drag model of Eq. (8), should depend linearly on . To test this dependence, we keep particle densities and other simulation parameters constant, but vary from 0.01 to 0.99 for uniform shear flow. Figure 7 plots the normalized velocity difference between the two species , excluding because , and hence , is the same for all simulations included in the figure, as a function of for uniform shear flows. Note that is calculated using the slope of the fitting line through the data at different depths like that in Fig. 5(b). This avoids propagating the random error evident in these figures as the deviation of the data points for individual simulations from the fitting line. From Fig. 7 it is evident that depends linearly on for in the range 0.1 to 0.9. Outside of this range the number of particles of each species decreases to a point where the segregation velocity of the low concentration species is difficult to accurately determine. As a result, the uncertainty of is large for . Apart from the large uncertainty, the relative velocity and the concentration are uncorrelated for . This is because the segregation of the low concentration species is tending toward that in the single particle intruder case. For intruder particles, the concept of concentration loses its physical meaning, and the continuum assumption required by the approach in this paper is no longer valid. For example, the difference in the segregation velocities between a single intruder case and a ten-intruder case is minimal as long as the intruders are well separated by the bed particles. The ‘concentration’ increases by ten times, but the relative velocity remains constant. Nonetheless, Fig. 7 confirms the linear relation between and used in Eqs. (10) and (11), and thus the proposed form of the KTGF drag model [Eq. (8)] for flows with .
III.4 Friction and restitution dependence
The functional form for characterizing the dependence of the drag on particle friction in Eqs. (8), (10), and (11) is difficult to derive analytically due to the complex particle interactions typical of dense granular flows. Instead, DEM simulations under a variety of flow conditions are used to empirically determine and demonstrate that it is independent of the restitution coefficient .
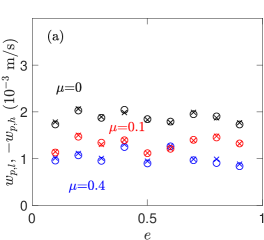
Consider first , which characterizes energy dissipation in short-duration collisions. We vary from 0.1 to 0.9 for uniform shear flow while keeping all other parameters unchanged, such that the damping coefficient of the linear-spring-dashpot collision model used in the DEM simulations varies accordingly. The segregation velocities for both light and heavy particles at for the case with and are plotted versus in Fig. 8(a) for three different friction coefficients . Although there is some scatter in the data, it is clear that is independent of , regardless of , as is reasonable to expect for dense granular mixtures in which short-duration collisions are unlikely to play as important of a role as in dilute flows.
For dense granular mixtures, enduring contacts dominate, and stresses are generated by long-duration sliding and rolling contacts. Unlike , the surface friction coefficient has significant impact on as shown in Fig. 8(b). The particle segregation velocity generally decreases as increases at different bed depths. Note that measured from DEM simulations is affected by not only but also the dependent initial packing, which adds more uncertainties resulting in scatter in the data. Nevertheless, the overall trend of decreasing segregation velocity with increasing friction remains evident.
In this context, is determined through a series of DEM simulations for uniform shear flow with different density ratios and friction coefficients . Since the dependence of drag on the other parameters has been verified, it is possible to determine the functional form for from Eq. (10),
| (21) |
In applying Eq. (21), the slope of the fitting line in Fig. 5(b) is again used for . We estimate by plotting versus over a range of density ratios for three values of in Fig. 9(a). The slope of the data at each gives the corresponding value of .
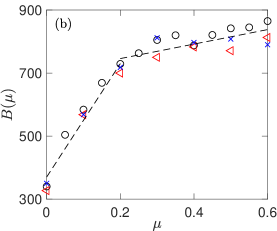
By measuring the slopes of different sets of data with , we empirically determine the dependence of on . The results are plotted in Fig. 9(b) for several values of for uniform shear flow. For bidisperse mixtures with a small friction coefficient (), is linearly proportional to . For larger values of (), the relation for remains linear but with a smaller slope. There is slightly more scatter for different values of at larger . Note that from Fig. 9(b) is consistent with the value used in Fig. 6 to calculate .
The interspecies drag is a combination of normal and tangential forces resulting from long-duration contacts. When , the tangential forces vanish. Thus, means that interspecies drag of smooth particle systems is entirely due to normal forces. Figure 9(b) shows that increases with . That is, increasing friction increases the interspecies drag, thereby reducing the segregation velocity. This is contrary to observations from size segregation, where part of the segregation driving force comes from interparticle friction, such that increasing friction coefficient promotes the segregation of large particles [59]. A possible explanation is that the friction force adds to the segregation driving force in size segregation, which overcomes the resultant increase in the interspecies drag. Alternately, for particles having different densities but the equal size, the friction force has no impact on the segregation driving force but adds to the drag.
Note that Eqs. (10) and (11) are not limited to specific velocity profiles even though is empirically determined using the data from uniform shear flows with . is merely a coefficient to account for the particle frictional properties. Thus, the KTGF drag model of Eqs. (10) and (11) is generally applicable to predict density segregation in any dense segregating granular flow.
IV Parameters for the viscous drag model
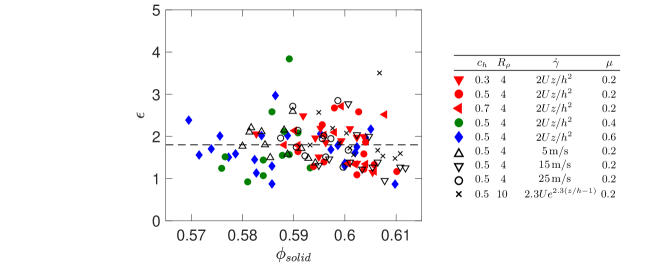
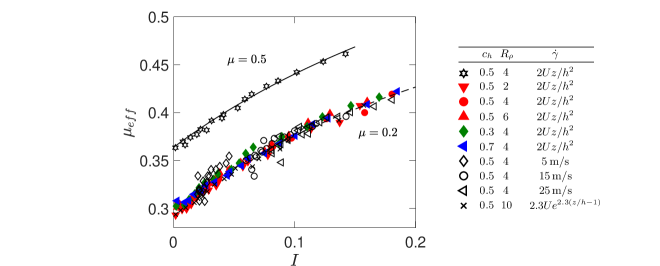
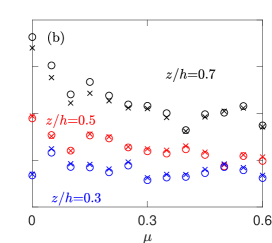
The viscous drag model of Eqs. (15) and (16) has previously been described in detail [12], so here we merely determine the coefficients and so we can apply the model for comparison to the KTGF segregation model. The shear stress and shear rate from the DEM simulations can be used to estimate the granular pseudo-viscosity (). This in turn allows the calculation of the empirical viscous drag coefficient from Eqs. (15) and (16). Figure 10 plots versus solid volume fraction for different flow configurations and friction coefficients, . is relatively constant, having a value of about 1.7 for . This value is somewhat lower than that from a previous study [12], in which decreases from 3.7 to 2.5 as increases from 0.51 to 0.58 for intruder particles in chute flow.
Equations (15) and (16) also require an expression for , which can be written in terms of the effective friction coefficient , such that
| (22) |
According to the rheology [61], is a function of the inertial number ;
| (23) |
The three rheological parameters , , and are material specific, and need to be independently determined for each value of interparticle . The effective friction coefficient estimated from DEM simulations () is plotted as a function of for and 0.5 in Fig. 11. For the set of data with , we validate our calculation by comparing the simulation results to the predictions of Eq. (23) with , , and from a previous study on chute flow [60]. For the other set of data with , Fig. 11 provides the relation between and for different combinations of density ratio , concentration , shear rate , and vertical location in the simulation. The data collapse on a curve with some outliers for uniform shear flows due to the discontinuity in local shear rate near the wall. for is somewhat smaller than that for , demonstrating the rheology dependence on interparticle friction . This is expected, noting that is related to the inclination angle for steady chute flows. Increasing results in a higher inclination angle and hence larger . For , Eq. (23) with , , and agrees well with the data in Fig. 11. We also observe that , , and have little influence on the relation, consistent with previous results for chute flows [60].
V Segregation velocity model predictions

With the empirical terms of both segregation velocity models determined, we now compare the predictions of Eqs. (10), (11) and Eqs. (15), (16) to the segregation velocities measured in the DEM simulations. For the KTGF drag model [Eqs. (10) and (11)], the global values for , , , , , and the empirically determined form of are used in the model along with local values of at each depth in the flow. The local inertial number is based on the overburden pressure, estimated as , such that can be expressed as a function of vertical position according to Eq. (7) (or, equivalently, Eq. (19) for uniform shear flows). For the segregation model based on the modified Stokes viscous drag force [Eqs. (15) and (16)], the global values for , , , , , and the empirical value for are used along with the local values for based on the rheology in Eq. (23) at each depth.
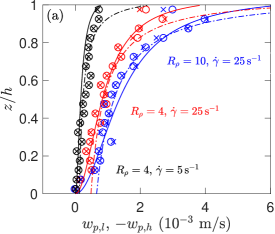
Figure 12(a) compares the particle segregation velocity profiles predicted by the KTGF drag model [Eqs. (10) and (11)] and the viscous drag model [Eqs. (15) and (16)] with those measured from DEM simulations of uniform shear flows in Fig. 3(c). Both models represent the simulation data reasonably well. Considering that the segregation velocities for and in the simulations are affected by the accumulation of segregating particles near the bounding walls. The KTGF drag model seems to handle wall influence slightly better than the viscous drag model, most likely because of the use of the modified inertial number that accounts for the nonlocal effect of the boundaries. Without further modification to the rheology, the viscous drag model does not include the nonlocal effect of the boundaries.
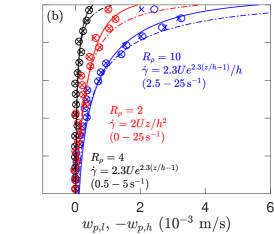
A more rigorous test of the model is to consider flows with varying shear profiles , , see Fig. 12(b). The close match between the KTGF segregation model prediction and the data demonstrates that Eqs. (10) and (11) are also effective for flow with non-uniform shear rates, even though in the model was derived from flow with uniform shear rate (). The segregation model based on the viscous drag is also successful except near the upper wall due again to nonlocal effects.
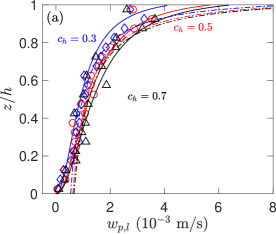
Figure 13 provides a similar comparison where the concentration ratio is varied while keeping other parameters constant for uniform shear. In this case, the segregation velocities for heavy and light particles differ from one another when the concentration of the two species is unequal, as expected [21]. Again, the estimated segregation velocities using both drag models match the DEM data reasonably well. The segregation model based on the viscous drag represents the near collapse of the data for in Fig. 13(a) slightly better than the KTGF segregation model. However, the KTGF segregation model works somewhat better for in Fig. 13(b), particularly near the upper and lower walls. Thus, we conclude that the new segregation model [Eqs. (10) and (11)] based on the interspecies drag term derived from analogy with KTGF can be used as an alternative to the viscous drag model to estimate the segregation velocities of both light and heavy species through the depth of the flowing layer under a variety of flow conditions.
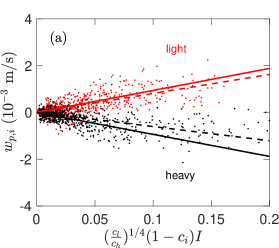
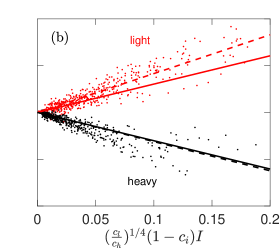
Unlike the confined shear flows discussed to this point, the shear rate and the concentration ratio of many free surface flows vary across the domain. To further test the KTGF drag model under these more general conditions, we consider quasi-2d bounded one-sided heap flow in which particles flow in a thin surface layer down a slope much like what occurs when filling a silo [62, 57, 63, 64]. Figure 14 shows segregation velocities from heap flow DEM simulations [56] versus , since, according to Eqs. (10) and (11), these two variables are linearly related when all other conditions are equal. The difference between these results and those presented up to this point is that these results correspond to a wide range of shear rates and concentrations, all occurring simultaneously in the flowing layer of the heap. The solid lines in Fig. 14 are based on the KTGF drag model, the data points represent DEM results [56], and the dashed lines represent least squares fits through the data points. Overall, the segregation velocities of both bounded heap flows are reasonably well predicted by the model. However, since segregation in heap flows mainly occurs in a thin layer at the free surface, the averages are more uncertain, so the data have substantial scatter, especially for the weakest segregation case with and mm in Fig. 14(a). The case with a small particle diameter mm but large density ratio has overall larger such that the DEM results match the theoretical predictions of Eqs. (10) and (11) better, as shown in Fig. 14(b). Note that we only include the heap flow data for to match the concentration range for flows in which our proposed KTGF drag model is valid.
As Fig. 14 shows, the segregation model based on the KTGF drag we propose in this paper works reasonably well not only for the confined shear flow between two planes from which it is developed, but also for free surface flow in a bounded heap. Previous results [56] suggest that the segregation velocity can be modeled as
| (24) |
for bounded heap flow with inlet concentration . Equations (10) and (11) have this form when , the segregation length scale, is
| (25) |
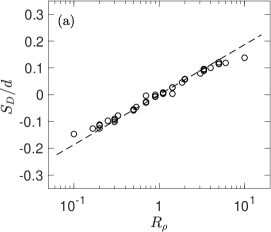
where is the bulk density. For free surface flows, the empirically determined segregation length scale is well approximated by [56]
| (26) |
where . The empirical relation and the underlying data are shown in Fig. 15(a).
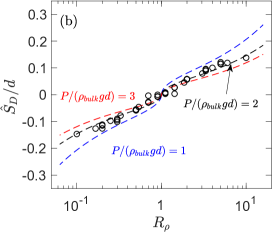
To compare and it is necessary to account for the pressure and particle concentration ratio, as well as other flow conditions. The comparison is made by first assuming , which is the feed concentration ratio in these simulations, such that is no longer concentration dependent. Furthermore, in heap flows, segregation occurs in a thin flowing layer, with a thickness of only a few particle diameters, in which the local shear rate decreases exponentially with depth while the scaled local pressure increases linearly from 1 at the surface to at the bottom of the flowing layer at depth , assuming constant . The mean shear rate of the flowing layer equals the local shear rate at a depth of due to the exponential streamwise velocity profile. This depth corresponds to approximately for [56]. By assuming the exponentially varying local shear rate is the dominant factor for the depth varying segregation velocity, we expect that the effective pressure is equivalent to the pressure at a depth of about such that . For comparison, and 3 are also considered.
The expression for from Eq. (25) for and three different pressures is compared to bounded heap flow results [56] in Fig. 15(b). The data match the model curve well for . Again, the results in Fig. 15(b) demonstrate the success of the KTGF drag model in replicating a wide range of results, even down to the slight curvature evident in the data matching that of the curve corresponding to Eq. (26).
As for the viscous drag model, it is possible to combine Eqs. (15), (16), (22), and (23) and rewrite the expression for the segregation velocity,
| (27) |
Noting that Eq. (27) has the same form as Eq. (24) [56], we can extract an expression for ,
| (28) |
However, the resulting expression indicates that depends on pressure directly (inversely) and also through dependence on , which depends on pressure. Assuming a simple linear dependence of pressure on depth () results in values of that are quite a bit larger than those that have been measured in DEM simulations of heap flow [56]. The reasons behind this are beyond the scope of this study, but may be related to applying parameters for the rheology extracted from the shear flow in Fig. 1 to the free surface flow occurring on a bounded heap. In any case, it is difficulty to further compare to previous heap simulation data, as was done for the KTGF drag model in Fig. 15.
VI conclusion
In this paper, we propose a semi-empirical predictive model, Eqs. (10) and (11), for the segregation velocities of light and heavy particle species in density bidisperse granular flows that is based on a new model for the interspecies drag in segregating dense flows, Eq. (8). The interspecies drag model assumes that the multiple long-duration particle interactions in dense granular flows reflect similar physics to short-duration binary particle interactions typical of dilute granular flows, which have been successfully modeled using the Kinetic Theory of Granular Flows (KTGF) [30, 31]. Of course, particle segregation depends on the pressure-shear state, which can be characterized by the inertial number . In particular, is inversely proportional to the square root of pressure, which can significantly reduce the segregation velocity [18]. In addition, the segregation depends non-linearly on the local particle concentration: heavy particles among many light particles segregate more quickly than light particles among many heavy particles [21]. Finally, particles in dense granular flows experience enduring contacts characterized by interparticle friction, which is in contrast to dilute granular flows where particle contacts are short and dominated by the elastic properties of the particles. Hence, the restitution coefficient has little influence on segregation in the dense flows considered here.
One advantage of the proposed KTGF drag model for dense granular flows [Eq. (8)] is that it links interspecies drag to segregation velocity and includes the effects of local flow conditions, , local concentration ratio, , and particle properties including density, size, and surface friction, . The segregation velocities derived from combining the interspecies drag model with the equilibrium momentum balance equation match the segregation velocities determined from DEM simulations in both confined shear and free surface heap flows as well as the modified viscous drag force model proposed by Tripathi and Khakhar [12], which is analogous to the viscous force acting on a particle settling in a fluid. Either approach allows calculation of segregation velocities through the depth of the flowing layer for different density ratios and relative constituent concentrations.
Despite these advances, the KTGF drag model proposed here is not without drawbacks. The segregation velocities predicted from Eqs. (10) and (11) for the KTGF drag model as well as those predicted from Eqs. (15) and (16) for the viscous drag model, while showing the right trends, are only reasonable estimates, as is evident from the scatter in the DEM simulation data from the model predictions in Figs. 12-14. This is likely a result of the many variables in the problem, as well as the stochastic nature of the forces on individual particles that drive the segregation and the concurrent collisional diffusion, which is not taken into account in either approach. Furthermore, both approaches require empirical inputs. The KTGF drag model requires an empirical relation, , that reflects dependence on interparticle friction; the viscous drag approach requires an empirical value for the coefficient of drag, , as well as appropriate values for the rheology, which, in turn, depend on the interparticle friction. Thus, in either case, the underlying challenge lies in relating interparticle friction to the rheology of the flow.
Nevertheless, the results in Fig. 15 demonstrate a remarkable correspondence between the segregation velocity model and the simulation data for the KTGF drag model, particularly since the data are for a different flow than that from which the model was derived. More research is needed under even more widely varying conditions to refine both models, particularly with respect to the influence of interparticle friction. Furthermore, both models are limited to density bidisperse granular materials. A more challenging problem is to connect the interspecies drag to the segregation velocity for size-bidisperse particles, or, even more difficult, particles that differ in both size and density.
References
- Gray and Thornton [2005] J. M. N. T. Gray and A. R. Thornton, A theory for particle size segregation in shallow granular free-surface flows, Proc. R. Soc. A 461, 1447 (2005).
- Meier et al. [2007] S. W. Meier, R. M. Lueptow, and J. M. Ottino, A dynamical systems approach to mixing and segregation of granular materials in tumblers, Adv. Phys. 56, 757 (2007).
- Fan and Hill [2011] Y. Fan and K. M. Hill, Theory for shear-induced segregation of dense granular mixtures, New J. Phys. 13 (2011).
- Tunuguntla et al. [2014] D. R. Tunuguntla, O. Bokhove, and A. R. Thornton, A mixture theory for size and density segregation in shallow granular free-surface flows, J. Fluid Mech. 749, 99 (2014).
- Xiao et al. [2017] H. Xiao, D. McDonald, Y. Fan, P. B. Umbanhowar, J. M. Ottino, and R. M. Lueptow, Controlling granular segregation using modulated flow, Powder Technol. 312, 360 (2017).
- Zhao et al. [2018] Y. Zhao, H. Xiao, P. B. Umbanhowar, and R. M. Lueptow, Simulation and modeling of segregating rods in quasi-2d bounded heap flow, AIChE J. 64, 1550 (2018).
- Xiao et al. [2019] H. Xiao, Y. Fan, K. V. Jacob, P. B. Umbanhowar, M. Kodam, J. F. Koch, and R. M. Lueptow, Continuum modeling of granular segregation during hopper discharge, Chem. Eng. Sci. 193, 188 (2019).
- Umbanhowar et al. [2019] P. B. Umbanhowar, R. M. Lueptow, and J. M. Ottino, Modeling segregation in granular flows, Annu. Rev. Chem. Biomol. Eng. 10 (2019).
- Khakhar et al. [1997] D. V. Khakhar, J. J. McCarthy, and J. M. Ottino, Radial segregation of granular mixtures in rotating cylinders, Phys. Fluids 9, 3600 (1997).
- Khakhar et al. [1999] D. V. Khakhar, J. J. McCarthy, and J. M. Ottino, Mixing and segregation of granular materials in chute flows, Chaos 9, 594 (1999).
- Tripathi and Khakhar [2011a] A. Tripathi and D. V. Khakhar, Numerical simulation of the sedimentation of a sphere in a sheared granular fluid: a granular Stokes experiment, Phys. Rev. Lett. 107, 108001 (2011a).
- Tripathi and Khakhar [2013] A. Tripathi and D. V. Khakhar, Density difference-driven segregation in a dense granular flow, J. Fluid Mech. 717, 643 (2013).
- Gajjar and Gray [2014] P. Gajjar and J. M. N. T. Gray, Asymmetric flux models for particle-size segregation in granular avalanches, J. Fluid Mech. 757, 297 (2014).
- Gray and Ancey [2015] J. M. N. T. Gray and C. Ancey, Particle-size and-density segregation in granular free-surface flows, J. Fluid Mech. 779, 622 (2015).
- Marks et al. [2012] B. Marks, P. Rognon, and I. Einav, Grainsize dynamics of polydisperse granular segregation down inclined planes, J. Fluid Mech. 690, 499 (2012).
- Gray [2018] J. M. N. T. Gray, Particle segregation in dense granular flows, Annu. Rev. Fluid Mech. 50, 407 (2018).
- Weinhart et al. [2013] T. Weinhart, S. Luding, and A. R. Thornton, From discrete particles to continuum fields in mixtures, AIP Conf. Proc. 1542, 1202 (2013).
- Fry et al. [2018] A. M. Fry, P. B. Umbanhowar, J. M. Ottino, and R. M. Lueptow, Effect of pressure on segregation in granular shear flows, Phys. Rev. E 97, 062906 (2018).
- Liu and McCarthy [2017] S. Liu and J. J. McCarthy, Transport analogy for segregation and granular rheology, Phys. Rev. E 96, 020901 (2017).
- van der Vaart et al. [2015] K. van der Vaart, P. Gajjar, G. Epely-Chauvin, N. Andreini, J. M. N. T. Gray, and C. Ancey, Underlying asymmetry within particle size segregation, Phys. Rev. Lett. 114, 238001 (2015).
- Jones et al. [2018] R. P. Jones, A. B. Isner, H. Xiao, J. M. Ottino, P. B. Umbanhowar, and R. M. Lueptow, Asymmetric concentration dependence of segregation fluxes in granular flows, Phys. Rev. Fluids 3, 094304 (2018).
- Gidaspow et al. [1986] D. Gidaspow, M. Syamlal, and Y. Seo, Hydrodynamics of fluidization of single and binary size particles: supercomputer modeling, Fluidization V , 1 (1986).
- Syamlal [1987] M. Syamlal, The particle-particle drag term in a multiparticle model of fluidization, Tech. Rep. (DOE/MC/21353-2373:Work perfomed under contract No: DE-AC21-85MC21353, 1987).
- Huilin and Gidaspow [2003] L. Huilin and D. Gidaspow, Hydrodynamics of binary fluidization in a riser: CFD simulation using two granular temperatures, Chem. Eng. Sci. 58, 3777 (2003).
- Huilin et al. [2007] L. Huilin, Z. Yunhua, J. Ding, D. Gidaspow, and L. Wei, Investigation of mixing/segregation of mixture particles in gas–solid fluidized beds, Chem. Eng. Sci. 62, 301 (2007).
- Iddir et al. [2005] H. Iddir, H. Arastoopour, and C. M. Hrenya, Analysis of binary and ternary granular mixtures behavior using the kinetic theory approach, Powder Technol. 151, 117 (2005).
- Iddir and Arastoopour [2005] H. Iddir and H. Arastoopour, Modeling of multitype particle flow using the kinetic theory approach, AIChE J. 51, 1620 (2005).
- Chao et al. [2012] Z. Chao, Y. Wang, J. P. Jakobsen, M. Fernandino, and H. A. Jakobsen, Investigation of the particle–particle drag in a dense binary fluidized bed, Powder Technol. 224, 311 (2012).
- Gray and Chugunov [2006] J. M. N. T. Gray and V. Chugunov, Particle-size segregation and diffusive remixing in shallow granular avalanches, J. Fluid Mech. 569, 365 (2006).
- Jenkins and Savage [1983] J. T. Jenkins and S. B. Savage, A theory for the rapid flow of identical, smooth, nearly elastic, spherical particles, J. Fluid Mech. 130, 187 (1983).
- Lun et al. [1984] C. K. K. Lun, S. B. Savage, D. J. Jeffrey, and N. Chepurniy, Kinetic theories for granular flow: inelastic particles in Couette flow and slightly inelastic particles in a general flowfield, J. Fluid Mech. 140, 223 (1984).
- Liu et al. [1995] C. H. Liu, S. R. Nagel, D. A. Schecter, S. N. Coppersmith, S. Majumdar, O. Narayan, and T. A. Witten, Force fluctuations in bead packs, Science 269, 513 (1995).
- Jenkins [2006] J. T. Jenkins, Dense shearing flows of inelastic disks, Phys. Fluids 18, 103307 (2006).
- Jenkins [2007] J. T. Jenkins, Dense inclined flows of inelastic spheres, Granul. Matter 10, 47 (2007).
- Jenkins and Berzi [2010] J. T. Jenkins and D. Berzi, Dense inclined flows of inelastic spheres: tests of an extension of kinetic theory, Granul. Matter 12, 151 (2010).
- Vescovi et al. [2014] D. Vescovi, D. Berzi, P. Richard, and N. Brodu, Plane shear flows of frictionless spheres: Kinetic theory and 3D soft-sphere discrete element method simulations, Phys. Fluids 26, 053305 (2014).
- Duan et al. [2017] Y. Duan, Z.-G. Feng, E. E. Michaelides, and S. Mao, Modified kinetic theory applied to the shear flows of granular materials, Phys. Fluids 29, 043302 (2017).
- Duan and Feng [2019] Y. Duan and Z.-G. Feng, A new kinetic theory model of granular flows that incorporates particle stiffness, Phys. Fluids 31, 013301 (2019).
- Larcher and Jenkins [2013] M. Larcher and J. T. Jenkins, Segregation and mixture profiles in dense, inclined flows of two types of spheres, Phys. Fluids 25, 113301 (2013).
- Larcher and Jenkins [2015] M. Larcher and J. T. Jenkins, The evolution of segregation in dense inclined flows of binary mixtures of spheres, J. Fluid Mech. 782, 405 (2015).
- Syamlal et al. [1993] M. Syamlal, W. Rogers, and T. J. O’Brien, MFIX documentation: Theory guide, National Energy Technology Laboratory, Department of Energy, Technical Note DOE/METC-95/1013 and NTIS/DE95000031 (1993).
- Owoyemi et al. [2007] O. Owoyemi, L. Mazzei, and P. Lettieri, CFD modeling of binary-fluidized suspensions and investigation of role of particle–particle drag on mixing and segregation, AIChE J. 53, 1924 (2007).
- Hernández-Jiménez et al. [2015] F. Hernández-Jiménez, L. García-Gutiérrez, A. Soria-Verdugo, and A. Acosta-Iborra, Fully coupled TFM-DEM simulations to study the motion of fuel particles in a fluidized bed, Chem. Eng. Sci. 134, 57 (2015).
- Lebowitz [1964] J. L. Lebowitz, Exact solution of generalized percus-yevick equation for a mixture of hard spheres, Phys. Rev. 133, A895 (1964).
- Pouliquen et al. [2006] O. Pouliquen, C. Cassar, P. Jop, Y. Forterre, and M. Nicolas, Flow of dense granular material: towards simple constitutive laws, J. Stat. Mech. 2006, P07020 (2006).
- Gera et al. [2004] D. Gera, M. Syamlal, and T. J. O’Brien, Hydrodynamics of particle segregation in fluidized beds, Int. J. Multiph. Flow 30, 419 (2004).
- GDR MiDi [2004] GDR MiDi, On dense granular flows, Eur. Phys. J. E. 14, 341 (2004).
- da Cruz et al. [2005] F. da Cruz, S. Emam, M. Prochnow, J.-N. Roux, and F. Chevoir, Rheophysics of dense granular materials: Discrete simulation of plane shear flows, Phys. Rev. E 72, 021309 (2005).
- Jop et al. [2006] P. Jop, Y. Forterre, and O. Pouliquen, A constitutive law for dense granular flows, Nature 441, 727 (2006).
- Fan et al. [2013] Y. Fan, P. B. Umbanhowar, J. M. Ottino, and R. M. Lueptow, Kinematics of monodisperse and bidisperse granular flows in quasi-two-dimensional bounded heaps, Proc. R. Soc. A 469, 20130235 (2013).
- Jing et al. [2017a] L. Jing, C. Y. Kwok, Y. F. Leung, and Y. D. Sobral, Effect of geometric base roughness on size segregation, EPJ Web Conf. 140, 03056 (2017a).
- van der Vaart et al. [2018] K. van der Vaart, A. R. Thornton, C. G. Johnson, T. Weinhart, L. Jing, P. Gajjar, J. M. N. T. Gray, and C. Ancey, Breaking size-segregation waves and mobility feedback in dense granular avalanches, Granul. Matter 20, 46 (2018).
- Jing et al. [2016] L. Jing, C. Y. Kwok, Y. F. Leung, and Y. D. Sobral, Characterization of base roughness for granular chute flows, Phys. Rev. E 94, 052901 (2016).
- Kamrin and Koval [2012] K. Kamrin and G. Koval, Nonlocal constitutive relation for steady granular flow, Phys. Rev. Lett. 108, 178301 (2012).
- Johnson and Jackson [1987] P. C. Johnson and R. Jackson, Frictional–collisional constitutive relations for granular materials, with application to plane shearing, J. Fluid Mech. 176, 67 (1987).
- Xiao et al. [2016] H. Xiao, P. B. Umbanhowar, J. M. Ottino, and R. M. Lueptow, Modelling density segregation in flowing bidisperse granular materials, Proc. R. Soc. A 472, 20150856 (2016).
- Fan et al. [2014] Y. Fan, C. P. Schlick, P. B. Umbanhowar, J. M. Ottino, and R. M. Lueptow, Modelling size segregation of granular materials: the roles of segregation, advection and diffusion, J. Fluid Mech. 741, 252 (2014).
- Schlick et al. [2015] C. P. Schlick, Y. Fan, A. B. Isner, P. B. Umbanhowar, J. M. Ottino, and R. M. Lueptow, Modeling segregation of bidisperse granular materials using physical control parameters in the quasi-2d bounded heap, AIChE J. 61, 1524 (2015).
- Jing et al. [2017b] L. Jing, C. Y. Kwok, and Y. F. Leung, Micromechanical origin of particle size segregation, Phys. Rev. Lett. 118, 118001 (2017b).
- Tripathi and Khakhar [2011b] A. Tripathi and D. Khakhar, Rheology of binary granular mixtures in the dense flow regime, Phys. Fluids 23, 113302 (2011b).
- Jop et al. [2005] P. Jop, Y. Forterre, and O. Pouliquen, Crucial role of sidewalls in granular surface flows: consequences for the rheology, J. Fluid Mech. 541, 167 (2005).
- Fan et al. [2012] Y. Fan, Y. Boukerkour, T. Blanc, P. B. Umbanhowar, J. M. Ottino, and R. M. Lueptow, Stratification, segregation, and mixing of granular materials in quasi-two-dimensional bounded heaps, Phys. Rev. E 86, 051305 (2012).
- Deng et al. [2018] Z. Deng, P. B. Umbanhowar, J. M. Ottino, and R. M. Lueptow, Continuum modelling of segregating tridisperse granular chute flow, Proc. R. Soc. A 474, 20170384 (2018).
- Deng et al. [2019] Z. Deng, P. B. Umbanhowar, J. M. Ottino, and R. M. Lueptow, Modeling segregation of polydisperse granular materials in developing and transient free-surface flows, AIChE J. 65, 882 (2019).