Evidence for supercritical behavior
of high-pressure liquid hydrogen
Abstract
Hydrogen exhibits unusual behaviors at megabar pressures, with consequences for planetary science, condensed matter physics and materials science. Experiments at such extreme conditions are challenging, often resulting in hard-to-interpret and controversial observations. We present a theoretical study of the phase diagram of dense hydrogen, using machine learning to overcome time and length scale limitations while describing accurately interatomic forces. We reproduce the re-entrant melting behavior and the polymorphism of the solid phase. In simulations based on the machine learning potential we find evidence for continuous metallization in the liquid, as a first-order liquid-liquid transition is pre-empted by freezing. This suggests a smooth transition between insulating and metallic layers in giant gas planets, and reconciles existing discrepancies between experiments as a manifestation of supercritical behavior.
pacs:
Valid PACS appear hereHydrogen, the most abundant and simplest element in the universe, develops a remarkably complex behavior upon compression McMahon et al. (2012). Almost a century ago, Wigner predicted the dissociation and metallization of solid hydrogen at megabar pressures Wigner and Huntington (1935). Since then, unrelenting effort has been made to rationalize the many unusual properties of dense hydrogen, including a rich and poorly understood solid polymorphism McMahon et al. (2012); Howie et al. (2012); Zha et al. (2013); Dalladay-Simpson et al. (2016), anomalous melting line Bonev et al. (2004), and the possible transition to a superconducting state Ashcroft (1968).
Liquid hydrogen constitutes the interior of giant planets and brown dwarf stars, and it is commonly assumed to undergo a first-order phase transition between an insulating molecular fluid and a conducting metallic fluidMcMahon et al. (2012). Understanding the nature of this liquid-liquid transition (LLT) is crucial to accurately model the structure and evolution of giant planets including Jupiter and SaturnGuillot (2005). Standard planetary models assume a sharp LLT accompanied by a discontinuity in density, and as a result feature a clear-cut transition between an inner metallic mantle and an outer insulating mantleHubbard and Militzer (2016).
Probing the nature of the LLT in laboratories faces the challenges of creating a controllable high pressure and temperature environment, and of confining hydrogen whilst making measurements. As such, experimental studies have not yet reached a consensus on whether the LLT is first-order or smoothCelliers et al. (2018), and there are considerable discrepancies up to 100 GPa (see Figure 1) on the location of the LLT between experimentsKnudson et al. (2015); Ohta et al. (2015); McWilliams et al. (2016); Zaghoo et al. (2016); Zaghoo and Silvera (2017); Celliers et al. (2018).
Given the experimental difficulties, computer simulations have played a fundamental role in characterizing the phase diagram of hydrogenScandolo (2003); Morales et al. (2010); Lorenzen et al. (2010); Bonev et al. (2004), by describing atomic interactions based on a quantum-mechanical treatment of electrons. Different levels of electronic structure theory have been employed, ranging from accurate Quantum Monte Carlo (QMC) methodsDelaney et al. (2006); Morales et al. (2010); Mazzola et al. (2018), to the popular Density Functional Theory (DFT) approximationScandolo (2003); Vorberger et al. (2007); Morales et al. (2010); Lorenzen et al. (2010). Early simulations gave contradictory results Scandolo (2003); Delaney et al. (2006); Vorberger et al. (2007), but most recent calculations identify small density discontinuities at below 1500 K Morales et al. (2010); Lorenzen et al. (2010); Mazzola et al. (2018), which were interpreted as signatures of a first-order LLT.
Even at the lower computational cost end of electronic structure methods, DFT studies of dense liquid hydrogen are limited to a size of few hundreds atoms and a time scale of a few picoseconds (ps)Scandolo (2003); Vorberger et al. (2007); Morales et al. (2010); Lorenzen et al. (2010). Given the subtlety of the problem, it would be desirable to overcome these size and timescale limitations. To this end, we use an artificial neural network architecture to construct a machine-learning potential (MLP) (see details and benchmarks in the Supplemental Information), based on the Behler-Parrinello framework Behler and Parrinello (2007). We have tested extensively the MLP against direct ab initio simulations on small systems, observing excellent agreement. The combination of the first-principles accuracy and the low cost of the MLP allows us to investigate hydrogen phase transitions for temperatures () between 100 and 4000 K, and pressures () between 25 and 400 GPa, with converged simulation size and time. If performed using DFT, the total computational cost of this study would require several millions of CPU years, exceeding the capacity of the world’s fastest supercomputers.
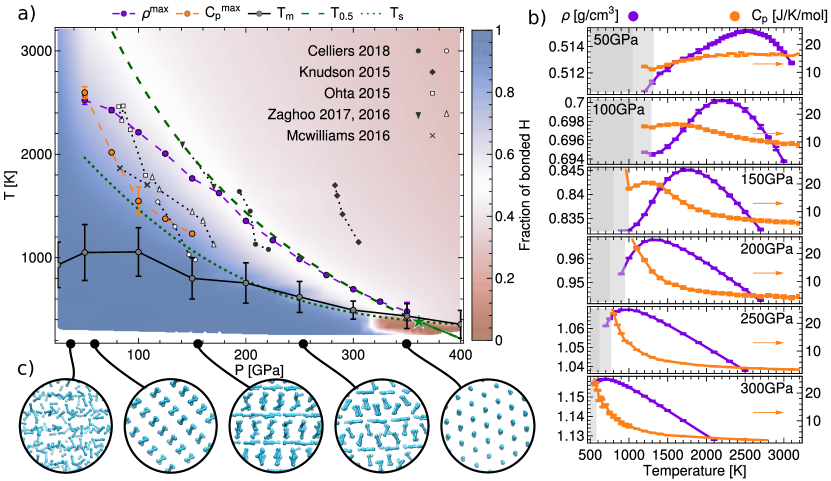
Panel (b): The purple curves show the density isobar, and the orange curves show the molar heat capacity () at different pressures. The shaded regions indicate the conditions under which solid phases are stable, corresponding to the solid-liquid coexistence line shown in panel (a).
Panel (c): Crystalline structures of solid hydrogen, obtained at the end of the quenching simulations at different pressures (from left to right: 25, 50, 150, 250, 350 GPa).
Solid-liquid transition
Computing the hydrogen melting line is nontrivial because solid hydrogen exhibits polymorphism and only a few of the crystal structures and phase boundaries have been characterized conclusively McMahon et al. (2012); Howie et al. (2012); Zha et al. (2013); Dalladay-Simpson et al. (2016). Given that estimating the melting point using most free energy methods requires a prior knowledge of the stable crystal structure under each pressure, we simulated the cooling of 1728-atom hydrogen systems from well-equilibrated liquid to frozen structures, and subsequently re-heated them until melting, for a total of 1.6 ns of simulation time at each pressure. Due to hysteresis, the freezing and melting temperatures bracket the melting point , that can be estimated as the mean of the two values, as indicated by the black curve in Fig. 1a. The shape of the melting line, with peaking around 100 GPa and 1000 K, followed by a decline at higher P, are consistent with recent experimental measurements Zha et al. (2017).
The solid configurations obtained at different pressures (Fig. 1c) follow a trend consistent with both experimental evidence McMahon et al. (2012); Howie et al. (2012); Zha et al. (2013); Dalladay-Simpson et al. (2016) and previous first principles simulations Monserrat et al. (2016), going from close-packed structure with freely rotating molecules at low to aligned and layered structures at higher pressure. At GPa we observe the transition into a novel atomic phase, with molecules dissociating to form long wires arranged in a hexagonal lattice. We provide the structures of the solid phases in the Supplemental Information, which can be compared with the crystal structure predictions by random search using small simulation cells Needs and Pickard (2016), and be used to characterize the phase diagram of dense solid hydrogen.
Liquid-liquid transition
After having located the melting line for the MLP, we performed equilibrium molecular dynamics simulations across a broad range of and in the liquid region, with simulation time and system size sufficient to achieve convergence. We computed the fraction of molecular hydrogen by counting the H–H bonds using a smooth cutoff function that decays from one to zero between 0.8 Å and 1.1 Å. As evident from Fig. 1a, the molecular fraction varies smoothly across the liquid phase diagram, with the transition region becoming narrower at low and high . Other observables, including density () and heat capacity (Fig. 1c), the pair correlation function and the electronic density of states (see Supplemental Information), all similarly show no sign of discontinuities. Both and exhibit an anomalous behavior, displaying smooth peaks that become sharper at higher pressures (Fig. 1b) The loci of these maxima, as well as the atomic-molecular transition region, converge towards the melting line around 350 GPa.
The results above rule out a first-order LLT for the hydrogen system described by the MLP. However, as discussed in the literature Lorenzen et al. (2010); Morales et al. (2010), the location of the boundary of the LLT is sensitive to the details of the underlying electronic structure methods, which could also affect the melting line and the solid phase diagram.
Polyamorphic solution model
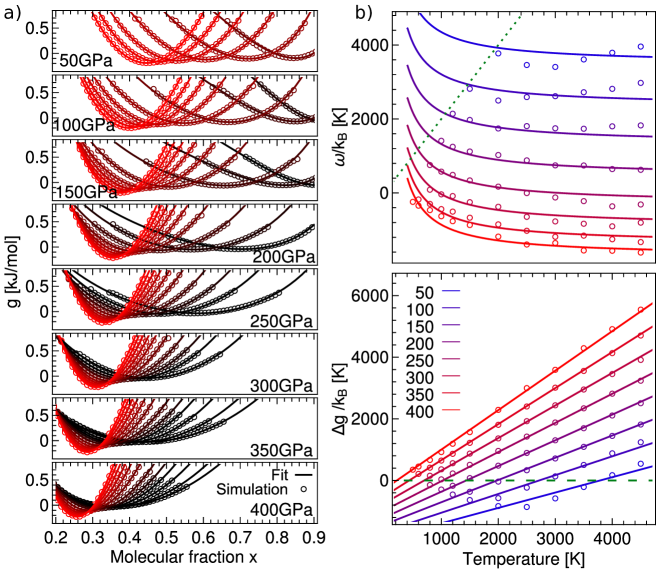
To provide a more robust analysis of the nature of the LLT, and to propose a thermodynamic model that can be used to interpret experimental observations, we map our simulations on a polyamorphic solution model Anisimov et al. (2018) that describes a mixture of two inter-convertible liquid states. At each thermodynamic state point, the regular-solution molar free energy as a function of the molecular fraction reads
| (1) |
The term is the chemical potential difference between the atomic and molecular phases, and is an enthalpic term that accounts for the non-ideality of mixing. In order to obtain a free-energy profile from simulations, that can be compared to Eq. (1), we performed a separate set of calculations in which we enhanced the spontaneous fluctuations of the order parameter using metadynamics Laio and Parrinello (2002) (see Supplemental Information).
As shown in Fig. 2a, the model matches perfectly the obtained from simulations, that exhibits a single minimum, indicative of perfect mixing of the two liquids and of the absence of a LLT throughout the range of temperatures and pressures that we explored. In addition, the fitting parameters are well described by the simple empirical models , and . As shown in Fig. 2b, the global model matches well the values obtained by independent fits at each state point. These analytic expressions make it possible to estimate the coexistence line (i.e. the temperature at which atomic and molecular fluids would be equally stable, determined implicitly by ), as well as the phase separation line (i.e. the temperature below which the two fluids start de-mixing, determined by ). There are several considerations one should keep in mind when discussing this model. (1) There are different ways to define the molecular fraction using a local order parameter, however, the curves and are rather insensitive to such definition. (2) Given that the two phases can interconvert, being at is not sufficient to observe two-phase behavior - it is also necessary that the atomic and molecular phases are equally stable. (3) The model describes bulk thermodynamics, and as such the estimation of from biased atomistic simulations is only possible for , since an artificially-stabilized two-phase configuration would also involve a free-energy penalty associated with the phase boundary. The two temperatures are plotted on Fig. 1a as dashed and dotted green lines and cross at the critical point marked by a green star for the fluid-fluid phase transition, that is located at 350 GPa and 380 K, which coincides approximately with the melting line, and with the point at which atomic solid phases appear. At the system exhibits supercritical behavior, without phase separation and with anomalies in the thermodynamic properties of the mixture following different Widom lines that emanate from the critical point. At the system exhibits a first-order phase transition, and determines the coexistence line between the two phases. Since in this system , no LLT can be observed, even though the anomalous behaviors induced by a hidden critical point can be observed throughout the liquid phase diagram, much like the case of water Soper and Ricci (2000).
Our observation of a supercritical fluid above the melting line contradicts several recent DFT and QMC simulationsLorenzen et al. (2010); Morales et al. (2010); Mazzola et al. (2018), which reported a sharp LLT suggested by small discontinuities in density up to around 1000-1500 K. We discuss in detail the probable origin of this discrepancy in the Supplemental Information, which we traced to finite-size effects resulting in the formation of a highly-defective solid phase. By following the simulation protocol of previous studiesLorenzen et al. (2010), we could reproduce the density discontinuities employing either DFT or the MLP at . This transition is associated with a sharp drop of diffusivity, and with the appearance of ordered planes of molecules. Repeating simulations in the isothermal-isobaric ensemble leads to effectively zero diffusivity, and we observe the appearance of a close-packed solid phase similar to the configurations obtained by slow quenching using the MLP, up to K.
We note that, in general, a change in electronic structure method, or the inclusion of nuclear quantum effects, or the residual difference between MLP and the underlying first principle potential energy surface, can change quantitatively the predicted phase diagram. In fact, the use of MLP should facilitate greatly the comparison between different electronic structure methods, possibly also allowing to obtain thermodynamic observables free of residual inaccuracies introduced by ML schemes using free-energy perturbations Cheng et al. (2019). Nevertheless, the polyamorphic solution model brings robustness to the qualitative prediction of supercritical behavior: at Gpa, is well above , meaning that the atomic fluid is unstable at conditions where phase separation can happen. At about Gpa, is negative at , suggesting that mixing is enthalpically - and not only entropically - favorable.
The predicted supercritical behaviors of fluid hydrogen could explain the discrepancies between different experiments. While all observables should undergo an abrupt change when crossing the coexistence line in the case of a first-order LLT, the supercriticality of fluid hydrogen means that the boundary of LL transition is blurry and its location depends on the specific criterion used to define it. In other words, different observables may exhibit an anomalous behavior that follows different Widom lines, as we observed for density and heat capacity. Indeed, the LLT boundaries observed by different teams at K all qualitatively extrapolate toward the proposes critical point (see figure 1 a)Knudson et al. (2015); Ohta et al. (2015); McWilliams et al. (2016); Zaghoo et al. (2016); Zaghoo and Silvera (2017); Celliers et al. (2018). The observation of a sharper transition in the low-temperature compression experiments of Knudson et al. Knudson et al. (2015), in comparison to those performed by Cellier et al. Celliers et al. (2018) at higher , is also consistent with supercritical behavior. We propose that a polyamorphic solution framework, which we validated in our simulations, could be used to macroscopically model the stability and miscibility of atomic and molecular hydrogen. Such a model provides a thermodynamic understanding of the LLT to directly interpret experiments and astrophysical observations in a way that accounts for the presence of a molecular-to-atomic transition in dense liquid hydrogen, with evidence against the existence of a first-order transition. Our approach, combining machine learning potentials trained on electronic structure calculations, thorough statistical sampling and macroscopic thermodynamic models, can be used to quantitatively assess the properties of mixtures of hydrogen and heavier elements, to address long-standing questions concerning Jupiter’s core solubility and the anomalous luminosity problem of SaturnGuillot (2005).
References
- McMahon et al. (2012) J. M. McMahon, M. A. Morales, C. Pierleoni, and D. M. Ceperley, Reviews of Modern Physics 84, 1607 (2012).
- Wigner and Huntington (1935) E. Wigner and H. B. Huntington, The Journal of Chemical Physics 3, 764 (1935), https://doi.org/10.1063/1.1749590 .
- Howie et al. (2012) R. T. Howie, C. L. Guillaume, T. Scheler, A. F. Goncharov, and E. Gregoryanz, Phys. Rev. Lett. 108, 125501 (2012).
- Zha et al. (2013) C.-s. Zha, Z. Liu, M. Ahart, R. Boehler, and R. J. Hemley, Phys. Rev. Lett. 110, 217402 (2013).
- Dalladay-Simpson et al. (2016) P. Dalladay-Simpson, R. T. Howie, and E. Gregoryanz, Nature 529, 63 (2016).
- Bonev et al. (2004) S. A. Bonev, E. Schwegler, T. Ogitsu, and G. Galli, Nature 431, 669 (2004).
- Ashcroft (1968) N. W. Ashcroft, Phys. Rev. Lett. 21, 1748 (1968).
- Guillot (2005) T. Guillot, Annual Review of Earth and Planetary Sciences 33, 493 (2005).
- Hubbard and Militzer (2016) W. B. Hubbard and B. Militzer, The Astrophysical Journal 820, 80 (2016).
- Celliers et al. (2018) P. M. Celliers, M. Millot, S. Brygoo, R. S. McWilliams, D. E. Fratanduono, J. R. Rygg, A. F. Goncharov, P. Loubeyre, J. H. Eggert, J. L. Peterson, N. B. Meezan, S. Le Pape, G. W. Collins, R. Jeanloz, and R. J. Hemley, Science 361, 677 (2018), http://science.sciencemag.org/content/361/6403/677.full.pdf .
- Knudson et al. (2015) M. Knudson, M. Desjarlais, A. Becker, R. Lemke, K. Cochrane, M. Savage, D. Bliss, T. Mattsson, and R. Redmer, Science 348, 1455 (2015).
- Ohta et al. (2015) K. Ohta, K. Ichimaru, M. Einaga, S. Kawaguchi, K. Shimizu, T. Matsuoka, N. Hirao, and Y. Ohishi, Scientific Reports 5 (2015), 10.1038/srep16560.
- McWilliams et al. (2016) R. S. McWilliams, D. A. Dalton, M. F. Mahmood, and A. F. Goncharov, Physical Review Letters 116 (2016), 10.1103/physrevlett.116.255501.
- Zaghoo et al. (2016) M. Zaghoo, A. Salamat, and I. F. Silvera, Physical Review B 93 (2016), 10.1103/physrevb.93.155128.
- Zaghoo and Silvera (2017) M. Zaghoo and I. F. Silvera, Proceedings of the National Academy of Sciences 114, 11873 (2017).
- Scandolo (2003) S. Scandolo, Proceedings of the National Academy of Sciences 100, 3051 (2003).
- Morales et al. (2010) M. A. Morales, C. Pierleoni, E. Schwegler, and D. M. Ceperley, Proceedings of the National Academy of Sciences 107, 12799 (2010).
- Lorenzen et al. (2010) W. Lorenzen, B. Holst, and R. Redmer, Phys. Rev. B 82, 195107 (2010).
- Delaney et al. (2006) K. T. Delaney, C. Pierleoni, and D. Ceperley, Physical review letters 97, 235702 (2006).
- Mazzola et al. (2018) G. Mazzola, R. Helled, and S. Sorella, Phys. Rev. Lett. 120, 025701 (2018).
- Vorberger et al. (2007) J. Vorberger, I. Tamblyn, B. Militzer, and S. A. Bonev, Physical Review B 75 (2007), 10.1103/physrevb.75.024206.
- Behler and Parrinello (2007) J. Behler and M. Parrinello, Physical Review Letters 98, 146401 (2007).
- Zha et al. (2017) C.-s. Zha, H. Liu, S. T. John, and R. J. Hemley, Physical review letters 119, 075302 (2017).
- Monserrat et al. (2016) B. Monserrat, R. J. Needs, E. Gregoryanz, and C. J. Pickard, Physical Review B 94, 134101 (2016).
- Needs and Pickard (2016) R. J. Needs and C. J. Pickard, APL Materials 4, 053210 (2016).
- Anisimov et al. (2018) M. A. Anisimov, M. Duška, F. Caupin, L. E. Amrhein, A. Rosenbaum, and R. J. Sadus, Physical Review X 8, 011004 (2018).
- Laio and Parrinello (2002) A. Laio and M. Parrinello, Proceedings of the National Academy of Sciences 99, 12562 (2002).
- Soper and Ricci (2000) A. K. Soper and M. A. Ricci, Physical review letters 84, 2881 (2000).
- Cheng et al. (2019) B. Cheng, E. A. Engel, J. Behler, C. Dellago, and M. Ceriotti, Proc. Natl. Acad. Sci. USA 116, 1110 (2019).
Supporting Information
\foreach\xin 2,3,4,5,6,7,8,9,10,11,12,13,14,15,16,17,18,19,20,21,22
See pages \x of SI